U N I V E R S I T Y OF D O R T M U N D
REIHE COMPUTATIONAL INTELLIGENCE COLLABORATIVE RESEARCH CENTER 531
Design and Management of Complex Technical Processes and Systems by means of Computational Intelligence Methods
User Group-based Workload Analysis and Modelling
Baiyi Song, Carsten Ernemann, and Ramin Yahyapour
No. CI-191/05
Technical Report ISSN 1433-3325 January 2005
Secretary of the SFB 531 · University of Dortmund · Dept. of Computer Science/XI 44221 Dortmund·Germany
This work is a product of the Collaborative Research Center 531, “Computational Intelligence,” at the University of Dortmund and was printed with financial support of the Deutsche Forschungsgemeinschaft.
1
User Group-based Workload Analysis and Modelling
Baiyi Song, Carsten Ernemann, and Ramin Yahyapour
Computer Engineering Institute, University Dortmund, 44221 Dortmund, Germany e-mail: {song.baiyi, carsten.ernemann, ramin.yahyapour}@udo.edu
Abstract— Knowledge about the workload is an important aspect for scheduling of resources as parallel computers or Grid components. As the scheduling quality highly depends on the characteristics of the workload running on such resources, a representative workload model is significant for performance evaluation. Previous approaches on workload modelling mainly focused on methods that use statistical distributions to fit the overall workload characteristics. Therefore, the individual as- sociation and correlation to users or groups are usually lost.
However, job scheduling for single parallel installations as well as for Grid systems started to focus more on the quality of service for specific user groups. Especially for Grid scenarios the optimization objective pursuited by the scheduling system is not generally known. Here, detailed knowledge of the individual user characteristic and preference is necessary for developing appropriate scheduling strategies. In the absence of a large information base of actual workloads, the adequate modelling of submission behaviors is sought. In this paper, we propose a new workload model, called MUGM (Mixed User Group Model), which maintains the characteristics of individual user groups. To this end, existing workload traces from real parallel systems have been analyzed and modelled. Within this work new insights on the workload compositions have been found. The MUGM method has been further evaluated and shown to yield good results.
I. INTRODUCTION
The scheduling in many variants has been examined in research for a very long time. Especially parallel job schedul- ing is considerably well understood. Here, the scheduling system is a vital component for the whole parallel computer as the applied scheduling strategy has direct impact on the overall performance of the computer system. The evaluation of scheduling algorithms is important to identify appropriate algorithms and the corresponding parameter settings. The results of theoretical worst-case analysis are only of limited help as typical workloads on production machines do normally not exhibit the specific structure that will create a really bad case. In addition, theoretical analysis is often very difficult to apply to many scheduling strategies due to their complexity.
The development of new scheduling systems seems to focus more on the usability of algorithms in real life scenarios. That is, the system administrator might prefer a higher flexibility in setting up individual access policies and often complex scheduling rules. Especially the advent of Grid computing and the need for efficient Grid scheduling strategies inhibit many requirements that are difficult to analyze theoretically.
Furthermore, it is known that there is no random distribution of job parameter values, see e.g. Feitelson and Nitzberg [13].
Instead, the job parameters depend on several potentially unknown patterns, relations, and dependencies. However, the
number of users on a parallel computer is usually not very large. That is, their individual behavior has still a major impact on the scheduling outcome of many strategies. Hence, a theoretical or practical analysis of random workloads will not provide the desired information. A trial and error approach on a production machine is tedious and significantly affects the system performance. Thus, it is usually not practicable to use a production machine for the evaluation except for the final testing.
Therefore simulations are very often used during the design and evaluation process of scheduling systems. These simula- tions are usually based on real trace data or on a workload model. Workload models, as by Jann et al. [17] or Feitelson and Nitzberg [13], enable a wide range of simulations by allowing job modifications, like a varying amount of assigned processor resources. However, many unknown dependencies and patterns exist in actual workloads of real systems. Here, the consistence of a statistical generated workload model with real workloads is difficult to guarantee.
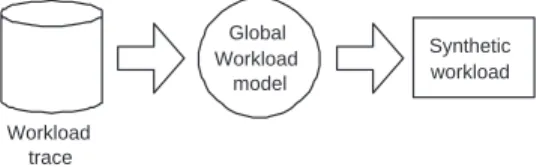
Previous research focused on modelling the summarized and combined output of all features in a workload of a parallel computer [21], [3] as shown in Figure 1. They analyzed the global character of several workload attributes (e.g., runtime, parallelism, arrival time) and applied certain distributions to describe them. However these models were general description and did not consider individual user submissions.
Workload trace
Global Workload
model
Synthetic workload
Fig. 1. The Global Workload Modelling Structure.
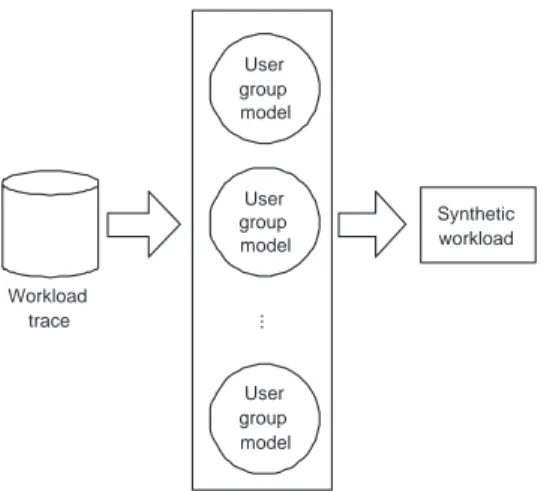
For many application scenarios a more detailed model is preferred, in which characteristics on the user or user-group model are maintained instead of a general description, see Figure 2. In this paper such a workload model is presented.
Such a model can not only give a straightforward illustration on the user’s submission characteristics but also provide a more intuitive method to understand the usage of machines by users. This is especially important for research in Grid environments.
In contrast to conventional parallel computing the schedul- ing objective in a Grid environment is not clear. Most schedul- ing strategies on parallel computers are optimized to minimize
User group model
User group model
User group model
...
Workload trace
Synthetic workload
Fig. 2. The Construction of User Group Model.
the response times, makespan or to increase the machine utilization. In a Grid environment the scheduling objective depends on the individual choice of the participants. Here, individual users may prefer the minimization of cost, while others accept a longer wait time in favor of a better quality of service, e.g. more or faster processors available. Thus, much research in this area involve scheduling strategies that include multi-criteria optimization and market-oriented methods [2], [9]. The evaluation of these strategies requires realistic work- load models that do not neglect the individual submission behavior of user groups. Due to the absence of accepted Grid workload models much analysis re-use the available workload information from parallel computer systems. This is reasonable as these computing sites and their respective user groups are naturally also the corner-stones of the current Grid user community. Therefore, thorough knowledge of the workload characteristic in regards to these user groups is needed for better evaluation of the scheduling systems.
Therefore in this paper we focus on analyzing and modelling existing user groups from available workloads from real instal- lation. Following we propose the novel model MUGM (Mixed User Group Model) for analysis of job characteristics from several different user groups. To construct the MUGM model, first jobs are partitioned into clusters such that the jobs with similar characteristics are placed in the same cluster. Then the users are grouped by the contribution of their submissions into these job clusters. To evaluate the presented method, several workload traces have been used and analyzed. The output of the MUGM has been statistically compared with original and not-used reference workloads.
This paper is structured as follows: In Section 2 we outline the workload modelling problem for parallel computers in more detail. After a brief analysis of workload characteristics in parallel environment in Section 3, we provide a description of the proposed MUGM method. In Section 5, we discuss the experimental results for several real workloads. Finally, we end the paper in Section 6 with a short conclusion and outlook on future work.
II. RELATEDWORK ONWORKLOADMODELLING
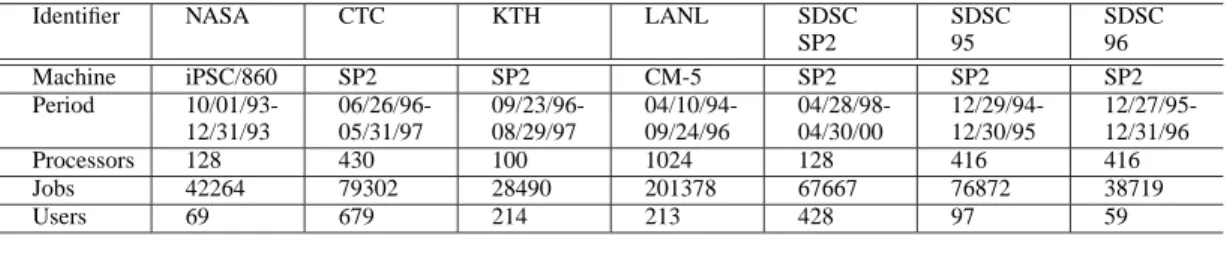
In this paper we analyze several parallel computer workloads that are available from the Standard Workload Archive [26]. These workloads were gathered at different environments of larger parallel computing sites. Many pub- lications adopted these traces for their workload modelling and evaluation of scheduling algorithms [23], [11], [14]. The details of the workloads are given in Table I. It is noteworthy that the named trace from NASA is quite old and has an unusual submission characteristic, therefore we did not include it in our study.
As mentioned above, the most common approach for work- load modelling is to create a combined model for an observed workload [4], [5]. Generally this summary is a statistical distribution or a collection of such for various workload attributes (e.g. runtime, parallelism, I/O, memory). Then, a new synthetic workload is created by sampling from these distributions. The construction of such models is done by fitting the overall attribute characteristic to well-known dis- tributions by comparing the histogram observed in the data to the expected frequencies of the theoretical distribution, i.e., Chi-square or KS test.
Since the runtime and the parallelism of jobs are two of the most important parameters for many parallel systems [10], [1], [24], we currently limit ourselves to the modelling these two attributes and focus on them in the following part of the paper.
The modelling of the arrival process is also very important and has been addressed by many papers, see [20], [3], [21]
for more detailed information about the job arriving process modelling.
The job runtime is the duration that a job occupies during execution on a processor set. In general, the runtime varies widely. Figure 3 shows a histogram of the runtime in the KTH workload trace. Here, the runtime varies significantly from1 to over105seconds. Such a distribution characteristic is called heavy-tail and can be formally defined as follows: a random variableX is a heavy-tailed distribution if
P[X > x]∼cx−α, as x→ ∞,0< α <2
where c is a positive constant, and ∼ means that the ratio of the two sides tend to 1 for x→ ∞. This distribution has infinite variance; and ifα≤1 it has an infinite mean.
To model a heavy-tail runtime distribution, Downey [6]
proposed a multi-stage log-normal distribution. This method is based on the observation that the empirical distribution of runtime inlogspace was approximately linear. Jann et.al. [17]
proposed a more general model by using a Hyper-Erlang distribution for the runtime. They used moment estimation to model the distribution parameters. Feitelson [12] argued that a moment estimation may suffer from several problems, including incorrect representation of the shape of the dis- tribution and high sensitivity to sparse high value samples.
Instead, Lublin and Feitelson [21] selected a Hyper-Gamma distribution. They calculated the parameters by Maximum Likelihood Estimations.
Another important aspect of workload modelling is the job parallelism, that is, the number of nodes or processors a
Identifier NASA CTC KTH LANL SDSC SP2
SDSC 95
SDSC 96
Machine iPSC/860 SP2 SP2 CM-5 SP2 SP2 SP2
Period 10/01/93- 12/31/93
06/26/96- 05/31/97
09/23/96- 08/29/97
04/10/94- 09/24/96
04/28/98- 04/30/00
12/29/94- 12/30/95
12/27/95- 12/31/96
Processors 128 430 100 1024 128 416 416
Jobs 42264 79302 28490 201378 67667 76872 38719
Users 69 679 214 213 428 97 59
TABLE I
USEDWORKLOADS FROM THESWF ARCHIVE.
KTH
runtime[s]
Frequency 050010001500
1 101 102 103 104 105
Fig. 3. Histogram of Job Runtimes.
job requires. It has been found that the job parallelism in many workloads displays two significant characteristics [6], [11]: the power of 2 effect, as jobs tend to require power of 2 node sets; and a high number of sequential jobs that require only a single node. These two features can be seen in Figure 4. Lo et.al. [20] found empirically that these effects would significantly affect the evaluation of scheduling perfor- mance. Feitelson [11] proposed a harmonic distribution which emphasized small parallelism and the other specific sizes like power of 2. Later, Lublin and Feitelson used job partitions to explicitly emphasized power of two effects in parallelism [21].
Besides the isolated modelling of each attribute, the cor- relations between different attributes were addressed as well.
For example, Lo et.al. [20] demonstrated that the neglection of correct correlation between job size and runtime yields misleading results. Therefore Jann et.al. [17] divided the job sizes into subranges then created a separate model of the runtime for each range. Furthermore, Feitelson and Lublin [21]
considered the correlation according to a two-stage Hyper- Exponential distribution.
Although these models can provide an overall description of a workload, they can not give an deeper insight on the individual job submission behavior. For example, a Hyper- Exponential distribution distribution can describe the heavy tailed runtime in parallel machine, but the information is lost how this heavy-tailed was actually created by user submis- sions. Similarly, the high amount of sequential jobs can be modelled by harmonic distributions, but it is not clear where
KTH
parallelism Frequency 02000400060008000
1 21 22 23 24 25 26 27
Fig. 4. Histogram of Job Parallelism in the KTH Workload
the sequential jobs came from. In general, the global and summarized characterization does not provide a model for users or user groups. And thus cannot give hints to relate the performance metrics to user groups.
Since the active user community on a parallel computer is usually quite small, e.g. hundreds of users as shown in Table I, it would be quite beneficial to associate the model and the resulting workload with users or user groups. With such user-level information it is possible to analyze the impact of certain groups to the overall system performance. In addition, it is possible to associate different scheduling objectives and methods with the different user groups. This can help to evaluate and analyze scheduling strategies for Grid scenarios.
To this end, a new workload model is proposed in this paper that maintains user and group information. In the next section, we will provide a brief view on the characteristics of individual user submission behavior in real workloads.
III. ANALYSIS OFUSERS INWORKLOADS
One of the obvious characteristics we can observe in the 6 examined workloads is the sparsity of users. That means, only a few users are responsible for thousands of jobs, while many other users just generate very few jobs. Table II shows the number of submissions from individual users in the KTH workload: only a couple of users with more than 1000 job submissions and more than than 25 users with less than 1000 job submission. Actually, there are about 30,000 jobs from
over 200 users. This effect is similar for all other workload traces.
Another aspect about the workload data is the heterogeneity of the job submission pattern between different users. In Figure 5 the averages of job parallelism are plotted for the top 10 users with the most submissions: the heterogeneity can be seen clearly as some try to submit jobs with high parallelism (e.g. user IDs={91,93}), while some tend to make submissions with lower parallelism (e.g. user IDs={18,67}). We have also examined the other workloads and found similar results.
# of Job Submission # of Users (%)
[1,100[ 68.22
[100,500[ 18.22
[500,1000[ 12.15
[1000,2000[ 0.93
more than 2000 0.47
TABLE II
COMPARISON OFUSERSUBMISSIONS.
KTH
userID average parallelism 02468
Fig. 5. Comparison of Average Job Parallelism for an Individual Users.
The main challenge in the construction of a new model addressing the individual submission behaviors is to find a trade-off between two extremes. One extreme is the sum- marization in a general probability model for the whole job submissions. As the other extreme a unique model is created for each user based on his or her past transaction data, e.g.
using hundreds of distributions for different users. Even if we would follow this approach, it suffers from two significant problems: there is not enough information for those users with only few job submissions; even for those users with enough data to model, the number of parameters will be so large that the interpretability and scalability of the model are lost.
As a consequence, we would like to get a mixture of user groups that summarizes similar user submission behaviors, while each of these groups has distinct features. Our proposed model allows to address the user submission behaviors, while it maintains simplicity and scalability. In the next section we will give the details about our new model.
IV. MODELLING
Before we describe our MUGM model in more detail, some definitions are given. We denote D as the set of n jobs by D={d1, . . . , dn}, where di represents the parameter set for job i, including e.g. the number of processors, the expected runtime, memory. This parameter set can easily be extended to contain additional job information. As previously mentioned, we currently focus only on the parameters parallelism and runtime. Thus, we use p(di)to represent the parallelism and r(di) for the runtime of job i. The jobs are generated by J users, where the userj generates jobi: u(di) =j, j∈[1, J].
In our MUGM model the workload is analyzed to classify users intoK user groups. Note that we do not assume these Kgroups necessarily represent the true physical groups in the real environment. The membership of a user j is identified by m(j) = k, k ∈ [1, K]. The users in the same group are assumed to have a similar job submission behavior. Thus the kth group 1 ≤ k ≤ K will represent a specific model for generating corresponding jobs.
Data processing
Job clustering
User grouping
Group Analyzing
Group modelling
Synthetic workload generation
Fig. 6. Process of the MUGM Model.
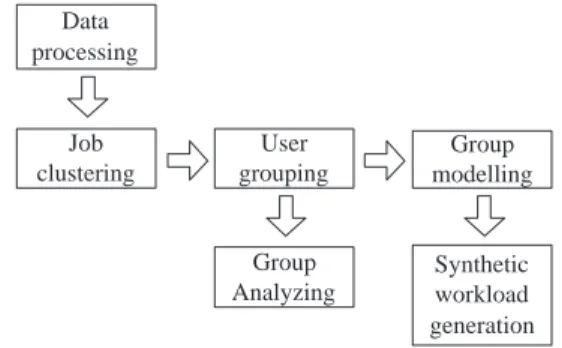
Figure 6 gives an overview on the construction of the MUGM model. We first find different job clusters or types using cluster algorithm to partition jobs. In this step the user origin is not considered. Instead only common job types are identified by this clustering. Then each user is characterized by a feature vector, which describes the contribution of this user to each job cluster. Afterwards, we use these feature vectors to identify user groups. To this end, the users are clustered by their feature vectors. In this way the users are grouped by their similar contribution pattern to the previously identified com- mon job clusters. Next, we analyze and model the submissions characteristic of each user group. The combination of this submission models generates the complete MUGM workload.
In the following, each step in the MUGM process is described in more detail.
A. Data preprocessing
Parallelism and runtime values both cover a wide range that is only bound by zero. Therefore, it is common practice to apply a logarithmic transformation for analysis and modelling.
Here, a log transformations based on 2 was used. That is, parallelism and runtime are transformed by lgp(di) and lgr(di). Zero values are neglected as they are very rare (less than 0.3%).
B. Job clustering
The first step of our MUGM model is to cluster all jobs into several groups. Parallelism and runtime are separately clustered in order to maintain sharper partition border. That is, the different job clusters differ in parallelism or runtime.
Each job is uniquely assigned to one cluster.
To cluster the parallelism we round the values p(D)to the lgp(D) + 0.5. Such a clustering method is based on the above mentioned observation of the power of 2 preference in parallelism. For the runtimes we choose a clustering algorithm calledCLARAproposed in [18] because of its computational efficiency.
This algorithm is based on the Partition Around Medoids (PAM) method which is also presented in [18]. The P AM clustering procedure takes the unprocessed items as input and produces a set of cluster centers or so called ”medoids”. In the following, we briefly describe the general approach of the PAM method. Let X = {x1, . . . , xT} be the input element set of size T, and H be the number of clusters, and M = (M1, . . . , MH) denotes the list of identified mediods in X.
The minimal distance of each element to the mediods can be calculated by
distance(xt, M) =minh∈[1,H]{||xt, Mh||}.
Next, the PAM method selects the set of medoids M∗ by minimizing the sum of the distances f(M) =
t∈Tdistance(xt, M). An overview of the cluster algorithm PAM is given in Figure 7.
It can be seen that the complexity of a single iteration is O(H ·(T −H)2). It is therefore computationally quite time consuming for large values of T and H. For instance, T in our evaluation equals the number of jobs n which is larger than 20,000. The difference between theP AM andCLARA algorithms is that the latter is uses only a sampled subsetS⊂ X before applying the same PAM method. This reduces the complexity to O(H· |S|2+H ·(T −H)) for each iteration comparing to the O(H·(T−H)2).
In our case each element is a runtime value. We use the Euclidean distance between two logarithmic scaled runtimes, which is
(lgr(di)−lgr(di))2
. To decide the number of clusters, we do not adopt classical methods like e.g. silhouette, Gap statistic [22], [27] because they caused a large number (more than 20) of small clusters.
However, large number of clusters increase the complexity level for the whole MUGM method. In our analysis we tried several number of clusters, e.g. 2, 4, 6, 8, 10,..., 20. However, it turned out that the final modelling quality did not increase for more than 4 clusters. Note, that this has to be verified if the model is applied to other workload traces.
Overall, all jobs have been partitioned into L clusters distinguished by this CLARA clustering of job runtimes and the lg-clustering of their degree of parallelism. The next step is the grouping of users based on their contribution to these job clusters.
PROCEDUREP AM clustering(X, H) Input: elements to be clustered,
X ={x1, . . . , xT} Input:H the number of clusters
Output: cluster medoidsM = (M1, . . . , MH) Output: cluster membership
g:X → {1, . . . , H} BEGIN
Set M to initial value, e.g. random selection from X FOREACH t∈[1, T] LOOP
g(xt) =argminh∈[1,H]distance(xt, Mh) END LOOP;
WHILE M has changed LOOP FOREACHh∈[1, H]LOOP
recalculate the Mh of
each cluster{xt|g(xt) =h, t∈[1, T]} END LOOP;
FOREACHt∈[1, T]LOOP
g(xt) =argminh∈[1,H]distance(xt, Mh) END LOOP;
END LOOP;
RETURN M, g;
END PROCEDURE;
Fig. 7. Algorithm for theP AMClustering.
C. User Grouping
We can characterize the submission of user j by a feature vector αj = (αj1, . . . , αjL), where αjl denotes the fractions of user j submissions belonging to job cluster l, l ∈ [1, L].
Obviously there is
l∈[1,L]αjl = 1,∀j∈[1, J].
Now we can cluster all users intoKgroups by their feature vectors. The similarity of users is characterized by the distance of their feature vectors. Since different users have different number of job submissions, we weight the distance between the feature vectors of users by their corresponding number of job submissions. In detail, the distanced(j, j)between user j andj is defined by
d(j, j) =||αj−αj|| ·|W|
|D|,
where W = {di|(u(di) = j)∨(u(di) = j);i ∈ [1, n]}.
That is, we divide the number of jobs belonging to user j andj by the number of all jobs, and then multiply the result by the distance between both feature vectors. With weighted distances between the feature vectors, the P AM clustering algorithm is again applied to partition the users intoKgroups.
The determination of the actual number of groupsKis given in the Section V.
D. Workload Modelling of Identified User Groups
After clustering the users into several groups, we charac- terize all jobs submitted from the users of a group using statistical methods. There are several common methods to describe the data distribution. However we found that after the users are grouped, the characteristics of jobs originated
by each user group can not easily be described by a single distribution. Therefore we use model-based density estimation, that is described in more detail by Fraley and Raftery [15], to model the jobs from each group. This model-based method assumes that the data is generated by a combination of several distributions. To this end, this method determines the required parameters for a set of Gaussian distributions. This is done by multivariate normalizations with the highest posterior probability.
We denote the estimated combined distribution function for a user group k as Gk. However the Gk distribution function set does not address the power of 2 effect for the parallelism.
Hence, we extract the amount of power of 2 jobs fk in the original workload of a user group k. That is
fk= |{di|(lgp(di)∈)∨(m(u(di)) =k);i∈[1, n]}|
|{dj|m(u(dj)) =k;j∈[1, n]}| . Additionally the fraction of submission pk from group k is calculated by
pk =|Dk| D
, where Dk ={di|m(u(di)) =k;i ∈[1, n]}. In a summary, the workload of the user group k can be represented by Gk, fk, pk. In the next section, we will discuss our method to generate the combined synthetic workload.
E. Synthetic workload generation
In order to create a synthetic workload of n jobs by the MUGM model the following steps are applied:
1) For each user group k, we generatenk jobs withnk= n·pk from Gk. We generate the synthetic parallelism and runtime by sampling from the distribution Gk the corresponding sets Pk = {p1, . . . , pnk} and Rk = {r1, . . . , rnk}. However, we also have to inverse our previous scaling from IV-A and round to the nearest integer value:
Pk ={pk|pk =2pk+ 0.5;∀pk∈Pk} and Rk={rk|rk=2rk+ 0.5;∀rk ∈Rk}. 2) In order to model the power of 2 effect, a fraction of the
values inPk is rounded to the nearest power of 2 value.
That is, with a probability offk the simulated valuePk is modified.
3) The synthetic jobs from different user groups are com- bined. Particularly, we use probability pk to pick a job from groupk. According to this method we create the finalnjobs.
Note, that for a complete workload modelling not only the job characteristics of parallelism and runtime need to be mod- elled. In addition, a model for the job arrival process is needed.
As previously mentioned, several methods are available for this task [21]. In future work, a more sophisticated approach based on the user groups can be examined. Such an approach can include sequence submission patterns [25].
In the next section, we discuss the evaluation of the MUGM method with experimental results.
V. EVALUATION
To evaluate our MUGM method we used those 6 workloads from Standard Workload Archive as mentioned before. In order to validate our approach, some statistical comparison will be presented.
A. Analysis of Job Characteristic from User Groups
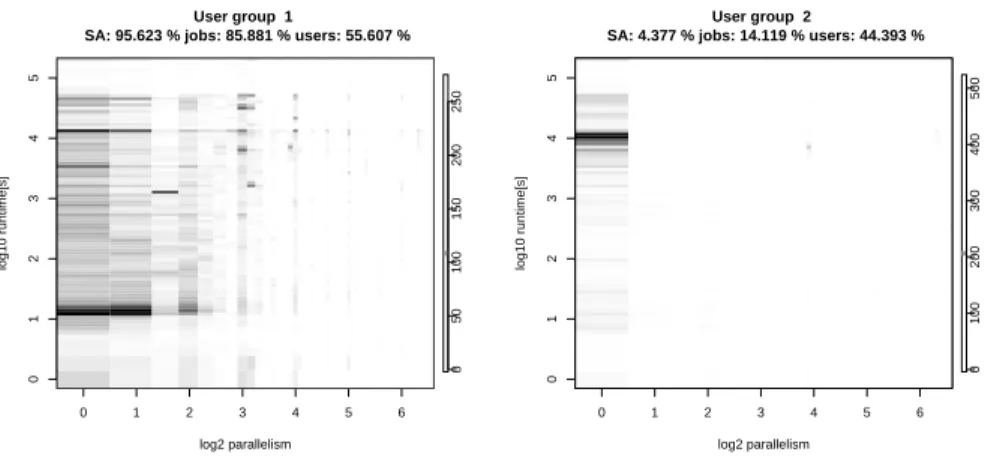
First, we examine the job characteristics of the resulting user group clusters. Due to the limited available space, primarily the results for the KTH workload are shown here. However, the other workloads exhibited similar results. Figure 8, 9, 10 display the results for different numbers of user group clusters K ={2,4,6}. The user groups are ordered left-to-right and top-to-bottom in descending order by their combined amount of workload. This is also referred to as the Squash Area SA, which is the total resource consumptions of all the jobs in each group. TheSAi for groupi, i∈[1, K] is calculated by:
SAi=
m(u(di))=i
p(di)·r(di)
. These figures give an idea of how much the parallel computer was utilized by one of the user groups.
The increase ofKforces the creation of more user groups.
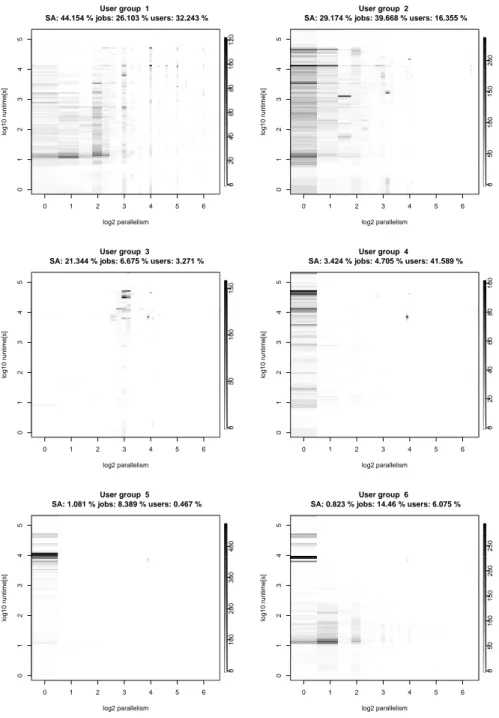
For example, for K = 2 there are two user groups: the first group submits a lot of short jobs, requiring below 10 seconds; the other group causes more sequential jobs with longer runtime requirements. The parallelism is nearly not distinguished in this classification. For K = 4 more detailed user groups are found, in which combinations of runtime and parallelism are found. However, for K = 6 it is noteworthy that some of the user groups cover only very few users with a small amount of workload. That is, for some of them SA contribution is even less than1%. It can be deduced that these groups have limited impact on the overall system behavior.
However, this has to be verified in future research work.
Nevertheless, the results indicated that with 4 user groups the workloads could be distinctively covered. It is worthwhile to notice that this applied to almost all of our workloads as can be seen in Table III. That is, there is only a limited number of distinctive features of user behaviors on real systems. It can be assumed that additional user clustering only yields groups with minor contribution to the workload. Therefore, in this paper we focused on the creation of 4 user clusters.
For the KTH modelling with 4 user groups the following characteristics of the user groups can be seen in Figure 9:
1) Users in Group 1 submit a lot of highly parallel jobs.
Many jobs require more than 1 node. Moreover, a large number of jobs run only for a short time of about 10 seconds. However, this group accounts for most of the resource assumption in terms of the SA. That is, over 40% of the total SAis caused by this group.
2) Users in Group 2 submit more jobs requiring relatively longer runtimes. Many of these jobs have a runtime of more than 103 seconds. Some are even larger than 104and near105seconds. This group also creates some highly parallel jobs. But comparing with the Group 1,
0 1 2 3 4 5 6
012345
User group 1
SA: 95.623 % jobs: 85.881 % users: 55.607 %
log2 parallelism
log10 runtime[s] 050100150200250
0 1 2 3 4 5 6
012345
User group 2
SA: 4.377 % jobs: 14.119 % users: 44.393 %
log2 parallelism
log10 runtime[s] 0100200300400500
Fig. 8. The results when 2 user groups are found with our MUGM model. The information in the header of each diagram show the relative contributions of each user group to the squashed areaSA, the total numbers of jobs and users.
0 1 2 3 4 5 6
012345
User group 1 SA: 44.974 % jobs: 40.1 % users: 37.85 %
log2 parallelism
log10 runtime[s] 050100150200
0 1 2 3 4 5 6
012345
User group 2
SA: 29.177 % jobs: 40.131 % users: 16.822 %
log2 parallelism
log10 runtime[s] 050100150200
0 1 2 3 4 5 6
012345
User group 3
SA: 21.344 % jobs: 6.675 % users: 3.271 %
log2 parallelism
log10 runtime[s] 050100150
0 1 2 3 4 5 6
012345
User group 4
SA: 4.505 % jobs: 13.094 % users: 42.056 %
log2 parallelism
log10 runtime[s] 0100200300400500
Fig. 9. The results when 4 user groups are found with our MUGM model. The information in the header of each diagram show the relative contributions of each user group to the squashed areaSA, the total numbers of jobs and users.
most of the job node requirements in this group are less than24.
3) It is interesting to note that jobs from Group 3 are quite specific in terms of runtime and parallelism. Most of these jobs have a parallelism around23 and a runtime over 103 seconds. These users do not have jobs with short runtimes like Groups 1 and 2. These jobs account only for about 6% of the total job number but over 20%
of the totalSA. Another point is that only 3% users are in this group.
4) In Group 4, users concentrate on submitting sequential jobs, requiring only 1 node. The runtime is also distinc- tive: most of them run around 104 seconds. Over 40%
of all users are in this group. It indicates that quite a lot of users use the machine primarily but infrequently for sequential jobs.
Workload # of User groups
User group information
2 (53.7, 80, 98.3), (46.3, 20, 1.7) 4 (46.3, 20, 1.7), (22.1, 20.4, 72.9) SDSC96 (18.7, 40.0, 23.7), (13, 19.6, 1.7) 6 (46.3, 20.0, 1.7), (20.6, 15.8, 71.2)
(17.1, 6.6, 1.7), (13, 19.6, 1.7) (1.6, 33.5, 22.0), (1.5, 4.6, 1.7) 2 (77.7, 57.4, 30.0), (22.3, 42.6, 70.0) 4 (75.9, 52.8, 26.7), (14.3, 24.1, 14.4) CTC (9.0, 17.6, 30.8), (0.7, 5.5, 28.1)
6 (49.5, 42.3, 17.4), (34.5, 15.2, 25.6) (11.1, 16.5, 10.9), (2.3, 6.8, 2.7) (2.1, 13.7, 16.1), (0.7, 5.5, 27.4) 2 (95.6, 85.9, 55.6), (4.4, 14.1, 44.4) 4 (45.0, 40.1, 37.9), (29.2, 40.1, 16.8) KTH (21.3, 6.7, 3.3), (4.5, 13.1, 42.1)
6 (44.2, 26.1, 32.2), (29.2, 39.7, 16.4) (21.3, 6.7, 3.3), (3.4, 4.7, 41.6) (1.1, 8.4, 0.5), (0.8, 14.5, 6.1) 2 (95.7, 89, 99.5), (4.3, 11, 0.5) 4 (66.3, 33.6, 22.5), (22.7, 25.7, 24.9) LANL (6.7, 29.6, 52.1), (4.3, 11, 0.5)
6 (53.2, 31.4, 22.1), (14.8, 19.9, 24.4) (13.1, 2.2, 0.5), (7.9, 5.9, 0.5) (6.7, 29.6, 52.1), (4.3, 11.0, 0.5) 2 (86.7, 71.6, 42.8), (13.3, 28.4, 57.2) 4 (65.5, 53.2, 25.2), (16.1, 5.9, 3.7) SP2 (12, 17.7, 34.1), (6.3, 23.2, 36.9)
6 (65.5, 53.2, 25.2), (16.1, 5.9, 3.7) (11.7, 15.7, 32.2), (5.7, 5.4, 1.6) (0.8, 2.6, 36.9), (0.2, 17.2, 0.2) 2 (99.7, 91.1, 99.0), (0.3, 8.9, 1.0) 4 (76.5, 68.6, 96.9), (23.0, 5.1, 1.0) SDSC95 (0.3, 8.9, 1), (0.3, 17.3, 1)
6 (68.9, 55.6, 94.8), (23.0, 5.1, 1.0) (7.5, 3.5, 1.0), (0.3, 8.9, 1.0) (0.3, 17.3, 1.0), (0.1, 9.5, 1.0) TABLE III
THEDETAILS(SA%, #OFJOBS%, #OFUSERS%)OFUSERGROUPS IDENTIFIED BYMUGM
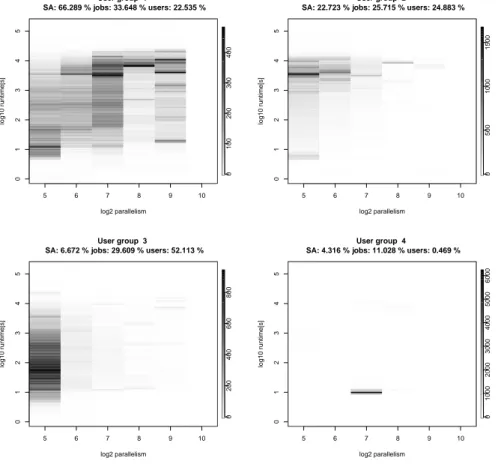
Note, that the other workloads do not exhibit the same group characteristics, as can be seen exemplarily in Figure 11 for the LANL workload. However, as mentioned before about 4 user groups can also be identified.
B. Statistic comparison of synthetic and original workloads A common method of examining the similarity between the original and modelled workload distribution is the Kolmogorov-Smirnov (KS) test [19]. This test looks at the maximum difference between two distribution functions. This criterion is adopted in several papers [21], [16].
The KS test results are given in Table IV. It can be seen that the output of our MUGM method yields good results for most workload traces. That is, the KS value is below 0.10 in all cases and at 0.05 on average.
In Table V we present the correlation between the par- allelism and the runtime for the synthetic and the original workload. As shown in the Table the synthetic data from our MUGM model displays the similar correlation as that from original data.
VI. CONCLUSION
In this paper we proposed a novel method MUGM (Mixed User Group Model) for analyzing and modelling workload
Parallelism Runtime
SDSC 96 0.06 0.03
CTC 0.04 0.06
KTH 0.05 0.07
LANL 0.04 0.06
SP2 0.03 0.05
SDSC 95 0.04 0.06
TABLE IV
KS TESTRESULTS(Dn)OF THEMODELLED AND THEORIGINAL WORKLOADS.
Original Synthetic
SDSC 96 0.37 0.30
CTC −0.03 −0.01
KTH 0.01 −0.00
LANL 0.17 0.19
SP2 0.15 −0.00
SDSC95 0.28 0.25
TABLE V
COMPARISONS OF THECORRELATIONS BETWEEN THEMODELLED AND THEORIGINALWORKLOADS.
traces. The main advantage of this method is the consideration of individual user groups. Our MUGM method has been applied to several workloads from real installations. Here, it is interesting that the analysis of the workloads exhibited that only a few distinct user groups exists. This applied to all examined workloads.
The presented method allows the creation of new synthetic workloads modelled after the original user group character- istics. This method can be used to evaluate new scheduling strategies. The job submission process has now a direct association with individual user groups. This information can be exploited for individualized quality criteria considered by scheduling strategies. Furthermore, additional workload parameters can be modelled in regards to individual scheduling objectives of these user groups. This applies especially to the Grid scheduling scenario in which the scheduling objective is not globally given for a specific computing system but depends on the user preferences.
As found in [7], [8], [9] new scheduling systems can also benefit by dynamic adaptation according to the current system state. This enables the scheduler to dynamically adjust its parameterizations and consequently its behavior. This can include predictions strategies for user or groups based on these results.
Further research is necessary to include individual mod- elling strategies for the job arrival. Here, sequential depen- dencies for users or groups can be considered to improve the quality in the modelling of the temporal submission behavior.
REFERENCES
[1] Kento Aida. Effect of Job Size Characteristics on Job Scheduling Performance. In Dror G. Feitelson and Larry Rudolph, editors, Job Scheduling Strategies for Parallel Processing, volume 1911, pages 1–
17. Springer Verlag, 2000. Lecture Notes in Computer Science (LNCS).
[2] Rajkumar Buyya, Jonathan Giddy, and David Abramson. An evaluation of economy-based resource trading and scheduling on computational power grids for parameter sweep applications. In The Second Workshop on Active Middleware Services (AMS 2000), In conjuction with Ninth
IEEE International Symposium on High Performance Distributed Com- puting (HPDC 2000), Pittsburgh, USA, August 2000. Kluwer Academic Press.
[3] Walfredo Cirne and Francine Berman. A Comprehensive Model of the Supercomputer Workload. In 4th Workshop on Workload Characteriza- tion, December 2001.
[4] Walfredo Cirne and Francine Berman. A Model for Moldable Supercom- puter Jobs. In Proceedings of the IPDPS 2001 - International Parallel and Distributed Processing Symposium, April 2001.
[5] Allen B. Downey. A Parallel Workload Model and its Implications for Processor Allocation. Technical Report CSD-96-922, University of California, Berkeley, November 1996.
[6] Allen B. Downey. Using queue time predictions for processor allocation.
In Dror G. Feitelson and Larry Rudolph, editors, Job Scheduling Strategies for Parallel Processing, pages 35–57. Springer Verlag, 1997.
Lect. Notes Comput. Sci. vol. 1291.
[7] Carsten Ernemann, Volker Hamscher, Uwe Schwiegelshohn, Achim Streit, and Ramin Yahyapour. Enhanced Algorithms for Multi-Site Scheduling. In Proceedings of the 3rd International Workshop on Grid Computing, Baltimore. Springer–Verlag, Lecture Notes in Computer Science LNCS, 2002.
[8] Carsten Ernemann, Volker Hamscher, and Ramin Yahyapour. Economic Scheduling in Grid Computing. In Dror G. Feitelson, Larry Rudolph, and Uwe Schwiegelshohn, editors, Job Scheduling Strategies for Par- allel Processing, volume 2537, pages 128–152. Springer Verlag, 2002.
Lecture Notes in Computer Science (LNCS).
[9] Carsten Ernemann and Ramin Yahyapour. ”Grid Resource Management - State of the Art and Future Trends”, chapter ”Applying Economic Scheduling Methods to Grid Environments”, pages 491–506. Kluwer Academic Publishers, 2003.
[10] Mark S. Squillante Fang Wang, Marios C. Papaefthymiou. A gang scheduling design for multiprogrammed parallel computing environ- ments. In D.G. Feitelson and L. Rudolph, editors, IPPS’96 Workshop:
Job Scheduling Strategies for Parallel Processing, pages 111–125.
Springer–Verlag, Lecture Notes in Computer Science LNCS 1162, 1996.
[11] Dror G. Feitelson. Packing Schemes for Gang Scheduling. In Dror G.
Feitelson and Larry Rudolph, editors, Job Scheduling Strategies for Parallel Processing, volume 1162, pages 89–110. Springer-Verlag, 1996.
Lecture Notes in Computer Science (LNCS).
[12] Dror G. Feitelson. Workload Modeling for Performance Evaluation. In Mariacarla Calzarossa and Sara Tucci, editors, Performance Evaluation of Complex Systems: Techniques and Tools, volume 2459, pages 114–
141. Springer Verlag, 2002. Lecture Notes in Computer Science (LNCS).
[13] Dror G. Feitelson and Bill Nitzberg. Job Characteristics of a Production Parallel Scientific Workload on the NASA Ames iPSC/860. In D. G.
Feitelson and L. Rudolph, editors, IPPS’95 Workshop: Job Scheduling Strategies for Parallel Processing, pages 337–360. Springer, Berlin, Lecture Notes in Computer Science LNCS 949, 1995.
[14] Dror G. Feitelson, Larry Rudolph, Uwe Schwiegelshohn, Kenneth C.
Sevcik, and Parkson Wong. Theory and practice in parallel job scheduling. In IPPS’97 Workshop: Job Scheduling Strategies for Parallel Processing, volume 1291 of Lecture Notes in Computer Science (LNCS), pages 1–34. Springer, Berlin, April 1997.
[15] Chris Fraley and Adrian E Raftery. Model-based clustering, discriminant analysis, and density estimation. Journal of the American Statistical Association, 97(458):611–631, 2002.
[16] Hubertus Franke, Pratap Pattnaik, and Larry Rudolph. Gang scheduling for highly efficient distributed multiprocessor systems. In Proceedings of the 6th Symp. on the Frontiers of Massively Parallel Computation, pages 1–9, 1996.
[17] Joefon Jann, Pratap Pattnaik, Hubertus Franke, Fang Wang, Joseph Skovira, and Joseph Riodan. Modeling of Workload in MPPs. In Dror G. Feitelson and Larry Rudolph, editors, IPPS’97 Workshop: Job Scheduling Strategies for Parallel Processing, pages 94–116. Springer–
Verlag, Lecture Notes in Computer Science LNCS 1291, 1997.
[18] Leonard Kaufman and Peter J. Rousseeuw. Finding groups in data: an introduction to cluster analysis. John Wiley Sons, 1990.
[19] Hubert Lilliefors. On the Kolmogorov-Smirnov Test for the Exponential Distribution with Mean Unknown. Journal of the American Statistical Association, 64:387–389, 1969.
[20] Virginia Lo, Jens Mache, and Kurt Windisch. A comparative study of real workload traces and synthetic workload models for parallel job scheduling. In Dror G. Feitelson and Larry Rudolph, editors, Job Scheduling Strategies for Parallel Processing, volume 1459 of Lecture Notes in Computer Science, pages 25–46. Springer-Verlag, 1998.
[21] Uri Lublin and Dror G. Feitelson. The Workload on Parallel Supercom- puters: Modeling the Characteristics of Rigid Jobs. Technical Report 2001-12, Hebrew University, Oct 2001.
[22] Glenn Milligan and Martha Cooper. An examination of procedures for determining the number of clusters in a data set. Psychometrika, 50(2):159–179, 1985.
[23] Emilia Rosti, Evgenia Smirni, Lawrence W. Dowdy, Giuseppe Serazzi, and Brian M. Carlson. Robust Partitioning Policies of Multiprocessor Systems. Performance Evaluation Journal, Special Issue on Parallel Systems, 19(2-3):141–165, 1994.
[24] Bettina Schnor, Stefan Petri, Reinhard Oleyniczak, and Horst Lan- gend¨orferorfer. Scheduling of parallel applications on heterogeneous workstation clusters. In Proc. of PDCS’96, Dijon, France, 1996.
[25] Baiyi Song, Carsten Ernemann, and Ramin Yahyapour. Parallel Computer Workload Modeling with Markov Chains. In Dror G. Feitel- son, Larry Rudolph, and Uwe Schwiegelshohn, editors, Job Scheduling Strategies for Parallel Processing: 10th International Workshop, JSSPP 2004 New York, USA, June, 2004.
[26] Parallel Workloads Archive. http://www.cs.huji.ac.il/labs/paral- lel/workload/, November 2004.
[27] Robert Tibshirani, Guenther Walther, and Trevor Hastie. Cluster valida- tion by prediction strength. Technical report, Department of Statistics, Stanford University, 2001.
APPENDIX
0 1 2 3 4 5 6
012345
User group 1
SA: 44.154 % jobs: 26.103 % users: 32.243 %
log2 parallelism
log10 runtime[s] 020406080100120
0 1 2 3 4 5 6
012345
User group 2
SA: 29.174 % jobs: 39.668 % users: 16.355 %
log2 parallelism
log10 runtime[s] 050100150200
0 1 2 3 4 5 6
012345
User group 3
SA: 21.344 % jobs: 6.675 % users: 3.271 %
log2 parallelism
log10 runtime[s] 050100150
0 1 2 3 4 5 6
012345
User group 4
SA: 3.424 % jobs: 4.705 % users: 41.589 %
log2 parallelism
log10 runtime[s] 020406080100
0 1 2 3 4 5 6
012345
User group 5 SA: 1.081 % jobs: 8.389 % users: 0.467 %
log2 parallelism
log10 runtime[s] 0100200300400
0 1 2 3 4 5 6
012345
User group 6 SA: 0.823 % jobs: 14.46 % users: 6.075 %
log2 parallelism
log10 runtime[s] 050100150200250
Fig. 10. The results when 6 user groups are found with our MUGM model. The information in the header of each diagram shows the relative contributions of each user group to the squashed areaSA, the total numbers of jobs and users.
5 6 7 8 9 10
012345
User group 1
SA: 66.289 % jobs: 33.648 % users: 22.535 %
log2 parallelism
log10 runtime[s] 0100200300400
5 6 7 8 9 10
012345
User group 2
SA: 22.723 % jobs: 25.715 % users: 24.883 %
log2 parallelism
log10 runtime[s] 050010001500
5 6 7 8 9 10
012345
User group 3
SA: 6.672 % jobs: 29.609 % users: 52.113 %
log2 parallelism
log10 runtime[s] 0200400600800
5 6 7 8 9 10
012345
User group 4
SA: 4.316 % jobs: 11.028 % users: 0.469 %
log2 parallelism
log10 runtime[s] 0100020003000400050006000
Fig. 11. The results when 4 user groups are found with our MUGM model. The information in the header of each diagram shows the relative contributions of each user group to the squashed areaSA, the total numbers of jobs and users.