in massive stellar clusters
-
From gas-embedded to dissolving populations
I N A U G U R A L - D I S S E R T A T I O N
zur
Erlangung des Doktorgrades
der Mathematisch-Naturwissenschaftlichen Fakult¨ at der Universit¨ at zu K¨oln
vorgelegt von Manuel Steinhausen
aus Solingen
Max-Planck-Institut f¨ ur Radioastronomie Bonn
2013
Prof. Dr. Joachim Krug . . . .
Tag der m¨ undlichen Pr¨ ufung: 14. Mai 2013
Die aktuelle Vorstellung von Sternenstehung besagt, dass Sterne nicht einzeln sondern bevorzugt in Sternhaufen entstehen. Als Folge des Entstehungsprozesses sind die jun- gen Sterne anf¨anglich von zirkumstellaren Scheiben umgeben, welche aus Staub und Gas bestehen. Bisherige Untersuchungen des Einflusses von Vorbeifl¨ ugen anderer Sternhaufen- mitglieder auf diese Scheiben konzentrierten sich ausschließlich auf die fr¨ uhe Phase der Sternhaufenentwicklung (< 3 Millionen Jahre), w¨ ahrend der die Sterne noch im Gas aus der Entstehungsphase eingebettet sind. In dieser Arbeit wurde der Einfluss eines st¨ orenden Sterns auf das Stern-Scheibe System w¨ ahrend der gesamten ersten 15 Millionen Jahre der Entwicklung untersucht, also nicht nur die fr¨ uhe, eingebettete Phase sondern auch die Expansionsphase des Sternhaufens nach dem Ausstoß des umgebenden Restgases.
F¨ ur die eingebettete Phase wurden speziell die Auswirkungen unterschiedlicher Massen- verteilungen innerhalb der Scheiben auf Verluste durch Sternvorbeifl¨ uge untersucht. Ob- wohl der Einfluss der Massenverteilung auf die Scheibenverluste in Einzelst¨ oßen sich teil- weise stark unterscheidet, ist die Anzahl der Sterne mit gest¨orten Scheiben im Sternhaufen weitesgehend unabh¨ angig vom anf¨anglichen Dichteprofil. Die Ausnahme bilden sehr dichte Sternhaufen, bei denen Scheibenmasseverluste in den Kernregionen von 40% f¨ ur steile Masseverteilungen denen von 60% f¨ ur anf¨anglich flache Masseverteilungen gegen¨ uber ste- hen. Der Grund liegt in der Dominanz der massearmen Sterne in diesen Sternhaufen, welche aufgrund ihrer ¨ ublicherweise massiveren Stoßpartner die gr¨oßte Abh¨ angigkeit von der anf¨anglichen Massenverteilung zeigen.
Nachdem das Restgas aus dem Sternhaufen ausgestoßen wurde, verringert sich dessen stellare Dichte schnell. Dabei dehnt sich die dichte Kernregion um einen Faktor zehn aus und die Sterne des d¨ unn bev¨olkerten, ¨ außeren Randes verlassen den Sternhaufen. Somit nimmt die Zahl der St¨ oße deutlich ab und im Allgemeinen werden nur noch sehr wenige Scheiben w¨ ahrend dieser Phase zerst¨ ort.
Eine Folge dieser dynamischen Entwicklung ist, dass die große Menge der stellaren St¨ oße
in der Kernregion von eingebetteten Sternhaufen deutlich die beobachtete Scheibenh¨aufigkeit
der im Sternhaufen verbleibenden Sterne pr¨agt und somit eine nicht vorhandene Abnahme
der Scheibenh¨aufigkeit mit dem Sternhaufenalter suggeriert. Der große Anteil der Sterne,
die den Sternhaufen verlassen und in die Feldpopulation ¨ ubergehen, wird wenig von den
umliegenden Sternen beeinflusst, wodurch Planetenbildung in diesen Scheiben wesentlich
beg¨ unstigt ist.
Observations reveal that most stars do not form in isolation but as part of a star cluster.
Initially, the young stars constituting these clusters are surrounded by circumstellar discs.
Previous investigations concentrated on the consequences of stellar interactions for these circumstellar discs during the early phases (< 3 Myr), where the cluster is still embedded in its natal gas. By contrast, the relevance of star-disc encounters during the entire first 15 Myr of massive cluster development has been investigated in this work, including the gas-embedded and the cluster expansion phase.
In the embedded phase, the focus was on the influence of the initial shape of the disc-mass distribution. Although it has a significant impact on the relative disc-mass and angular momentum losses in certain single star-disc encounters, the fraction of stars with perturbed discs turns out to be fairly unaffected by the initial density profile. The exception are dense cluster environments, where disc destruction rates in the crowded core regions are 40% and 60% for steep and shallow disc-mass distributions, respectively. Here, the interactions of low-mass stars dominate, which show the largest dependency on the initial disc-mass distribution due to the generally high encounter mass ratios.
After the expulsion of the residual gas the stellar density drops rapidly so that the number of encounters is considerably lower, and very few discs are completely destroyed. The dense cluster core region expands by a factor of ten while most of the stars in the sparse cluster outskirts become unbound. A consequence of this cluster expansion is that the multitude of stellar encounters in the core regions of embedded clusters significantly shapes the disc properties of the remnant bound population, whereas the stars joining the field population are to a much lesser degree affected by encounters.
The expansion process strongly influences the observed disc fractions since it mimics a
non-existent decrease with cluster age. Stars that are dispersed in the field most likely
maintain their discs for a substantially prolonged time span and are, thus, more suitable
for forming planetary systems.
1 Introduction 1
1.1 Isolated star formation . . . . 2
1.2 Structure of circumstellar discs . . . . 4
1.3 Dissolution of the circumstellar discs . . . . 6
1.4 Interactions with the stellar environment . . . . 10
1.4.1 The Orion Nebula Cluster . . . . 12
1.4.2 Dynamical cluster evolution . . . . 13
1.4.3 Mass segregation . . . . 16
1.5 Dominant cluster mode . . . . 17
1.5.1 Embedded cluster phase . . . . 20
1.5.2 Gas expulsion phase . . . . 22
2 Methods 29 2.1 Numerics . . . . 29
2.1.1 Cluster dynamics . . . . 30
2.2 Modification of nbody6 . . . . 37
2.2.1 Identification of encounter events . . . . 37
2.2.2 Instantaneous gas expulsion . . . . 39
2.3 Cluster setup . . . . 40
2.4 Diagnostic aspects . . . . 46
3 Disc-mass distribution in star-disc encounters 49 3.1 Setup and method . . . . 49
3.2 Results . . . . 52
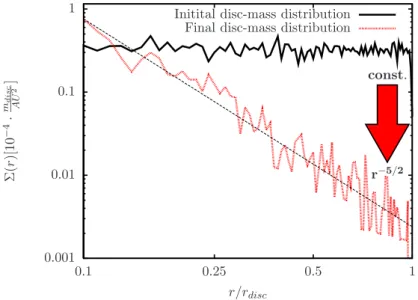
3.2.1 Surface density distribution . . . . 53
3.2.2 Relative mass loss . . . . 56
3.2.3 Relative angular momentum loss . . . . 58
3.2.4 Adapting a fit formula dependent on the initial disc-mass distribution 60 3.2.5 Definition of disc-perturbing encounter . . . . 61
3.3 Conclusion . . . . 63
4 Embedded clusters in virial equilibrium 67
4.1 Setup . . . . 68
4.1.1 Density scaling . . . . 70
4.2 General cluster dynamics . . . . 71
4.3 Encounter dynamics . . . . 73
4.4 Effect of the initial disc-mass distribution . . . . 75
4.4.1 Dependence on stellar density . . . . 75
4.4.2 Dependence on stellar mass . . . . 79
4.5 Discussion . . . . 83
4.6 Summary . . . . 85
5 Cluster expansion phase 87 5.1 Setup and method . . . . 88
5.2 Cluster survivability . . . . 91
5.3 General cluster dynamics . . . . 92
5.4 Importance of encounters . . . . 96
5.4.1 Dependence on stellar mass . . . . 99
5.4.2 Evidence for disc destruction . . . 100
5.4.3 Dependence on distance to cluster center . . . 101
5.5 Discussion . . . 103
5.6 Summary . . . 104
6 Conclusion 107
7 Summary 111
A Analytical investigations of star formation efficiencies 113
B Numerics of individual star-disc encounters 117
C Stellar number density profiles 123
D Gas expulsion models 127
Bibliography 131
In accordance with currently accepted star formation scenarios, observations show that most, if not all, stars are initially surrounded by a circumstellar disc. There is increasing observational evidence that with time these discs become depleted of gas and dust and eventually disappear. A variety of physical mechanisms have been found to contribute to this evolutionary process, one of them gravitational star-disc interactions. In contrast to previous investigations of such stellar encounters (Clarke & Pringle, 1993; Hall et al., 1996;
Boffin et al., 1998; Pfalzner, 2004; Olczak et al., 2006) this study involves the treatment of arbitrary disc-mass distributions for the circumstellar discs. Due to the implementation of a flexible numerical scheme this is realized without the need for explicit simulations of the entire parameter space.
The importance of stellar encounters is induced by the fact that most young stars do not form in isolation but as part of a cluster environment. In general only a minor fraction of the Giant Molecular Cloud Complexes is converted into stars, which results in a proto- stellar cluster population that is initially surrounded by its natal gas. The residual gas is expelled by stellar winds, UV radiation and early supernova explosions of the massive stars within remarkably short timescales. Due to the gas expulsion the binding energy of the cluster is significantly reduced and the cluster starts to expand. On average, 90% of the clusters are completely dispersed into the field after about 10 Myr, only a small fraction remains bound as a stellar cluster (Lada & Lada, 2003). Even though this expansion plays an important role in the cluster evolution, the effect of stellar encounters under the prede- termined conditions of an expanding cluster environment has not been treated so far. In the second part of the thesis, the importance of stellar encounters in such varying cluster environments will be investigated for different initial disc-mass distributions.
After about 10 Myr an average of 90% of clusters are completely dispersed into the field while only a small fraction remains bound as a stellar cluster (Lada & Lada, 2003). However, the effect of stellar encounters under the predetermined conditions of an expanding cluster environment has not been treated so far. The focus in the second part of the thesis is on the gravitational interactions of stellar members in such varying cluster environments.
Moreover, an evolutionary sequence for the density-radius relation of the most massive
clusters in the Solar neighbourhood (M
cluster> 10
3M
⊙) has been recently established by
Pfalzner (2009). The gas-embedded stellar populations expand rapidly during and after the gas is expelled ending up as sparse (leaky) OB associations after > 20 Myr. Here, for the first time the influence of such expanding cluster environments on stellar encounters will be presented. Various gas expulsion models have been configured that account for the different evolutionary phases of the stellar populations.
The aim of this work is to obtain an insight in the relevance of stellar encounters in authentic cluster environments.
1.1 Isolated star formation
The formation process of a single star is relatively well understood. The generally accepted picture begins with the collapse of a cold molecular cloud and ends when the star has stopped accreting its circumstellar material, entering the so-called zero-age main sequence (ZAMS). This period is very short compared to the entire lifetime of a star, given by
lifetime ≈ 10
4m
starM
⊙ −2.5Myr. (1.1)
where the m
staris the stellar mass given in M
⊙.
The youth of stars was suggested by their concentration near associations of high-mass stars. These have to be necessarily young (Ambartsumian, 1954), because due to their high masses and consequently high gravitational pressure the hydrogen burning will only last for a few Myrs. So the presence of high-mass stars demonstrates that star formation is an ongoing process in our Galaxy.
In Figure 1.1 a sketch of the star formation process including timescales and size relations is shown. Observations have found that giant molecular clouds (GMCs) with masses of 10
2− 10
6M
⊙, temperatures of 10 − 20 K and sizes of 10 − 100 pc (Larson, 2003) are potential sites of star formation. They are concentrated in the spiral arms of galaxies, surrounded by less dense envelopes of atomic gas. Molecular clouds with a mean density of
≈ 100 H
2molecules per cm
3(Blitz, 1993), entail atomic hydrogen to preferentially associate into molecular hydrogen H
2( ∼ 90%), but there are also some other molecular structures found like CO
2. The abundance of molecules is strongly dependent on their formation rate on the surface of dust grains and thus increases with density. The formation of a star from a molecular cloud requires the resisting forces of turbulent motion, thermal gas pressure and magnetic fields to be smaller than the gravitational forces. Thus in particular the cold and dense molecular cloud regions are potential seeds for the star formation processes (Fig. 1.1a).
Such molecular clouds are typically of very low density, which means that they have to
contract by a factor of several magnitudes to form a star. This enormous reduction in
size means that any small initial rotation of the star-forming cloud results in large angular velocities due to angular momentum conservation, eventually causing the formation of a planetary disc. In summary, molecular clouds are transient structures that form, evolve and disperse very quickly, all in a time comparable to ∼ 10 Myr (Hartmann, 2003; Elmegreen, 2000).
Figure 1.1:The process of star formation. Taken from Greene (2001).
The gravitational instabilities of the molecular cloud are a prerequisite for the formation of so-called protostars. The mass necessary to obtain such gravitationally unstable density fluctuations is the Jeans mass:
M
J= 5.57c
3r ρ
G
3(1.2)
with the isothermal sound speed c and uniform density ρ. The Jeans instability leads to the formation of a core that starts to accrete material from the surrounding envelope (Fig. 1.1b).
The accompanying release of kinetic energy heats the medium so that temperature and pressure at the center of the protostar increase. As its temperature approaches thousands of degrees, the protostar becomes visible as an infrared source.
During the initial collapse, the clump is transparent to its own radiation and the collapse
proceeds rather quickly. With increasing density the clump becomes opaque, restraining
the energy loss by infrared radiation. As a result, temperature and pressure in its center
will start to ascend. At some point, the pressure stops the infall of gas onto the core and
the object becomes temporarily stable as a protostar (Fig. 1.1c). The protostar has initially about 1% of the final stellar mass and continues growing by accreting material from the envelope via its protostellar disc.
One consequence of the collapse is that these evolved young stars, in case of m
1≤ 2 M
⊙known as T Tauri stars, are usually surrounded by massive, opaque circumstellar discs (Fig. 1.1d). Although the envelope disappears quickly - for a solar mass star the protostellar phase lasts about 100 000 yrs - disc material can still be accreted onto the stellar surface.
As a by-product of the star formation process planets might form from the debris cir- cumstellar disc. Such pre-main sequence (PMS, Fig. 1.1e) stars radiate energy both from the heated disc mainly in the infrared and from the accretion of material onto the stellar surface at optical and ultraviolet wavelengths. A fraction of the material accreted onto the star is ejected perpendicular to the disk plane in a highly collimated stellar jet. A PMS star can lose up to 50% of its mass before reaching the main sequence.
This occurs typically after a few million years when thermonuclear fusion begins in the core and a strong stellar wind is produced which stops the infall of new mass. Since the circumstellar disc eventually dissipates, there must be other mechanisms to remove angular momentum from the disc. For example the formation of planets (Fig. 1.1f), binary or multiple systems or interactions with the stellar environment (Larson, 2009) are possible explanations.
1.2 Structure of circumstellar discs
There is increasing observational evidence that most, if not all, stars are initially surrounded by a circumstellar disc consisting of gas and dust. In the past decades such discs have been detected from optical, infrared and millimeter photometry of young stars. Measurements of long-wavelength bands showed an excess of emission above that expected from the stellar photosphere. This excess was interpreted as radiation emitted by a disc-like structure, which is heated via reprocessing of the central star’s light and accretion luminosity.
The most efficient way to observe stellar discs is examining the L-band excess (Haisch et al., 2001b), which refers to the near infrared. For example, Lada et al. (2000) found with this method a fraction of 80 − 85% of all stars in the Trapezium cluster to be surrounded by discs. Here, the observed wavelength regime is of major importance since it restricts the observations to a certain part (temperature) within the disc.
Figure 1.2 illustrates the wavelength regions for the spectral energy distribution (SED) of
a flaring protoplanetary disc. The model indicates a near-infrared bump due to the inner
rim of the disc, infrared dust features from the warm surface layer, and the underlying
continuum emission from the deeper (cooler) disc regions. Typically the near- and mid-
domain Disk
Star
Energetic domain
Rayleigh−Jeans Wien domain
Figure 1.2:Build-up of the SED of a flaring protoplanetary disc (rdisc= 100 AU). Scattering is not included here (Dullemondet al., 2007).
infrared emission originate from small radii, while the far-infrared comes from the outer disc regions. The (sub-)millimeter radiation is mostly emitted from the mid-plane of the outer disc. Most observations are performed with the Spitzer Space Telescope and limited to < 10 AU from the central star while a few discs in the Orion Nebula Cluster have been resolved beyond 50 AU in the optical with the Hubble Space Telescope. Recently, the ground-based Atacama Large Millimeter Array (ALMA) program started, which will focus on millimeter and sub-millimeter wavelengths and, thus, the more distant regions of circumstellar discs. In fact, a much lower disc fraction is found on scales of > 50 AU compared to observations within distances of less than a few AU to the central star (e.g.
Clarke, 2007).
Disc-mass distribution
To date, observational limitations have prevented a determination of the typical surface
density of protoplanetary discs and its temporal development. This means a unique pre-
determined initial state for the disc-mass distribution is not well known. A wide variety of
surface densities have been derived by fitting resolved millimeter continuum or line emission
data with parametric disc structure models (e.g. Mundy et al., 1996; Lay et al., 1997) or
in combination with broadband spectral energy distributions (SEDs) (Wilner et al., 2000;
Testi et al., 2001; Akeson et al., 2002; Kitamura et al., 2002; Andrews & Williams, 2007b).
While those studies have profoundly shaped our knowledge of disc structures, all have fundamentally been limited by the low angular resolution of available data.
The standard fitting method is based on the assumption that the surface density Σ has a simple power-law dependence of the form
Σ(r) ∝ r
−p, (1.3)
out to some cut-off radius (e.g. Andrews & Williams, 2007a). Estimates based on numerical power-law models fitted to observational data lead to distribution indices p ranging roughly from p = 0 to p = 2. Recent studies have found even unexpected results, e.g. Isella et al.
(2009) who measured distribution indices of p < 0.
Many theoretical studies use a crude approximation of the primordial solar disc (the Minimum Mass Solar Nebula, or MMSN) as a reference point, which is constructed by augmenting the current planet masses to match solar abundances, and then smearing those masses into concentric annuli. The result is fitted with a radial power law, Σ ∝ r
−1.5(Weidenschilling, 1977). Recently, Chiang & Laughlin (2012) determined a similar result for the Minimum Mass Extrasolar Nebula (MMEN) constructed from the Kepler catalog of extrasolar planets. They find a slightly steeper surface-density distribution, Σ ∝ r
−1.6.
Analytical approaches also propose different disc-mass distribution indices. The most widely used model is that of a steady-state viscous accretion disc with a surface density distribution index of p = 1 (e.g. Hartmann et al., 1998). However, simulations of the evolution of protostellar discs that form self-consistently from the collapse of a molecular cloud core yield a surface distribution index of p = 1.5 (Lin & Pringle, 1990; Hueso &
Guillot, 2005; Vorobyov & Basu, 2007), while studies that include magnetised disc material have found a flatter disc-mass distribution of p = 0.75 (Shu et al., 2007).
Despite the large range of existing distribution parameters upcoming observational re- sults from ALMA will potentially provide further insights on the disc structures.
1.3 Dissolution of the circumstellar discs
With time, the protoplanetary discs surrounding new born stars become depleted of gas
and dust and eventually disappear (Haisch et al., 2001b; Hillenbrand, 2002; Sicilia-Aguilar
et al., 2006; Hern´andez et al., 2007; Currie et al., 2008; Hern´andez et al., 2008; Mamajek,
2009; Massi et al., 2010). The remnant circumstellar material will either be accreted onto its
central star, dispersed into the interstellar medium, or aggregated to large protoplanetary
bodies. In Figure 1.3 the disc fraction in stellar clusters, which are conglomerations of
thousands of stars, are shown as a function of the mean cluster age. The cluster disc
fraction (CDF) is a fundamental quantity, which is defined by the number of disc-less stars divided by the total number of stars and is often used as a global tracer of a clusters dynamical state. In general, observations indicate a strong decrease of the cluster disc fraction with increasing cluster age. Most of the discs are completely dissolved after about 6 Myr.
Figure 1.3:Cluster disc fraction as a function of the cluster age. The solid line shows an exponential fit. The Figure and data references are taken from Mamajek (2009).
The cluster disc fraction is not only a function of the cluster age but depends likewise on the stellar mass of the disc-surrounded star, the binary fraction, and the cluster density.
Uniform observations of these effects are rather challenging, due to the large distances of even the nearest star forming regions (> 100 pc Wilking et al., 2008) and drastic obser- vational limitations. In most cases the clusters are still embedded in their natal gas and, therefore, observations are restricted to long wavelength selections and sub-samples of the brighter high-mass stars, which are preferentially located in the central cluster regions.
Despite these limitations, it was found that disc lifetimes decrease for higher stellar
masses (Hillenbrand et al., 1992; Lada et al., 2000; Stolte et al., 2004; Carpenter et al.,
2006; Lada et al., 2006; Kennedy & Kenyon, 2009) with dispersion timescales of only a few
10
5yr for pre-main sequence stars of 2 − 8 M
⊙- so-called Herbig Ae/Be stars (Alonso-Albi
et al., 2009). Kennedy & Kenyon (2009) analysed stellar disc fractions in nine young clusters
by observing the infrared excess, a tracer for circumstellar discs heated by the central star,
Disc fraction for stellar mass range
0.6 - 1.5 M
sun Disc fraction for stellar mass range1 .5 - 7. 0 M
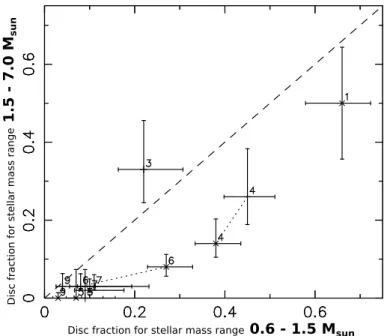
sunFigure 1.4:Shown are the disc fractions according to accretion signatures (×) and infrared excess (+) for two stellar mass bins. The dashed line indicates an equal disc fraction for the mass bins. The data results from observations of (1) Taurus, (3) IC348, (4) Tr37, (5) NGC2362, (6) OB1bc, (7) UpperSco, and (9) NGC7160 are presented. The Figure has been adapted from Kennedy & Kenyon (2009).
and the equivalent widths of Hα emission, which is a signature for accretion. Figure 1.4 shows their results by comparing the disc fraction of sun-like stars (0.6 − 1.5 M
⊙) to the disc fraction of stars > 1.5 M
⊙, using an equivalent number of stars for each mass bin. It can be seen that circumstellar discs around sun-like stars seem to survive longer than discs around high-mass stars. For lower masses they find no significant deviations. However, in other cases the disc fraction seems to decline towards very low stellar masses (Lada et al., 2004, 2006; Oliveira et al., 2006), which is mostly interpreted as sun-like stars providing the most favorable conditions for planet formation. Note that due to the large error ranges for disc fractions of low-mass stars these results have to be treated with caution.
Another significant influence on the cluster disc fraction is provided by binary or multiple stellar systems. Bouwman et al. (2006) found much shorter lifetimes of circumstellar discs around stars that are part of a binary system than those for single stars. According to their investigation the mean disc dissipation time for binaries is found to be about 5 Myr while discs around single stars survive roughly 9 Myr. Furthermore, Cieza et al. (2009) distinguished between tight and loose binary systems. They observed twice as much discs around binary systems with separations of 40 − 400 AU compared to the number of discs around hard binaries with separations < 40 AU.
Furthermore, observations reveal that the cluster disc fraction depends strongly on the
cluster density. Luhman et al. (2008) compare the disc fraction of the sparse cluster Chamaeleon I to the one of the denser stellar population of IC 348, both with cluster ages of about 2.5 Myr. For masses > 1 M
⊙they found significantly less dissolved discs in Chamaeleon I. Hence, they concluded a decreasing disc lifetime for high-density star forming regions.
0 20 40 60 80 100
0 2 4 6 8 10 12 14
cl u st er d isc fr ac ti on
time[Myr]
CrA Taurus
TW Hya IC 348
Arches NGC 3603 NGC 6618
NGC 2024
NGC 2264
NGC 2362 Trapezium
ηCHA σ Ori
CHA E
Starburst cluster Sparse associations Haisch et al. (2001)
MBM12
R 136 / 30 Dor
Figure 1.5:Shown is the cluster disc fraction as a function of the cluster age in Myr. The values for the starburst clusters (red) are taken from Stolteet al.(2010) (and references therein) while the sparse associations (blue) are taken from Fanget al.(2013) (and references therein). The remaining data points are taken from the sequence found by Haisch et al.(2001b) (and references therein). In most of the previous cases minor or even no errors have been specified for the cluster ages and disc fractions. Taking into account additional observations by several authors (Casey et al., 1998; Webbet al., 1999; Weintraub et al., 2000; Sung & Bessell, 2004; Nisiniet al., 2005; Meyer & Wilking, 2009; Currie & Sicilia-Aguilar, 2011; Kudryavtsevaet al., 2012) the error bar estimates have been improved and now reflect an increased parameter range.
This would also suggest a spatial dependence of observational results. Stolte et al.
(2010) surveyed the cluster disc fraction of B-type stars in the Arches cluster, one of the
densest stellar populations in the Milky Way (ρ
core> 10
5M
⊙pc
−3) containing > 100 O-
type stars (Figer et al., 2002). They found a strong dependence of the disc fraction on
the radial distance from the dense cluster center with an increasing excess fraction for
larger radii. Similar results have been obtained for the starburst cluster NGC 3603 where
the disc fraction increases with radius from 20% (r < 0.6 pc) to 40% (0.8 < r < 1 pc)
(Stolte et al., 2004). Similar results have been obtained for stellar populations in the Solar
neighbourhood, like the Orion Nebula Cluster (Hillenbrand et al., 1998).
In Figure 1.5 a combination of the established cluster disc fraction from Haisch et al.
(2001b), Stolte et al. (2010) for massive compact starburst clusters, and the recently pub- lished results from Fang et al. (2013) representing sparse associations are shown as a func- tion of the cluster age. Error estimates have been considerably improved by seeking for additional observational age and disc fraction data in the literature (see caption of Fig. 1.5).
Apart from the generally expected decline of the cluster disc fraction with time, a signif- icant difference in the slope emerges for the plotted density groups. The red data points represent the scope of the starburst clusters in which the circumstellar discs disperse very quickly (< 4 Myr). Stolte et al. (2010) interpreted these findings as a result of the high masses of the stars in their sample. Note, that the disc fraction of the inner core of 30 Doradus has not been resolved, which implies that the shown disc fraction might be an upper limit. While the data by Haisch et al. (2001b) is dominated by low-mass stars, star- burst cluster observations are mostly limited to OB-type stars, due to their high densities and large distances. Fang et al. (2013) presented a study of sparse stellar associations covering various stellar mass ranges. As shown in Figure 1.5 by the blue crosses the cluster disc fractions of these stellar populations decrease much slower than the previous. After 6 Myr it is unclear if the discs will completely disappear or if a fraction of around 20% will maintain. Regardless of the stellar mass a dependence of the cluster disc fraction on the cluster density can be identified. While in dense clusters the discs disappear within a few Myr, circumstellar discs in sparse associations might survive for at least 10 Myr.
1.4 Interactions with the stellar environment
It is currently unclear which physical mechanism dominates the evolutionary disc destruc- tion processes. Among the great variety of effects are internal processes such as viscous torques (e.g. Shu et al., 1987), turbulent effects (Klahr & Bodenheimer, 2003), and magnetic fields (Balbus & Hawley, 2002), but as well external disc destruction processes like photo- evaporation (Scally & Clarke, 2001; Clarke et al., 2001; Matsuyama et al., 2003; Johnstone et al., 2004; Alexander et al., 2005, 2006; Ercolano et al., 2008; Drake et al., 2009; Gorti
& Hollenbach, 2009) and tidal interactions (Heller, 1993; Clarke & Pringle, 1993; Ostriker, 1994; Heller, 1995; Hall et al., 1996; Hall, 1997; Larwood, 1997; Boffin et al., 1998; Pfalzner, 2004; Pfalzner et al., 2005a; Moeckel & Bally, 2006; Kley et al., 2008).
Since it is long known that stars form not only in isolation but in stellar populations, like the Orion Nebula Cluster (ONC), star cluster regions became of major importance for studying disc destruction via external processes. Here, investigations seem to indicate that photoevaporation should by far dominate the disc destruction (Scally & Clarke, 2001;
Balog et al., 2008). During this process the perturbation of protoplanetary discs results
from the UV radiation from massive stars. Hereby, the radiation interacts with the disc matter and thus accelerates preferentially light disc elements outwards. Another significant destruction mechanism, although often discarded as probably unimportant, is the influence on circumstellar discs by stellar encounters, which has already been suggested in the 90s by e.g. Clarke & Pringle (1993); Hall et al. (1996); Boffin et al. (1998). At that time first numerical simulations of selected stellar fly-by scenarios were performed, which already yielded substantial effects on the shape of the circumstellar discs.
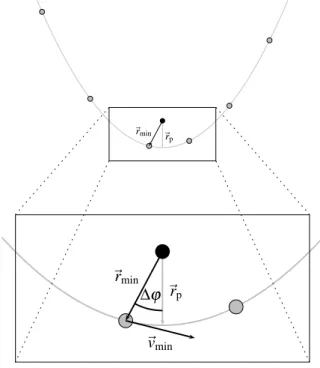
The focus of the present numerical investigation will be on the effect of such gravitational star-disc interactions on the disc-mass distribution and, therefore, the mass and angular momentum of the discs. A star-disc encounter
∗can cause matter to become unbound, be captured by the perturbing star or pushed inwards and potentially be accreted by the central star. The extent to which this happens depends on the periastron distance, the mass ratio of the stars, the eccentricity and, moreover, the initial (pre-encounter) mass distribution in the disc.
Star-disc encounters with focus on the mass and angular momentum losses due to gravi- tational interactions in ONC-like cluster models have been reviewed in many investigations prior to this study (Pfalzner, 2004; Olczak et al., 2006; Pfalzner & Olczak, 2007). In par- ticular, Olczak et al. (2006) found that star-disc interactions influencing the circumstellar discs are more frequent in the inner core of the ONC than previously assumed (Scally &
Clarke, 2001). Moreover, the massive stars act as gravitational focii which results in a rapid destruction of their discs due to multiple perturbations by lighter stars (Olczak et al., 2006;
Pfalzner et al., 2006).
However, most previous numerical studies of star-disc encounters have used only a single density distribution, mainly focusing on the case of a theoretically motivated r
−1disc-mass distribution (Hall et al., 1996; Hall, 1997; Pfalzner, 2004; Olczak et al., 2006; Moeckel &
Bally, 2006; Pfalzner & Olczak, 2007). Star-disc encounters with different initial disc-mass distributions have only been considered in a very limited way. Heller (1995) performed numerical simulations of two different mass distributions (p = 0 and p = 1.5) concentrating on parabolic encounters with equal mass stars, while Hall (1997) investigated initial surface distributions of p = 0 and p = 1 for close and penetrating encounters of unity mass ratio.
A study of a wide parameter range focusing on multiple initial disc-mass distributions still needs to be performed.
Nevertheless, numerical studies of star-disc encounters only allow a sectional view of the processes since it is impossible to simulate each combination of encounter parameters.
Earlier analytical studies by Ostriker (1994) did not suffer from this shortcoming. In
∗Here, the term ’star-disc encounter’ describes encounters in which only one of the stars is surrounded by a disc, in contrast to disc-disc encounters, in which both stars are surrounded by discs.
her study, a first order approximation of the angular momentum loss dependent on the initial disc-mass distribution is given. However, the validity of her results is limited to large periastron radii (for example r
peri/r
disc> 3 for M
2/M
1= 1), where the angular momentum loss is usually well below 10 %. Close or even penetrating encounters cannot be interpreted by this linear perturbation theory (Ostriker, 1994; Pfalzner et al., 2005b) making numerical studies indispensable in this regime.
Taking the huge variety of observed and theoretical motivated disc-mass distributions into account (Section 1.3), one has to consider different initial disc-mass distributions to evaluate their effect in star-disc encounters. In this work, the effects of star-disc encounters are investigated for a large parameter space considering most configurations that can be expected in a typical young cluster. The investigated mass distributions cover the entire range of the so far observed disc-mass distributions.
1.4.1 The Orion Nebula Cluster
Trapezium Cluster • Orion Nebula WFPC2 •Hubble Space Telescope• NICMOS
NASA and K. Luhman (Harvard-Smithsonian Center for Astrophysics) • STScI-PRC00-19
Visible • WFPC2 Infrared • NICMOS
Figure 1.6:Two views of the Trapezium cluster in the Orion Nebula from the Hubble Space Telescope. The image on the left, an optical spectrum image taken with Hubble’s WFPC2 camera, shows a few stars shrouded in glowing gas and dust. On the right, an image taken with Hubble’s NICMOS infrared camera penetrates the haze to reveal a swarm of stars as well as brown dwarfs. The figure is taken from Luhman & O’Dell (2000).
The Orion Nebula Cluster (ONC) has been chosen as one model cluster for our simula-
tions since it is the nearest massive young star cluster and one of the best observed young
dense star forming regions. In Figure 1.6 it can be seen that large parts of the cluster are
covered by the remnant gas, which prevents extensive observations in the visible regime.
However, in the infrared band the star-forming region, which consists of about 4000 stars with masses above the hydrogen-burning limit of 0.08 M
⊙in a volume of 2.5 pc (Hillen- brand & Hartmann, 1998; Hillenbrand & Carpenter, 2000) and half-mass radius r
hm≈ 1 pc, can be resolved. It is located south of Orion’s Belt, along our spiral arm of the Milky Way, at a distance of 414 ± 7 pc to our Sun (Sandstrom et al., 2007; Menten et al., 2007) and is part of the Orion Molecular Cloud Complex. The mean age of the cluster has been estimated to be about 1 − 2 Myr (Hillenbrand & Hartmann, 1998; Palla & Stahler, 1999).
Most of the stars have already been formed and the residual gas has been ejected to the outer parts.
Besides most of its objects being T Tauri stars, there is also strong evidence for the occurrence of protostars embedded in a dusty envelope, which indicates that the star for- mation process is still ongoing. The inner region of the ONC emerges as a very bright and dense part of the cluster, called the Trapezium, which already expelled most of its gas. It is this cluster region where most of the massive stars are located. The most mas- sive (m
system≈ 50 M
⊙) and also brightest (2.5 · 10
5L
⊙) stellar system in this region is the binary θ
1C Ori, which is one out of four leading high-mass objects that ionize the whole nebula by their intense ultraviolet radiation. The strong radiation of these stars also shapes the Orion proplyds, protoplanetary discs that are surrounded by tear-drop shaped ioniza- tion fronts (O’dell et al., 1993). Finally, the high densities in these inner cluster region (ρ
0.053 pc= 4.7 · 10
4pc
−3, McCaughrean & Stauffer, 1994) suggest that stellar encounters might be relevant for the evolution of circumstellar discs within the Trapezium region.
1.4.2 Dynamical cluster evolution
The dynamical evolution of the stellar population is largely determined by gravitational interactions of the stellar members. Hereby, a fundamental quantity describing the global dynamical state of the cluster is the virial ratio
Q = T
| W | = r
virσ
2GM
tot, (1.4)
where T is the total kinetic energy, W the total potential energy of the cluster, σ is the statistical dispersion of the velocities (so-called velocity dispersion), G is the gravitational constant, M
totis the total cluster mass, and r
viris the virial radius. For an equal-mass system r
viris defined by the average distance between the particles:
1 r
vir=
1
| r
i− r
j|
i6=j
. (1.5)
In general, the magnitude of the virial ratio specifies whether a cluster is contracting (Q < 0.5), expanding (Q > 0.5) or in virial equilibrium (Q = 0.5). This classification can be inferred from the virial theorem, which yields for any stable spherical system consisting of N self-gravitating particles
2T + W = 0. (1.6)
While individual deflections of the stellar trajectories are unpredictable in such chaotic N-body systems the overall dynamics of the stellar cluster can be specified by a set of time scales that are introduced in the following.
Crossing time
The crossing time, t
cross, is given by (Heggie & Hut, 2003; Binney & Tremaine, 2008) t
cross= 2r
virσ = 2 √
2 r
vir1.5√ GM
tot(1.7)
where σ ≈ p
GM
tot/2r
virand the virial radius r
viris given by the potential energy W as r
vir= GM
tot/2 | W | . The crossing time estimates the typical time scale a star needs to cross the cluster and, thus, describes the amount of mixing of the stellar population. In general, a non-equilibrium dynamical system adjusts back to equilibrium within a few t
cross. For massive clusters consisting of 30 000 stars and a radius of R = 6 pc typical crossing times of t
cross≈ 0.3 Myr are obtained. If the cluster age is less than t
crossthe population is close to its initial state.
Relaxation time
The path of a star is perturbed by several weak deflections of neighbouring stars. A time that quantifies after which time span these deflections become significant and the star forgets about its initial path is given by the two-body relaxation time (Spitzer, 1987)
t
relax= 0.1 N
ln N t
cross, (1.8)
where N is the number of stars. It expresses the time after which the changes of the
direction of motion of the stars become comparable to the initial velocity dispersion. Con-
sequently, within t
relaxthe dynamical cluster state changes significantly and evolves to a
globally relaxed system. Note that for the usual case of N > 35 we obtain t
relax> t
crossso
that the cluster might be mixed and close to dynamical equilibrium but is not relaxed. In
other words, for high particle numbers the cluster dynamics are less influenced by encoun-
ters due to the deeper cluster potential.
The relaxation time within a cluster varies significantly between the innermost and out- ermost parts. Therefore, it is useful to define a half-mass relaxation time (Spitzer, 1987;
Binney & Tremaine, 2008)
t
rh= 0.14N ln(γN)
s r
hm3GM
tot, (1.9)
where r
hmis the half-mass radius, containing the innermost half of the total cluster mass, and γN the argument of the Coulomb logarithm (Spitzer & Hart, 1971) with γ = 0.11 for equal-mass particles (Giersz & Heggie, 1994) and < 0.11 otherwise (Giersz & Heggie, 1996). While the dynamics of old globular clusters with typical ages of t
age≈ 10
10yr and relaxation time scales of t
relax≈ 10
8yr are significantly influenced by stellar interactions, young clusters like the ONC with relaxation time scales t
relax= 1.5 · 10
7yr > t
age= 10
6Myr (adapted from Hillenbrand & Hartmann, 1998) can be approximated as collision- less systems with their dynamics being determined by a smoothed gravitational potential.
However, although the global dynamics are rather unaffected by stellar interactions the circumstellar discs properties can be significantly altered by stellar fly-bys.
Ejection and evaporation time
Stars are able to escape from a bound stellar population if their total binding energy E
tot= W + T ≥ 0. This translates into the minimum stellar velocity needed to escape the cluster potential, so-called escape velocity, given by
v
esc(r, t) = p
2 | φ(r, t) | . (1.10)
The potential φ(r, t) splits into a part given by the total enclosed mass within r, M
tot(r, t), and a potential contributed by the surrounding material
φ(r, t) = − G
M
tot(r, t)
r + 4π
Z
∞ rρ(r
′, t)r
′dr
′. (1.11)
The second term is obtained by integrating over each radial mass shell at r
′> r.
There are two different types of stellar collisions that force a star to leave the cluster:
(i) Ejections, which require a strong, single encounter event increasing the velocity of one of the stars to an amount larger than the escape velocity and (ii) Evaporation caused by several weak interactions that gradually increase the kinetic energy of a star to finally become unbound from the cluster.
The ejection time scale of the cluster can be approximated by t
ejec= − N dt/dN ≈ 10
4t
rh(Henon, 1969) while numerical simulations (Spitzer, 1987) suggest an evaporation time
scale of the order of t
evap≈ 330t
rh.
Collision time
The collision time, t
coll, defines the time scale for an actual physical contact between two stars, with collision radius r
coll= 2r
star. The collision rate, 1/t
coll, is obtained by a simple integration of the number of encounters per unit time over all stellar velocities, which results in (Binney & Tremaine, 2008)
1 t
coll=
16 √
πnσr
coll21 + GM
12σ
2r
coll −1(1.12) where n is the stellar density, M
1the mass of the central star, and σ the velocity dispersion.
Here, the second term represents the effect of gravitational focusing, which leads to a reduction of the collision time. For simplicity all stars are assumed to have the same single mass, which strongly underestimates the effect of gravitational focusing.
For typical quantities like a mean stellar mass of < M
1>= 0.5, velocity dispersion of σ = 1km/s, r
coll= 2R
⊙, and central densities of n = 5 × 10
3pc
−3as found for the ONC we obtain an collision time scale of the order 10
11yr. Hence, stellar collisions are rather unlikely for stellar densities investigated in this study.
However, for a gravitational interaction between the circumstellar disc and the encounter- ing star much larger radii r
coll≫ 2R
⊙can be assumed. Gutermuth et al. (2005) estimated in their study the collision time scales in dependence of the cluster density. Assuming two collision radii, r
coll= 10
3AU for protostellar envelopes (Motte & Andr´e, 2001) and r
coll= 10
2AU for classical T Tauri discs (McCaughrean & O’dell, 1996), they find typical encounter time scales of the order 10
5yr and 10
7yr, respectively, for stellar densities of 10
4stars per pc
−3.
1.4.3 Mass segregation
Observations showed that stellar clusters, sometimes only a few Myr old, are typically mass segregated, e.g. the most massive stars of the only 1 Myr old ONC are located within the inner r
core= 0.3 pc of the cluster (Hillenbrand & Hartmann, 1998). Not only dynamical evolved clusters like the starburst cluster Arches (Harfst et al., 2010) are found to be mass segregated but also still embedded clusters show this trend like the ONC, NGC 6231 (Raboud & Mermilliod, 1998) or NGC 1893 (Sharma et al., 2007). There is a strong debate if the observed mass segregation can be a product of dynamical two-body relaxation of the cluster or if only primordial mass segregation is capable to explain segregation processes on such short timescales. A better understanding of the dynamical mechanisms is needed to further constrain these concepts.
In case of primordial mass segregation massive stars form preferentially at the cluster
center. This process is explained by an increased amount of accretion material as well
as an accelerated accretion of the surrounding gas due to the location of the stars at the bottom of the potential well. Bonnell & Davies (1998) investigate the evolutionary effect of dynamical mass segregation and conclude that the position of massive stars in young clusters generally reflects the cluster’s initial conditions due to the young cluster age relative to their relaxation time (see also Hillenbrand & Hartmann (1998)). Therefore, previous numerical studies assumed an initial mass segregation of the ONC locating the most massive star in the cluster center and the three next massive stars randomly within r = 0.6 · r
hm(Bonnell & Davies, 1998) so that it fits today’s observations of the ONC.
Another explanation might be a dynamical mass segregation. The wide range of observed stellar masses (typical 0.08 − 150 M
⊙which will be further detailed in Sec. 2.3) implies that their initial kinetic energy depends not only on the stellar position in the cluster but also strongly on the individual stellar masses, with largest kinetic energies for the most massive stars. Stellar interactions lead to an equipartition of the kinetic energy by massive stars transferring kinetic energy to the low-mass stars. As a consequence the massive stars sink towards the cluster center.
Typically, the time scales for dynamical mass segregation are larger than the cluster relaxation time t
equ> t
relax. However, recent numerical investigations found that cool clusters dynamical mass segregate on timescales far shorter than expected (Allison et al., 2009; Olczak et al., 2011). Also dynamical friction from the molecular gas can effectively reduce the time scale of the dynamical mass segregation (Er et al., 2009). Moeckel &
Bonnell (2009) show, that for system ages less than a few crossing times star formation scenarios predicting general primordial mass segregation are even inconsistent with ob- served segregation levels for some young embedded clusters. Furthermore, Ascenso et al.
(2009) argue that there is currently no observational evidence of mass segregation in young clusters since there is no robust way to differentiate between true mass segregation and sample-incompleteness effects.
1.5 Dominant cluster mode
Although the star formation process itself seems comparatively well understood (see Sec. 1.1) there is currently a serious discussion about the environment within which the majority of stars form. A main problem is the absence of a general definition of a stellar cluster.
Moreover, the question arises whether most stars form in the few massive clusters, the large number of small-N clusters or in hierarchically structured environments with arbitrary lo- cal surface densities. In the latter case massive clusters would only represent an exception.
The two main formation models will be briefly explained in the following.
Two sequences of clustered star formation
It is generally believed that most stars, if not all, do not form in isolation but as part of a group of stars consisting between just a few to up to ten-thousands of stars (e.g. Lada &
Lada, 2003; Porras et al., 2003; Fall et al., 2005; Evans et al., 2009). However, today only a low fraction of stars in the solar neighbourhood is found in clusters. A comparison of the number of young clusters (< 10 Myr) to the number of evolved clusters indicates that the majority of clusters dissolves quickly after their formation (e.g. Fall et al., 2005; Pfalzner, 2009). Lada & Lada (2003) determine that 90% of the observed embedded clusters within 2 kpc of the Sun have to disperse within 10 Myr after their formation and about 96% after 100 Myr. They called this rapid cluster disruption and the accompanied lack of evolved open clusters infant mortality.
The dissolution of young stellar clusters is explained by the expulsion of their residual gas caused by stellar winds, UV radiation, and the first supernova explosions. Due to a significant reduction of the total cluster mass a high number of stars might become unbound. This process was studied by several authors (Hills, 1980; Lada et al., 1984;
Adams, 2000; Geyer & Burkert, 2001; Boily & Kroupa, 2003a,b; Goodwin & Bastian, 2006;
Bastian & Goodwin, 2006; Baumgardt & Kroupa, 2007; Parmentier & Pfalzner, 2012;
Pfalzner & Kaczmarek, 2013) and will be detailed in Section 1.5.2.
1 10
Cluster radius [pc]
0.01 1 100 10000 1e+06
Cluster density [M
sunpc
-3]
15000 Msunpc-3/R4 5000 Msunpc-3/R3
> 10 Myr 4Myr < age < 10Myr
< 4Myr
Galactic center cluster RSGC2
RSGC1
I Lac Upper Cen Lup Lower Cen Crux Ori Ia chi Per
h Per
U Sco Ori Ic Westerlund 1
Quintuplet
Ori Ib
NGC 7380 IC 1805 NGC 2244
NGC 6611 Cyg OB2 Arches
NGC 3606
Westerlund 2
DBS2003 Trumpler
STAR BURST CLUSTERS
LEAKY CLUSTERS
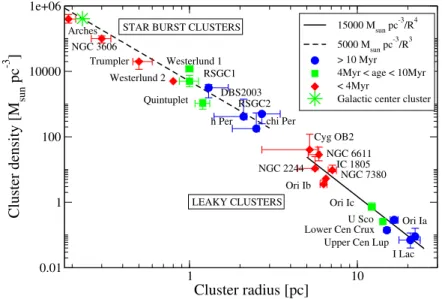
Figure 1.7:Cluster density as a function of the cluster size for clusters more massive than 103M⊙. The Figure is taken from Pfalzner (2009) while the observational data points are taken from Wolffet al.(2007), Figer (2008), Borissovaet al.(2008), and references therein.
While Lada & Lada (2003) concentrated on the temporal evolution of embedded clusters, recent investigations by Pfalzner (2009) found evidence for a bimodal evolution process of stellar clusters more massive than 10
3M
⊙in the radius-density plane. Figure 1.7 shows the sequential radius-density-age relation revealing two distinct groups of clusters. Clusters in the first sequence are termed starburst clusters and consist of several ten-thousand stars in a rather small volume of only a few 0.1 pc half-mass radius. Within 20 Myr of development their total masses of ≈ 20 000 M
⊙remain fairly constant while their sizes increase significantly to about 1 − 3 pc. Pfalzner & Kaczmarek (2013) determined star formation efficiencies of up to 70% as an explanation for the minor dissolution of the cluster and comparatively low velocity dispersions of the stellar members (Rochau et al., 2010; Bastian, 2011; H´enault-Brunet et al., 2012).
Stars within the dense environments of such starburst clusters are very prone to stellar encounters. Olczak et al. (2012) investigated stellar encounters in the Arches starburst cluster and determined that more than 30% of all stellar discs are completely destroyed by gravitational interactions within the first 2.5 Myr. However, well-observed starburst clusters in the Milky Way are very rare because they are mostly located in the dense spiral arms or close to the Galactic Center where observations are limited by the high background density. In the present study the focus is on massive clusters in the solar neighbourhood and starburst clusters will not be considered.
Massive nearby star forming regions, which are subject of the present study, evolve along the second sequence in the density-radius plane, the so-called leaky cluster sequence.
These clusters have initial total masses similar to the starburst clusters but are distributed in a much larger area with a radius of about 6 pc. Within 20 Myrs the size of leaky clusters increases significantly up to ≈ 20 pc while they additionally lose large amounts of their total mass. Pfalzner & Kaczmarek (2013) found a star formation efficiency of < 30% of such clusters and concluded that the expulsion of the residual gas is a major process for cluster members to become unbound.
Hierarchical cluster formation
In contrast to the observed modes of a clustered formation the size and surface density of a
star forming region in the theoretical context of a hierarchical cluster formation process are
believed to be continuously distributed throughout the hosting galaxies (Elmegreen et al.,
2006; Bastian et al., 2007). In this picture one might argue that the embedded clusters
observed by Lada & Lada (2003) are simply a selection effect and an observational bias
leads to a neglect of the stars residing in the lower local density regimes. Another approach
is that already during the formation process bound stellar systems are naturally formed in
the observed density peaks of the interstellar medium, while lower density clusters instantly
dissolve. Hereby, a minor fraction of ≈ 30 − 35% of all stars is estimated to be born in such bound entities (Kruijssen, 2012). By contrast Lada & Lada (2003) observed that 90% of stars are expelled from a cluster after the gas expulsion process and only about 10% might remain bound.
The probably most popular study about this subject was published by Bressert et al.
(2010) who investigated local surface densities in the solar neighbourhood (< 500 pc dis- tance) and found a smoothed log-normally shape of the stellar distributions. They favour a continuous star formation process over clustered modes of star formation due to a lack of multiple peaks in the observed local surface density distribution of star forming regions.
However, recent studies found that their results might be caused by a superposition ef- fect of multiple modes of star formation (Pfalzner et al., 2012; Gieles et al., 2012) so that a smooth surface density distribution can not be used as a criterion for hierarchical star formation. Moreover, starburst clusters or the dense inner Trapezium region of the ONC have been excluded in Bressert et al. (2010) giving no further qualification of the Pfalzner (2009) cluster sequences.
The discussion if most stars form in clusters leads to the question: What is a cluster?
While Lada & Lada (2003) estimated 90% of all stars to form in clusters due to their cluster definition of a local surface density threshold of 3 stars per pc
2Bressert et al. (2010) came up with a density limit of 200 stars per pc
2leading to only 26% of all stars forming in clusters. The Bressert et al. (2010) limit is based on the estimated density for encounters to become important in a clustered environment (Gutermuth et al., 2005). However, such arguments are irrelevant for our study since we focus on the actual cluster densities and find high variations of the local surface densities between the maximum and the observed local surface density, which is basically used to define a stellar population as a cluster. A detailed description will be given in Section 4.3. Additionally, here, the low density regions observed by Bressert et al. (2010) are of minor importance since stellar interactions might be rare in their present density conditions.
1.5.1 Embedded cluster phase
For the first 10
5to 10
6yr of the star formation process the newly formed protostars are surrounded by their natal gas. Such evolutionary very young clusters are called embedded clusters. Due to gas extinction the formed young stars are mostly not visible in the optical regime. Only longer wavelength emissions like near infrared (NIR) radiation are able to pass obstacles in form of dust and gas providing first insights in T Tauri star characteristics.
Still, little constrains can be made on stellar quantities due to the optical thick cloud structure.
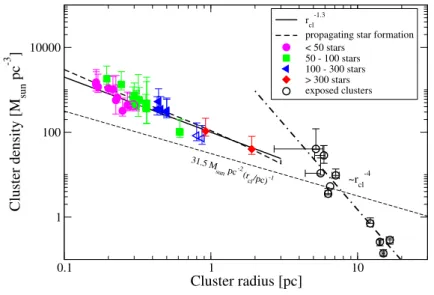
So far it is unclear if the formation of stars in such embedded clusters starts in the dense
0.1 1 10
Cluster radius [pc]
1 100 10000
Cluster density [M
sunpc
-3]
rcl-1.3
propagating star formation
< 50 stars 50 - 100 stars 100 - 300 stars
> 300 stars exposed clusters
~rcl-4
~r
cl-3~r
cl -1
31.5M
sunpc-2 (rcl/pc)-1
Figure 1.8:Cluster density as a function of cluster radius for embedded clusters with more than 200 observed members (coloured symbols) and the leaky cluster sequence found by Pfalzner (2009) for clusters more massive than 103M⊙(black open circles). The thin dashed line indicates the observational limit defined by Carpenteret al.(2000). The original figure is taken from Pfalzner (2011).