Policy Research Working Paper 7032
Infrastructure Gap in South Asia
Infrastructure Needs, Prioritization, and Financing
Luis Andrés Dan Biller Matías Herrera Dappe
South Asia Region
Sustainable Development Department September 2014
WPS7032
Public Disclosure Authorized Public Disclosure Authorized Public Disclosure Authorized Public Disclosure Authorized
Produced by the Research Support Team
Abstract
The Policy Research Working Paper Series disseminates the findings of work in progress to encourage the exchange of ideas about development issues. An objective of the series is to get the findings out quickly, even if the presentations are less than fully polished. The papers carry the names of the authors and should be cited accordingly. The findings, interpretations, and conclusions expressed in this paper are entirely those of the authors. They do not necessarily represent the views of the International Bank for Reconstruction and Development/World Bank and its affiliated organizations, or those of the Executive Directors of the World Bank or the governments they represent.
Policy Research Working Paper 7032
This paper is a product of the Sustainable Development Department, South Asia Region. It is part of a larger effort by the World Bank to provide open access to its research and make a contribution to development policy discussions around the world. Policy Research Working Papers are also posted on the Web at http://econ.worldbank.org. The authors may be contacted at landres@worldbank.org, dbiller@worldbank.org, and mdappe@worldbank.org.
If the South Asia region hopes to meet its development goals and not risk slowing down or even halting growth, poverty alleviation, and shared prosperity, it is essential to make closing its huge infrastructure gap a priority. Identify- ing and addressing gaps in the data on expenditure, access, and quality are crucial to ensuring that governments make efficient, practical, and effective infrastructure develop- ment choices. This study addresses this knowledge gap by focusing on the current status of infrastructure sectors and geographical disparities, real levels of investment and pri- vate sector participation, deficits and proper targets for the future, and bottlenecks to expansion. The findings show that the South Asia region needs to invest between US$1.7 trillion and US$2.5 trillion (at current prices) to close its
infrastructure gap. If investments are spread evenly over
the years until 2020, the region needs to invest between
6.6 and 9.9 percent of 2010 gross domestic product per
year, an estimated increase of up to 3 percentage points
from the 6.9 percent of gross domestic product invested
in infrastructure by countries in the region in 2009. Given
the enormous size of the region’s infrastructure deficien-
cies, it will need a mix of investment in infrastructure
stock and supportive reforms to close its infrastructure
gap. One major challenge will be prioritizing investment
needs. Another will be choosing optimal forms of ser-
vice provision, including the private sector’s role, and the
decentralization of administrative functions and powers.
Infrastructure Gap in South Asia:
Infrastructure Needs, Prioritization, and Financing 1
Luis Andrés, Dan Biller, and Matías Herrera Dappe
Keywords: Infrastructure needs, Prioritization, Financing, South Asia.
JEL Classication: D6, O1, O18, O53, R10
1The South Asia Infrastructure Needs Regional Study is the product of a team effort of the Economics Team in the Sustainable Development Department and the Chief Economist Office in the South Asia Region of the World Bank. The team would like to thank Jorge J. Escurra, Atsushi Iimi, Fernanda Ruiz-Núñez, and Stefanie Sieber for preparing the sectoral models, as well as Diana Cubas, Céline Ferré, and Ada Karina Izaguirre for contributing to the background papers. The team would also like to acknowledge the support from Gonzalo Vázquez Baré, Cecilia Belita, Neetu Mihal, Diana Moreira, and Shaheena Nisar. Finally, the team would also like to thank Edgar C. Bouharb for his Information Technology support. The team also thanks Ashma Basnyat, Juan Echenique, Matías Herrera Dappe, Rahul Kanakia, Mario Picon, Govinda Timilsina, and Laura Wallace for directly contributing to the final product. The team is grateful for the ongoing support and technical inputs from the South Asia Regional Chief Economist, Martin Rama and the former regional Chief Economist, Kalpana Kochhar. The team also greatly appreciates the guidance from Jack Stein, Gajan Pathmanathan, Jyoti Shukla, the South Asia Sustainable Development Department management team, and Country Management Units in the SAR region. The team appreciates the feedback and inputs of the South Asia regional team. In particular, the team would like to acknowledge Sudeshna Banerjee, Kirsten Hommann, Johannes G. P. Jansen, Pravin Karki, Bill Kingdom, John Newman, Pradeep Mitra, Mohua Mukherjee, Elisa Muzzini, Sheoli Pargal, Rabin Shrestha, and Tomoyuki Yamashita, for their valuable inputs during the preparation of this report. In addition, Marianne Fay (SDN, Chief Economist), Vivien Foster (SEGEN, Sector Manager), and José L. Guasch (Consultant) have all provided insightful and constructive comments through their capacities as peer reviewers. Financial support from SAR Chief Economist Office and the Australian Government is gratefully acknowledged.
1. Introduction
Despite recent rapid growth and poverty reduction, the South Asia region (SAR) continues to suffer from a combination of uneven economic growth, a population boom, slow urbanization, and huge infrastructure gaps that together could jeopardize future progress. SAR has the largest population below the poverty line of any region. Between 1990 and 2010, the number of people living on less than
$1.25 a day decreased by only 18 percent,
2while the population grew by 42 percent. At the same time, structural change has been slow, with urbanization (around 31 percent) lower than in any other developing region, despite economic growth rates that have exceeded most other regions over the past two decades. In effect, departing from similar points, South Asian countries are remarkably “under- urbanized” when compared to East Asian countries over the past half century (income and urban population as percentage of total population). The result of these trends has been a dramatic rise in demands for infrastructure—but access to infrastructure services is generally below other developing regions, the only exception being Sub-Saharan Africa. Yet, as urbanization continues, it is creating growing demand for infrastructure services that are already severely stretched. According to the United Nations, five South Asian cities (Mumbai, Delhi, Kolkata, Karachi, and Dhaka) are expected to surpass the 15 million-person mark by 2015. Furthermore, according to the livability index produced by the Economist Intelligence Unit, four South Asian cities (Dhaka, Karachi, Kathmandu, and Colombo) are in the bottom 10 cities of the 140 countries evaluated.
SAR needs to invest between US$ 1.7 trillion and US$ 2.5 trillion (at current prices) to close its infrastructure gap. Many people living in the SAR remain unconnected to a reliable electrical grid, a safe water supply, sanitary sewerage disposal, and adequate roads and transportation networks.
Meanwhile, both the number of poor and the poverty rate are expected to increase in some of the more vulnerable and low-growth economies of the region. This region requires significant infrastructure investment (roads, rails, power, water supply, sanitation, and telecommunications) not only to ensure basic service delivery and enhance the quality of life of its growing population but also to avoid a possible binding constraint on economic growth owing to the substantial infrastructure gap. A mix of investment in infrastructure stock and the implementation of supportive reforms will allow SAR to close its infrastructure gap. A preliminary estimation of the cost of doing so by 2020 gives a lower bound of US$ 1.7 trillion and an upper bound of US$ 2.5 trillion at current prices. If investments are spread evenly over the years until 2020, SAR needs to invest between 6.6 and 9.9 percent of 2010 gross domestic product (GDP) per year. These estimates represent an increase of up to 3 percentage points from the 6.9 percent of GDP invested in infrastructure by SAR countries in 2009.
But faced with this enormous demand for infrastructure investment and only limited available financial resources, it is critical for SAR to prioritize infrastructure investment needs. The criteria used to accomplish this must be able to answers questions about short-term needs versus longer-term development needs, especially in developing countries. For example, should infrastructure investment in the electricity sector be given priority over the transport sector? Given substantial lock-ins associated with infrastructure investments, should a country continue attempting to fill current gaps or direct investments to infrastructures that are likely large bottlenecks in the medium term? How does one
2 The proportion of people living on less than $1.25 a day decreased from 54 percent to 31 percent (a 42 percent decrease), between 1990 and 2010, mainly due to the increase in population.
2
account for the social and environmental issues of these trade-offs related to the directly impacted population?
Moreover, it is not feasible to expect South Asian governments alone to shoulder the entire financial burden. This means that SAR cannot continue on a business-as-usual trajectory. Rather, it should seize this opportunity to rethink and improve the infrastructure service provision paradigm currently in place.
Two important elements of the service provision paradigm are (i) the service provision approach, which refers to the organizational form that defines and structures the roles of the public and private sectors;
and (ii) the degree of decentralization in the provision of services.
There are many possible approaches for service provision – such as traditional (or public) provision, public-private partnerships (PPPs), and privatization (regulated or deregulated). Different organizational forms offer different incentive structures to internalize the efficiency gains from life-cycle cost reductions and to tackle the trade-off between life-cycle efficiency and quality considerations. At a conceptual level, economic characteristics (e.g., returns to scale, feasibility to charge user fees, quality contractibility), and planning and coordination aspects of a specific infrastructure service determine the best incentive structure to deal with this trade-off. However, once political economy realities are considered, the optimal organizational form might change.
The nexus between service provision and decentralization is diverse and complex. For example, connective infrastructure (such as interstate transport and telecommunication) may have a higher direct impact on economic growth by facilitating agglomerations, making it a good fit for central service provision/regulation. However, water and sanitation provision may have a higher impact on welfare—at least in the short term in countries where economic sectors are not highly dependent on water as an input—making it a good fit for local service provision/regulation. At a conceptual level, the economic dimension of individual infrastructure services, technologies available for service delivery, and political economy realities guide this nexus. For instance, the economic dimension of an infrastructure sub- sector in terms of service delivery could fall into five broad categories: economies of scale; network effects; cross jurisdiction externalities; market failures (e.g., public bads, club goods); and allocative efficiency. These categories may hint at the jurisdiction that should provide this service and thus where the gap should be addressed. However, available technologies may result in a diverse response to addressing service provision, and political realities may add an extra layer of complexity. Ultimately, pre- established formulas are difficult to come by, and policy makers are left primarily with guiding principles that will need to be adjusted to specific realities.
In this paper we identify and assess SAR’s infrastructure needs, and we analyze how to address them efficiently and effectively. The paper is organized as follows. We begin with how to assess infrastructure needs, then present a framework for this effort, and then compare the status of infrastructure in SAR with other regions, as well as among and within SAR countries. This is followed by infrastructure investment trends in SAR countries, our estimate of the total cost of regional infrastructure needs, and a proposed framework for assessing priorities. Finally, we examine ways to rethink infrastructure service provision and the degree of decentralization.
3Our conclusion is that infrastructure deficiencies in South Asia are enormous and a mix of investment in infrastructure stock and supportive reforms will enable the region to close its infrastructure gap. One
3Additional information on methodology, models, background papers, stock taking reviews, and data used can be found in the Infrastructure Needs Regional Study webpage: http://go.worldbank.org/URIGW1E4W0.
3
major challenge will be prioritizing investment needs. Another is choosing optimal forms of service provision – including the private sector’s role – and the decentralization of administrative functions and powers.
2. What is the ‘Infrastructure Gap’?
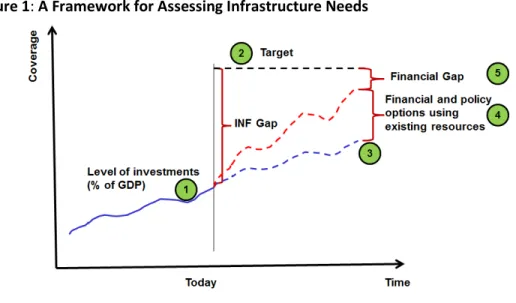
Over time, societies inherit man-made infrastructure stock from previous generations. Yet different factors influence demand and supply and, as countries grow, these needs – both the type of infrastructure and the quality of service provision – are likely to evolve. In this report, we assess the infrastructure gap using a four-step process, as illustrated in Figure 1. It shows (1) where a country is today; (2) where a country would like to be in a given point in time – the difference between the two points being the infrastructure gap; (3) how far business-as-usual scenarios (shown by the dotted blue line) will take the country toward reaching its goal; (4) how far financial and policy options using existing resources (shown by the dotted red line) could take the country toward reaching its goal; and (5) the remaining financial gap that will need to be bridged. Keep in mind that the importance of the financial gap will vary among countries, depending on how well better use existing resources can close the infrastructure gap.
First, evaluate a country’s level of infrastructure provision needs. This includes a diagnosis of coverage, quality, and efficiency of infrastructure services, and investments in infrastructure. It involves gathering existing data on access rates to the various infrastructure services; and, to the extent possible, appraising the quality of service provision. In its simplest form, the actual gap is the difference between targets (each one may be priced in a variety of ways) and baseline over a time period in which the gap is aimed to be filled.
Different sectors require different methodological approaches. One approach is costing set targets, which involves estimating physical needs as the difference between the baseline and targets. These targets may be defined as universal service access, the Millennium Development Goals (MDGs), or a goal determined by benchmarking—which compares normalized infrastructure performance indicators across countries or areas with similar characteristics (usually socio-economic variables), or predetermined standards defined as optimal. Another approach is costing sector needs, using micro- sectoral analysis to build estimates based on sector data and sector specialists’ views; for water and sanitation, estimates will be based on approximations of the cost of achieving coverage targets under the MDGs. Yet another approach is costing macroeconomic needs using macro-econometric models or micro-engineering economic models.
4For example, one could look at the infrastructure coverage needed to achieve a particular growth objective, assuming given levels of other inputs.
Second, assess long-term targets and goals for physical infrastructure. This component analyzes various sets of sector-specific targets and goals, and concludes with an estimation of investment needs.
Different sectors inevitably require diverse approaches in terms of methodology.
4 The relevant literature for costing macroeconomic needs includes: Fay and Yepes (2003); Estache and Yepes (2004);
Chatterton and Puerto (2005), and Calderón and Servén (2004).
4
Third, develop a menu of financial and policy options using existing resources. This component focuses on key policy options for improving service delivery (including access, quality, and affordability), enhancing the quality and adequacy of public investment in the sector (including performance-based contracting, and prioritization of investments), and encouraging private investment (including PPPs). It emphasizes trade-offs of individual policy recommendations.
Fourth, develop a menu of financial and policy options for bridging the financial gap. This component explores possible new sources of finance and how the investment burden can be shared between current and future users and/or society through various financing schemes. It also examines investment climate issues that affect the region’s ability to cost-effectively tap private resources. The reality is that even after improving service delivery, enhancing quality and adequacy of public investments, and encouraging private investments, it is likely that long-term targets and goals for physical infrastructure will remain out of reach. While any increase in investments has to be funded by direct users and/or society, there are options on how to apportion the burden—like higher public spending within a responsible macroeconomic framework, or higher user fees while remaining within accepted norms of affordability.
Figure 1: A Framework for Assessing Infrastructure Needs
3. Assessment of Coverage
The demand for infrastructure, whether from private or commercial users, is not static but evolves with country conditions. This is a notable feature of the relationship between infrastructure and economic growth. The relationship is not unidirectional as infrastructure investments create and perpetuate growth, which in turn changes the type of infrastructure demanded as society becomes more prosperous and the economic structure changes.
3.1 Regional Benchmarking
5
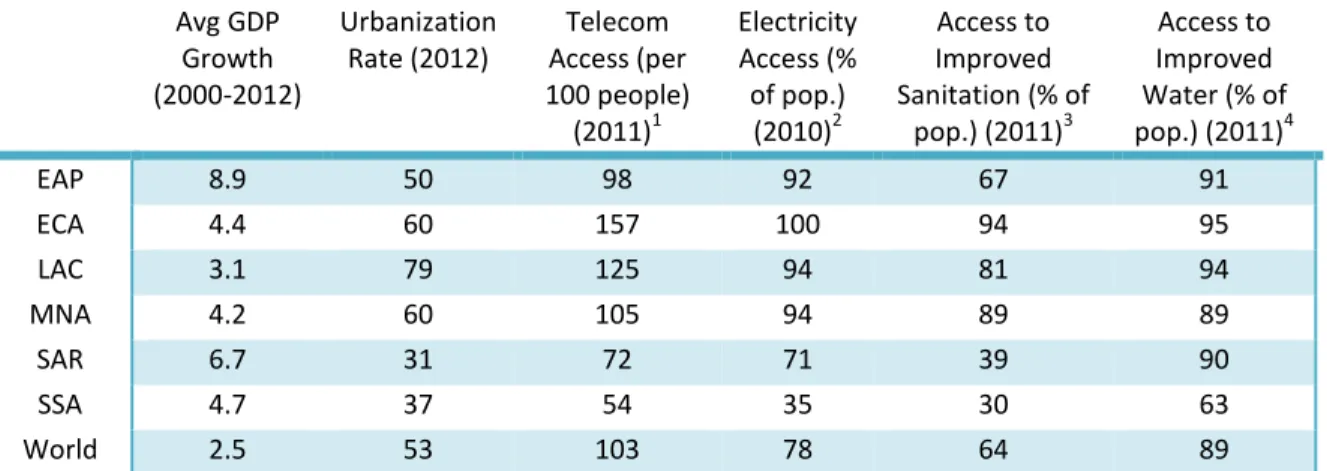
The demand for infrastructure has been growing globally, especially in Asia. Two decades ago, SAR and EAP had similar urbanization rates, 25 percent and 28 percent respectively, and were close in terms of infrastructure service provision. Since 1990 SAR has enjoyed the second highest economic growth in the world behind only EAP. During the 1990s growth in SAR averaged over 5 percent, while between 2000 and 2012, it averaged 6.7 percent. But while economic growth has been accompanied by rapid urbanization in EAP (50 percent urbanization rate in 2012), SAR remains the least urbanized region in the world (31 percent), well below the world urbanization rate (53 percent) (Table 1).
SAR has a large infrastructure gap compared with other regions. Its access to infrastructure services closely resembles SSA, even though its economic growth is second only to EAP (Table 1).
• Electricity access. In SAR only 71 percent of the population enjoys the benefits of electricity access, ahead of SSA at 35 percent, but way behind the rest of the regions at above 90 percent.
According to businesses in South Asia, infrastructure is a major or severe hindrance to their growth, and electricity is the largest problem.
• Improved sanitation access. In this category, SAR (39 percent) is at the bottom with SSA (30 percent) – rates that are close to half the world average of 64 percent population access. Open defecation seems to be one of the most salient issues facing SAR, with 680 million people (i.e., 41 percent of the population) relying on it in 2011.
5This ranks South Asia as the region with the highest incidence of open defecation in the world.
• Improved water access. This is the only indicator where South Asia is about even with the rest of the world and EAP, averaging 90 percent population access. Yet the quality and quantity of improved water may be in question. Most of the access to water is through public stands; only 25 percent of the population has access to piped water and 24/7 water supply is a rare exception in South Asian cities.
6• Telecom access. Communication among people who are not in close proximity is inefficient. In terms of telecom access (measured as fixed and mobile lines per 100 people), SAR and SSA rank at the bottom (72 and 54) with less than half the access found in ECA and LAC (157 and 125).This situation becomes even more dramatic given SAR’s low level of urbanization.
• Transport access. This other form of connectivity is also poor – a problem that troubles much of the developing world. Using total road network per 1,000 people, SAR has 2.9 km (Table 2)—
which is close to EAP (2.5 km), SSA (2.5 km), and MNA (2.8 km), but well below the world average (4.7 km), ECA (8 km), and North America (24 km).
7Furthermore, the transport infrastructure suffers from serious shortcomings (such as lack of intraregional connectivity between the national road networks, unrealized potential for rail and inland water freight transport, and inadequate road and rail connectivity of ports with hinterlands). These limitations turn transport infrastructure into a hindrance for regional and international trade, as investment climate surveys indicate.
5 WHO / UNICEF Joint Monitoring Program for water supply and sanitation: http://www.wssinfo.org/data-estimates/table/
6 Ibid.
7World Development Indicators.
6
Table 1: SAR Lagging Behind All but SSA in Access to Infrastructure Services Avg GDP
Growth (2000-2012)
Urbanization
Rate (2012) Telecom Access (per 100 people)
(2011)
1Electricity Access (%
of pop.) (2010)
2Access to Improved Sanitation (% of
pop.) (2011)
3Access to Improved Water (% of pop.) (2011)
4EAP 8.9 50 98 92 67 91
ECA 4.4 60 157 100 94 95
LAC 3.1 79 125 94 81 94
MNA 4.2 60 105 94 89 89
SAR 6.7 31 72 71 39 90
SSA 4.7 37 54 35 30 63
World 2.5 53 103 78 64 89
Source: World Development Indicators, except when noted otherwise.
Notes: 1. Telecom access is defined as the number of fixed and mobile lines; 2. World Energy Outlook 2010 by International Energy Association;
3. Improved sanitation is defined as connection to a public sewer, a septic system, pour-flush latrine, simple pit latrine, and ventilated improved pit latrine; 4. Improved water is defined as household connection, public standpipe, borehole, protected dug well, protected spring, rainwater collection.
3.2 Heterogeneity in Infrastructure Coverage among SAR Countries
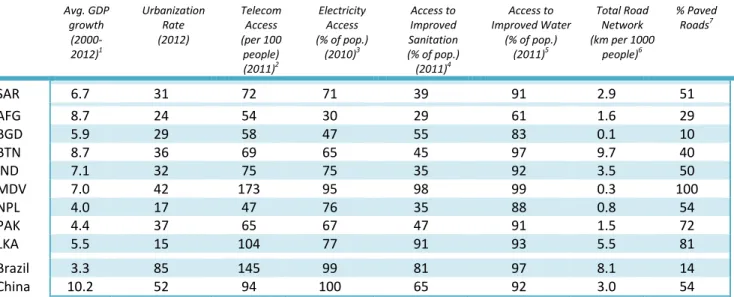
Sri Lanka and Maldives have the best access rates in the region. More than 90 percent of their population has access to improved sanitation, which is better than in LAC at 81 percent. In terms of electrification, only Maldives (95 percent) and Sri Lanka (77 percent) are above the average rate for developing countries (76 percent).
8,9On telecom, Sri Lanka and Maldives top the lists with 104 and 173 telephone lines per 100 people. This places Sri Lanka almost at the world average of 103 lines per 100 people and above EAP (98 lines per 100 people).
Afghanistan, Nepal, and Bangladesh have the worst access rates in the region. Nepal, with the lowest number of telephone lines per 100 people in SAR (47), is behind Afghanistan (54) – which matches SSA (54). For electrification, Afghanistan, not surprisingly, is the worst; a meager 30 percent of the population can rely on electricity powered lighting at night. Moreover, Afghanistan and Bangladesh (47 percent) are closer to the 35 percent found in SSA than to the 71 percent found in SAR. Total road network (km) per 1,000 people is also low in Nepal, Afghanistan, and Bangladesh—in Maldives it is also low, but it is explained by geographical reasons. And only 29 percent of Afghanistan’s roads, and 10 percent of Bangladesh’s roads, are paved.
The exception is high average access to improved water in SAR, and not just in a few countries. Five of the eight countries in SAR (i.e., Bhutan, India, Maldives, Pakistan and Sri Lanka) have access rates to improved water of at least 90 percent, similar to the 94 percent rate found in LAC.
8 It should be noted that data sources are kept the same for consistency purposes when comparing countries. The Ceylon Electricity Board (CEB) estimates for example that over 90 percent of Sri Lankan households were electrified in 2011.
9 World Energy Outlook, IEA:
http://www.worldenergyoutlook.org/resources/energydevelopment/globalstatusofmodernenergyaccess/
7
Table 2: Big Range among SAR Countries in Access to Infrastructure Services
Avg. GDP growth
(2000- 2012)1
Urbanization Rate (2012)
Telecom Access (per 100
people) (2011)2
Electricity Access (% of pop.)
(2010)3
Access to Improved Sanitation (% of pop.) (2011)4
Access to Improved Water
(% of pop.) (2011)5
Total Road Network (km per 1000
people)6
% Paved Roads7
SAR 6.7 31 72 71 39 91 2.9 51
AFG 8.7 24 54 30 29 61 1.6 29
BGD 5.9 29 58 47 55 83 0.1 10
BTN 8.7 36 69 65 45 97 9.7 40
IND 7.1 32 75 75 35 92 3.5 50
MDV 7.0 42 173 95 98 99 0.3 100
NPL 4.0 17 47 76 35 88 0.8 54
PAK 4.4 37 65 67 47 91 1.5 72
LKA 5.5 15 104 77 91 93 5.5 81
Brazil 3.3 85 145 99 81 97 8.1 14
China 10.2 52 94 100 65 92 3.0 54
Source: World Development Indicators, except when noted otherwise.
Notes: 1. The average GDP growth for AFG is for the period 2002-2009; 2. Telecom access is defined as the number of fixed and mobile lines; 3.
World Energy Outlook 2010 by International Energy Association, except BTN and MDV, which are based on authors’ estimations; 4. Improved sanitation is defined as connection to a public sewer, a septic system, pour-flush latrine, simple pit latrine, and ventilated improved pit latrine;
5. Improved water is defined as household connection, public standpipe, borehole, protected dug well, protected spring, rainwater collection;
6.Varying data years: 2005 (MDV), 2006 (Afghanistan), 2008 (IND, NPL), 2010 (BGD, BTN, PAK, LKA, Brazil, China); 7. Varying data years: 2003 (LKA), 2005 (MDV), 2006 (Afghanistan), 2008 (IND, NPL, China), 2010 (BGD, BTN, PAK, Brazil).
3.3 Heterogeneity in Infrastructure Coverage within Each SAR Country
There is significant heterogeneity within countries and between sectors. Using district level data from the entire SAR region, districts were ranked by quintiles on access to electricity, gas, improved water, improved sanitation and telecoms respectively.
10The heterogeneity on access to infrastructure services is not just among SAR countries but also among districts within the countries. For example, in India, some of the best performing districts on access to improved water sources are in the north and north west of the country, while some of the worst performing ones are in the north east and west as well as the southwest coast.
Within India, even bordering districts show big variations. An interesting example on access to improved sanitation is found on the north of India, where some of the worst performing districts in the country are in-between some of the best performing districts. In access to electricity, some of the districts in Gujarat, Haryana, Himachal Pradesh, and Punjab are among the best performing districts, while those in Bihar, Jharkhand, Orissa, and Uttar Pradesh are among the worst performing districts.
Furthermore, districts that perform well on access to one infrastructure service do not necessarily perform well on others. For example, districts in Kerala are high performers in access to improved sanitation but among the worst on access to improved water sources.
10 The fifth quintile on access to an infrastructure services represents the 20 percent of SAR districts with the highest access to that infrastructure service, while the first quintile represents the 20 percent of SAR districts with the lowest access to the same infrastructure service.
8
In India, there are districts in poor states that perform better than districts in rich states. The data show this contrast by highlighting bad districts in rich states and good districts in poor states. There are 10 districts ranked among the top 25 percent of districts on access to infrastructure services that are located in poor states (first quartile of GDP per capita). Similarly, there are 12 districts among the bottom 25 percent of the districts in terms of access that are in rich states (fourth quartile).
4. Investment Needs in South Asia
Consistent estimates of investment requirements across SAR are a pre-requisite for developing a sound menu of policy and financial options to close the infrastructure gap. Most governments in SAR have some estimates of the investments required to reach certain targets such as 24/7 electricity supply and the MDGs in water and sanitation. However, those estimates are not consistent across the region.
For that reason we have developed different methodologies for different sectors to have consistent estimates of physical investment needs and their costs across the region. These models also allow us to calculate and compare the costs of different set of targets. Each model was applied to one country, which gives five sector-country combinations: (i) power for Nepal; (ii) transport for Sri Lanka; (iii) water and sanitation for India; (iv) solid waste management for Sri Lanka; and (v) irrigation for Afghanistan.
11Having consistent estimates of investment requirements across the region gives us the much needed foundations to design a menu of policy and financial options to effectively and efficiently close the infrastructure gap in SAR.
12These country-sector estimations were extrapolated to the rest of the region. Tables 3 and 4 present the estimations based on the technical models as well as the extrapolations for the other sectors where the models were not run.
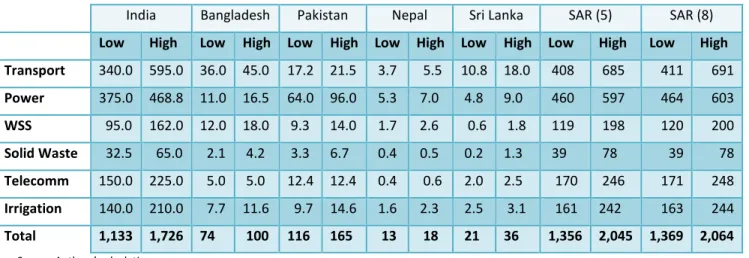
Table 3: SAR’s Total Investment Tab Could Reach Around $2 Trillion (Investment Requirements 2011-2020 (total, in Billions of dollars 2010)
India Bangladesh Pakistan Nepal Sri Lanka SAR (5) SAR (8)
Low High Low High Low High Low High Low High Low High Low High Transport
340.0 595.0 36.0 45.0 17.2 21.5 3.7 5.5 10.8 18.0 408 685 411 691
Power375.0 468.8 11.0 16.5 64.0 96.0 5.3 7.0 4.8 9.0 460 597 464 603
WSS95.0 162.0 12.0 18.0 9.3 14.0 1.7 2.6 0.6 1.8 119 198 120 200
Solid Waste32.5 65.0 2.1 4.2 3.3 6.7 0.4 0.5 0.2 1.3 39 78 39 78
Telecomm150.0 225.0 5.0 5.0 12.4 12.4 0.4 0.6 2.0 2.5 170 246 171 248
Irrigation140.0 210.0 7.7 11.6 9.7 14.6 1.6 2.3 2.5 3.1 161 242 163 244
Total 1,133 1,726 74 100 116 165 13 18 21 36 1,356 2,045 1,369 2,064Source: Authors’ calculations.
Note: Water Supply and Sanitation (WSS)
11 No other study estimating investment requirements in SAR or in other regions of the world (e.g., LAC and SSA) have developed a methodology to estimate investment requirements in the irrigation sector, as it was done for this study.
12 Additional information on these models can be found in the Infrastructure Needs Regional Study webpage:
http://go.worldbank.org/URIGW1E4W0
.
9
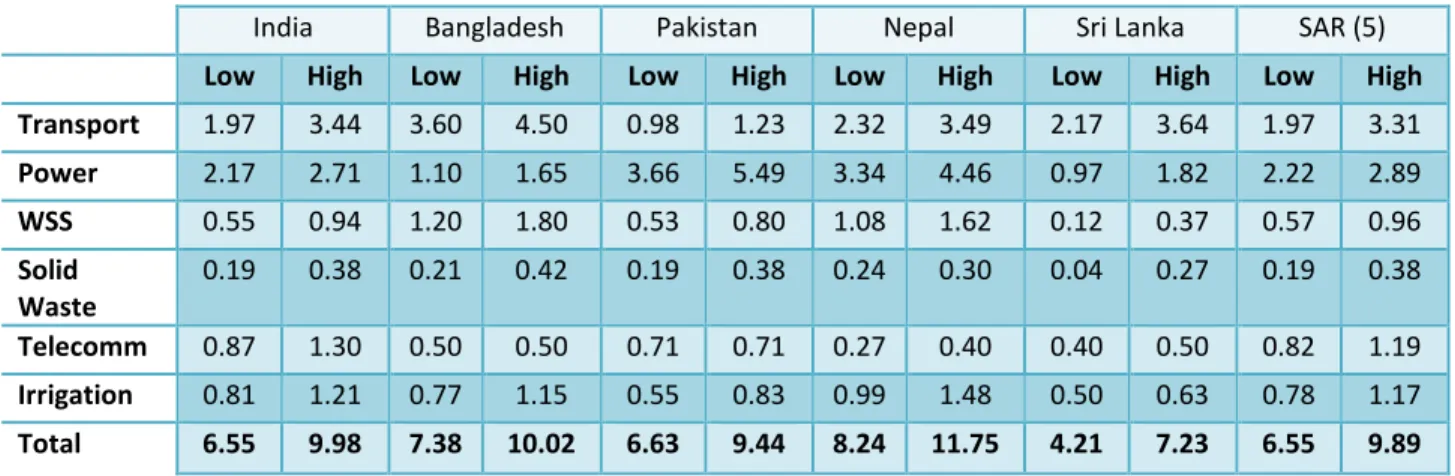
Table 4: Closing SAR’s Infrastructure Gap Will Require Investing a Higher Share of GDP Investment Requirements 2011-2020 (% of GDP, per year)
India Bangladesh Pakistan Nepal Sri Lanka SAR (5)
Low High Low High Low High Low High Low High Low High
Transport
1.97 3.44 3.60 4.50 0.98 1.23 2.32 3.49 2.17 3.64 1.97 3.31
Power2.17 2.71 1.10 1.65 3.66 5.49 3.34 4.46 0.97 1.82 2.22 2.89
WSS0.55 0.94 1.20 1.80 0.53 0.80 1.08 1.62 0.12 0.37 0.57 0.96
SolidWaste
0.19 0.38 0.21 0.42 0.19 0.38 0.24 0.30 0.04 0.27 0.19 0.38
Telecomm0.87 1.30 0.50 0.50 0.71 0.71 0.27 0.40 0.40 0.50 0.82 1.19
Irrigation0.81 1.21 0.77 1.15 0.55 0.83 0.99 1.48 0.50 0.63 0.78 1.17
Total 6.55 9.98 7.38 10.02 6.63 9.44 8.24 11.75 4.21 7.23 6.55 9.89 Source: Authors’ calculations.Note: Water Supply and Sanitation (WSS)
The bottom line is that South Asia region needs to invest US$ 1.7 trillion to US$ 2.5 trillion (in current prices) in infrastructure until 2020 – equivalent to US$ 1.4 trillion to US$ 2.1 trillion at 2010 prices (Table 3). Going forward, a mix of investing in infrastructure stock and implementing supportive reforms will allow SAR to close its infrastructure gap. In GDP terms, if investments are spread evenly over the years until 2020, SAR needs to invest between 6.6 and 9.9 percent of 2010 GDP per year – an increase of up to 3 percentage points compared with the 6.9 percent of GDP invested in infrastructure by SAR countries in 2009 (Table 4).
135. Infrastructure Investment Trends
What are the odds that SAR can put together enough funds to meet these investment targets? A look at past infrastructure investment trends should shed some light on this question.
5.1 Total Sector Investment
1413 These percentages are based on the investment requirements at 2010 prices.
14 While the main source of the data for this sub-section are multi-year development plans prepared by the National Planning
Commissions, annual reports from ministries, state banks, and other related government agencies have also been used in order to form as much as a complete picture as possible. The data used is a mixture of estimated and actual expenditure, as not all plans state actual expenditure from the previous plan or fiscal year. Furthermore, these plans do not distinguish between Capital and Operational Expenditures (CAPEX and OPEX). For public sector investment, South Asia is defined as: Bangladesh, Bhutan, India, Nepal, and Pakistan. Afghanistan, the Maldives and Sri Lanka are not included in this definition due to data limitations.
10
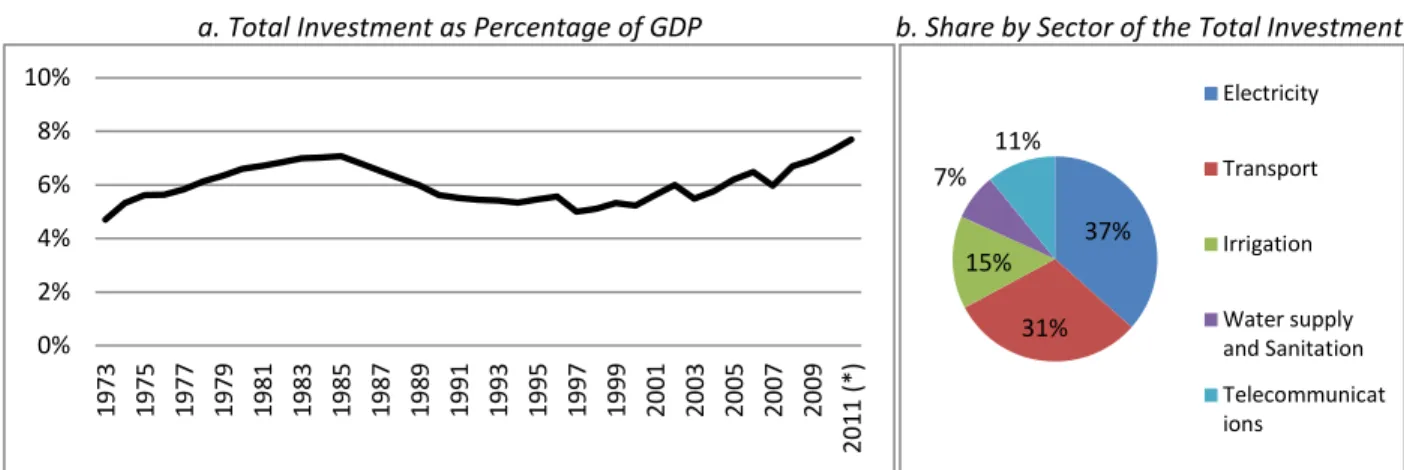
Total infrastructure investment in South Asia increased from 4.7 percent of GDP in 1973 to 6.9 percent in 2009, but fluctuated considerably around this trend. It rose from a low of 4.7 percent in 1973 to peak at 7.1 percent in 1985, before dropping down to only 5.0 percent in 1997 and then rising again to 6.9 percent in 2009 (Figure 2a). Nonetheless, despite these fluctuations, the total change in annual infrastructure in South Asia during 1973-2009 was sizeable, increasing by more than 47 percent.
The main driver of these fluctuations was the large infrastructure investment in electricity generation in the region during the 1980s. Infrastructure investment in the electricity sector on average constituted more than a third of the total portfolio (Figure 2b), but fluctuated considerably during the 1973-2009 period. Infrastructure investment in electricity was only 1.9 percent of GDP in 1973. It then increased dramatically to almost 3 percent GDP in the mid-1980s, as India, Pakistan, and Nepal invested heavily in the sector. Subsequently, investment dropped to merely 1.5 percent of GDP at the turn of the century before rising again to 2.4 percent in 2009.
In contrast, investment in transport, water supply and sanitation, and irrigation was much more stable. Infrastructure investment in transport remained stable throughout most of the period averaging 1.8 percent of GDP per year and 31 percent of total investment. After an initial upsurge from 1.3 percent in 1973 to about 2 percent in the 1980s, it largely fluctuated around this trend. Similarly, infrastructure investment in water supply and sanitation, as well as irrigation, remained fairly constant at the average of 0.9 percent and 0.1 percent of GDP respectively. However, the figures for irrigation mask a continual decline in the sector's contribution to total investment. In fact, the share of irrigation declined from 20 percent in the early 1970s to merely 13 percent in 2009.
Over the past four decades an increasing amount of resources were devoted to the emerging telecom sector, although its overall contribution remains small. In 1973, investment in this sector stood at only 0.3 percent of GDP, but rose to an impressive 1.1 percent in 2009. As a result, its share of total investment doubled, from 6 percent in 1973 to 16 percent in 2009.
Figure 2: Electricity is Driving the Rise in Infrastructure Investment
Investment in Infrastructure in South Asia, 1973-2011 (Percentage of GDP)a. Total Investment as Percentage of GDP b. Share by Sector of the Total Investment
Sources: Data has been collected from the public investment plans for each country. The Investments for the region were computed as a weighted average by GDP level across the countries in SAR.
Note: Missing data is linearly interpolated. Extrapolation is based on the average growth rate of the other countries, weighting by their share in regional GDP. Figures for 2010 and 2011 are estimate projections based on India’s public investment trends.
0%
2%
4%
6%
8%
10%
1973 1975 1977 1979 1981 1983 1985 1987 1989 1991 1993 1995 1997 1999 2001 2003 2005 2007 2009 2011 (*)
37%
31%
15%
7%
11%
Electricity Transport Irrigation
Water supply and Sanitation Telecommunicat ions
11
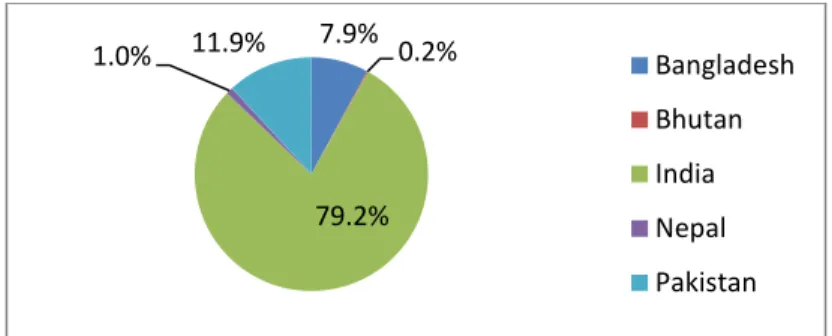
As expected, these overall patterns have been largely driven by India, which contributes the biggest share of total infrastructure investment in South Asia during the 1973-2009 period. In fact, infrastructure investment in India makes up on average 79 percent of total investment in the region (Figure 3). The second largest contributor – Pakistan – merely has an average share of 12 percent, and is followed by Bangladesh with 7.9 percent, Nepal with 1.0 percent, and Bhutan with 0.2 percent. These differences in the shares of total infrastructure investments in the region are roughly in line with the relative size of each economy. The average infrastructure investment as a percentage of GDP for the period 1973-2009 hovers around 6 percent for India, Pakistan, and Bangladesh, and 5 percent for Nepal.
Bhutan with infrastructure investments representing 14.6 percent of its GDP has given significantly higher importance to infrastructure development.
Figure 3: India Leads the SAR Pack in Infrastructure Investment (Share in Total Infrastructure Investment by Country, 1973-2009)
Sources: Data has been collected from the public investment plans for each country.
5.2 Private Sector Investment
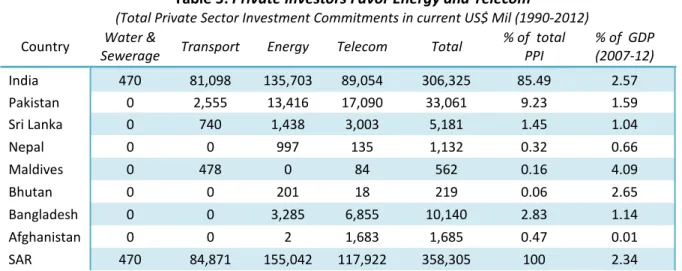
15,16India clearly has the largest presence in terms of private sector participation in infrastructure development at 85 percent of regional investment commitments. While India dominates each sub- sector, it is interesting to note: i) there is a large investment in energy compared to the other sub- sectors, and ii) India is the only country where the private sector has invested in water and sanitation (Table 5). Pakistan and Bangladesh rank second and third in terms of private sector investments, followed by Sri Lanka and Afghanistan (primarily telecom). Furthermore, India is the country that, after Bhutan and Maldives, has the highest proportion of investment commitments with respect to GDP.
The energy sector received the highest private sector investments not just in India but also in SAR.
From 1990-2012, the energy sector received US$155 billion in private investments. In 2012, 67 energy projects alone reached financial closure and a total of US$11.4 billion was invested – although this amounted to about half the investment in the previous year.
1715 The core source for private sector investment is the World Bank Private Participation in Infrastructure Database (for a detailed explanation on the PPI methodology, refer to: http://ppi.worldbank.org/resources/ppi_methodology.aspx). In this section, Private Participation in Infrastructure (PPI) investment consists of all eight countries in the region - Afghanistan, Bangladesh, Bhutan, India, the Maldives, Nepal, Pakistan and Sri Lanka.
16Irrigation is not included in the definition of infrastructure for this section. This is primarily because there is not enough data available but also because irrigation is primarily a public sector domain.
17 Source: http://ppi.worldbank.org/explore/ppi_exploreRegion.aspx?regionID=6
7.9% 0.2%
79.2%
1.0% 11.9% Bangladesh
Bhutan India Nepal Pakistan
12
Table 5: Private Investors Favor Energy and Telecom
(Total Private Sector Investment Commitments in current US$ Mil (1990-2012)
Country
Water &Sewerage Transport Energy Telecom Total % of total
PPI % of GDP (2007-12)
India 470 81,098 135,703 89,054 306,325 85.49 2.57
Pakistan 0 2,555 13,416 17,090 33,061 9.23 1.59
Sri Lanka 0 740 1,438 3,003 5,181 1.45 1.04
Nepal 0 0 997 135 1,132 0.32 0.66
Maldives 0 478 0 84 562 0.16 4.09
Bhutan 0 0 201 18 219 0.06 2.65
Bangladesh 0 0 3,285 6,855 10,140 2.83 1.14
Afghanistan 0 0 2 1,683 1,685 0.47 0.01
SAR 470 84,871 155,042 117,922 358,305 100 2.34
Source: World Bank Private Participation in Infrastructure Database.
Note: % of GDP was computed as a simple average across the specified period. Afghanistan % of GDP is from 2001-2011 due to a lack of data.
The telecom sector comes in second. From 1990-2012, telecom received US$118 billion in private investments. In 2012, service providers invested a total of US$4.7 billion. The transport sector comes in third with a total investment commitment of US$85 billion for 1990-2012. In 2012, it received US$20 billion in private investments.
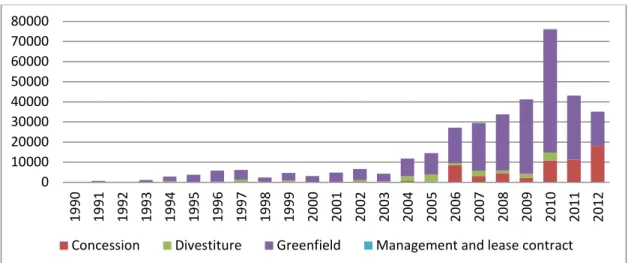
The greatest interest from the private sector is in greenfield investments. These investments have taken off since the mid-2000s, reaching about US$61 billion in 2010 before dropping off somewhat (Figure 4). For most South Asian countries these investments oscillate between energy and telecommunications projects. Concession projects have also drawn some private sector interest, almost all in transport. For the period 1990-2012, concessions account for 100 percent of transport investments in Maldives, 72 percent in India, and 32-33 percent in Sri Lanka and Pakistan. In addition, 4 out of India's 14 total water and sanitation projects are concessions.
13
Figure 4: Greenfield Investments Hold the Biggest Lure for the Private Sector in SAR (Investment in Projects (US$ mil)
Sources: World Bank Private Participation in Infrastructure Database
Notes: Concessions: When a private entity takes over the management of a SOE for a given period during which it also assumes significant investment risk. Divestiture: When a private entity acquires a stake in a SOE. When the private entities completely acquire a SOE it is considered to be a full divestiture. A partial divestiture is when the government transfers part of the equity of a SOE to private entities. This does not guarantee private management. Greenfield Projects: When a private entity or a public-private joint venture builds and operates a new facility for the period specified in the project contract. The facility may return to the public sector at the end of the concession period.
Management and lease contract: Under a management contract, government hires private entities to manage facilities while still bearing the operational risk. However under a lease contract, the government leases assets to private entities while the private operator bears the operational risk.
6. Prioritizing Infrastructure Investments in South Asia
The demand for infrastructure investment is enormous but the available financial resources are limited; therefore, prioritizing infrastructure investment needs is crucial. Criteria used to prioritize infrastructure investment needs play a major role in mitigating the infrastructure gap. A few existing studies attempted to address this question (see e.g., Berechman and Paaswell, 2005; Karydas and Gifun, 2006), but the methodological framework they developed is narrow and can be applied only to rank infrastructure investment projects. This section aims to develop a methodology that would be helpful in prioritizing infrastructure needs in developing countries, particularly in South Asia.
6.1 Methodological Framework for Prioritization of Infrastructure Projects/Portfolios
How to prioritize investment projects or portfolios is a common question a government at any jurisdictional level asks. This question is especially critical in developing countries, particularly in South Asia and Sub-Saharan Africa where demand for investment is huge and financial resources are limited.
Without an appropriate methodological framework to assess investment projects, it is difficult to allocate funding across various investment projects. The methodological framework consists of three main steps: (i) identifying factors that affect infrastructure investment decisions, (ii) quantifying identified factors, and (iii) ranking the infrastructure projects.
0 10000 20000 30000 40000 50000 60000 70000 80000
1990 1991 1992 1993 1994 1995 1996 1997 1998 1999 2000 2001 2002 2003 2004 2005 2006 2007 2008 2009 2010 2011 2012
Concession Divestiture Greenfield Management and lease contract
14
6.1.1 Identifying and Quantifying Factors Affecting Infrastructure Investment Decisions
A large number of factors could influence investment decisions. The list of specific factors might change depending upon the nature of infrastructure projects and country’s development plans and priorities. In general, these factors, which are captured by different methodologies, can be classified into four categories: (i) project level factors, (ii) economy-wide impacts, (iii) project related market failures, and (iv) rent capture.
Direct costs and benefits play an important role in determining infrastructure investment priorities. In fact, cost/benefit analysis (CBA) is the first step in any investment decision process. While problems of underestimation are not uncommon, assessing the costs of a given project is generally the simplest part of the CBA. Estimation of benefits in many infrastructure projects is significantly more complex as actual benefits are either uncertain or not tangible. Even in projects where CBAs are routinely done (e.g.
transport, power, water and sanitation), accounting for external benefits (like improved health, pollution abatement) is rarely undertaken. Another important project level factor affecting investment decisions is financing. The public sector in developing countries is not always capable of undertaking infrastructure projects alone. Participation of the private sector via firms or communities in financing, building, and operating infrastructure investments is often sought. However, the first step should be to determine whether a specific project or portfolio is economically sensible, and then determine the optimal financial structure that makes it feasible.
Indirect project costs and benefits (also known as economy-wide impacts) –those that spill over to an economy from a project – must also be identified. They can be further divided into two sub-categories:
(i) impacts on economic growth and employment generation, and (ii) distributional impacts (e.g., welfare impacts, poverty alleviation) across different income level and geographical jurisdiction. In some cases, the size of indirect costs and benefits of an infrastructure portfolio might be as high as the corresponding direct costs and benefits. Typically a variety of approaches are used to assess economy- wide impacts of investment portfolios (including input-output approach, macroeconomic approach, and CGE approach), with the focus often on GDP and employment. If it is feasible to measure economic impacts,
18this is a powerful factor in prioritizing infrastructure projects or portfolios—most recently, for renewable and clean energy technologies and green growth agendas.
External costs and benefits – those that are not captured in direct or indirect costs and benefits – also matter but they are not easily quantifiable. One example is a better quality of life thanks to the access to electricity, telephone lines, clean water and adequate sanitation, or a road network. Another is the loss of forest or biodiversity while constructing a highway or electricity transmission lines. Although a social appraisal of an investment project attempts to assess external costs and benefits of an infrastructure project, such an assessment is qualitative in nature. Alternatively, valuation techniques can be used to appraise where markets fail—notably revealed and stated preference approaches. While different approaches are available to attempt to monetize at least part of the values associated with nonmarket goods and services, these are seldom used in project economic analyses, input-output, macroeconomic, or CGE approaches. Basing decisions solely on any of these approaches can thus skew infrastructure investments toward projects easily valued, while one could argue that public funds should go to those projects that yield the most public goods (e.g. power distribution versus flood protection).
18 In many circumstances, measuring economy-wide impacts of a project would not be feasible as necessary data (such as input- output table and social accounting matrix of an economy) are not available.
15
A final factor that needs to be accounted for is the strength or weakness of a country’s institutional system. In the best case scenario, politicians and policy makers account for the aforementioned factors and the information coming out from the respective methods when negotiating the prioritization of particular interventions. Independent or quasi-independent regulatory institutions (including the judicial and civil society) may also weigh in with checks and balances, blocking questionable infrastructure projects. However, the result of such a decision process is unlikely to be optimal when there is rent- seeking behavior – which refers to situations where individuals organized in special interest groups (or acting alone) are motivated by their particular interests rather than by the general interest of the society. Examples are industrialists wanting infrastructure investments that only (or mainly) benefit them and farmers seeking cheap or free power for irrigation. Rent-seeking behavior leads some groups to attempt to capture key state institutions (such as public contracts agencies) where they can extract rents. Infrastructure projects are by nature highly politicized and a significant source of rents. Political economy analysis focuses on distributing power and wealth between different groups and individuals, and the processes that create, sustain, and transform these relationships. This type of analysis helps to identify potential winners and losers of particular infrastructure interventions. For example, Sanchez et al. (2013) investigates the winners and losers in the rural and urban spaces of an increase in total factor productivity (TFP) in Pakistan’s transport sector. Understanding the political, economic, and social processes that promote or block pro-poor investments – and understanding the role of institutions, power, and the underlying context in countries – allow more effective and politically feasible investments.
196.1.2 Factor-based Ranking of infrastructure Investments
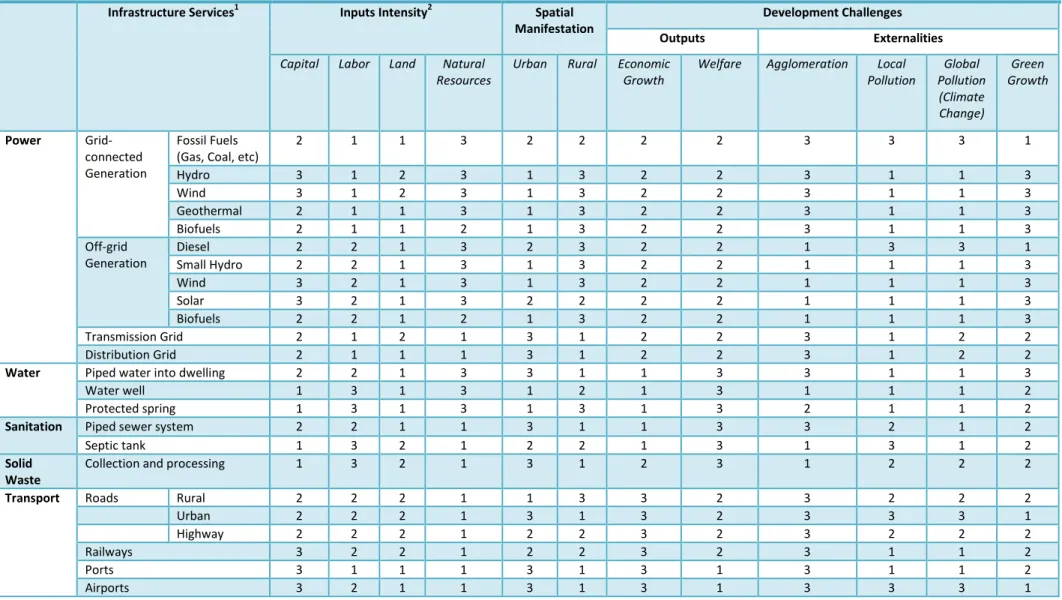
Taking into account all the aforementioned caveats, some stylized rankings can be designed to facilitate prioritization of infrastructure investments. Table 6 relates infrastructure services with some of the factors discussed above. Specifically, it ranks infrastructure services according to input intensity of use, degree of spatial manifestation, typical development outputs, and commonly debated market failures. The infrastructure services listed often fall under the public sector, but in some cases may be a combination of public and private provision. For example, sanitation via off-site systems is typically provided by public utilities, but on-site sanitation such as septic tanks are generally private investments.
The list is not meant to be exhaustive and provides ranks from 1 to 3, with 1 being the lowest relative weight, based on the existing literature on infrastructure services and its impacts discussed in the previous sections.
Different infrastructure services rank better depending on the specific factor of interest. Take the case of solid waste. This service (both collection and processing) is primarily labor intensive, dominates urban agendas, has an important impact on welfare improvement but less of a generalized impact on economic growth, and while it generates important market failures it is not a major contributor to agglomeration effects. In contrast, connective infrastructure (such as transport infrastructure) yields higher agglomeration effects and a higher impact on economic growth than solid waste infrastructure, but a lower impact on welfare. Similarly, connective infrastructure has a higher impact on economic growth than water and sanitation infrastructure, while the ranking is reversed when talking about welfare. When it comes to negative externalities such as local/global pollution, these are higher in the case of fossil fuels based power generation than water and solid waste infrastructure.
19 OECD - www.oecd.org/dac/governance/politicaleconomy
16
Table 6: Ranking of Prioritization of Infrastructure Investments (Scale: 1 to 3)
Infrastructure Services1 Inputs Intensity2 Spatial
Manifestation Development Challenges
Outputs Externalities
Capital Labor Land Natural
Resources Urban Rural Economic
Growth Welfare Agglomeration Local
Pollution Global Pollution (Climate Change)
Green Growth
Power Grid- connected Generation
Fossil Fuels
(Gas, Coal, etc) 2 1 1 3 2 2 2 2 3 3 3 1
Hydro 3 1 2 3 1 3 2 2 3 1 1 3
Wind 3 1 2 3 1 3 2 2 3 1 1 3
Geothermal 2 1 1 3 1 3 2 2 3 1 1 3
Biofuels 2 1 1 2 1 3 2 2 3 1 1 3
Off-grid
Generation Diesel 2 2 1 3 2 3 2 2 1 3 3 1
Small Hydro 2 2 1 3 1 3 2 2 1 1 1 3
Wind 3 2 1 3 1 3 2 2 1 1 1 3
Solar 3 2 1 3 2 2 2 2 1 1 1 3
Biofuels 2 2 1 2 1 3 2 2 1 1 1 3
Transmission Grid 2 1 2 1 3 1 2 2 3 1 2 2
Distribution Grid 2 1 1 1 3 1 2 2 3 1 2 2
Water Piped water into dwelling 2 2 1 3 3 1 1 3 3 1 1 3
Water well 1 3 1 3 1 2 1 3 1 1 1 2
Protected spring 1 3 1 3 1 3 1 3 2 1 1 2
Sanitation Piped sewer system 2 2 1 1 3 1 1 3 3 2 1 2
Septic tank 1 3 2 1 2 2 1 3 1 3 1 2
Solid
Waste Collection and processing 1 3 2 1 3 1 2 3 1 2 2 2
Transport Roads Rural 2 2 2 1 1 3 3 2 3 2 2 2
Urban 2 2 2 1 3 1 3 2 3 3 3 1
Highway 2 2 2 1 2 2 3 2 3 2 2 2
Railways 3 2 2 1 2 2 3 2 3 1 1 2
Ports 3 1 1 1 3 1 3 1 3 1 1 2
Airports 3 2 1 1 3 1 3 1 3 3 3 1
Notes: 1. The provision modalities considered for each infrastructure service are the best available technologies (BAT) to provide the specific infrastructure service. The BAT for a specific infrastructure service is the best ranked technology according to a cost-benefit analysis. In the case of power generation, the BAT varies by location; hence the different options; 2. Inputs intensity is based on BAT to provide the specific infrastructure service and the BAT for building the infrastructure needed to provide the infrastructure service.
17
6.1.3 Valuing or Weighting the Factors
20The biggest challenge in prioritizing infrastructure projects is how to value or weigh different factors that influence investment decisions. Decisions require understanding a goal or a set of goals and alternative paths to achieving these goals. In the case of infrastructure investments, these goals usually fall under welfare improvements (“a principle of inclusion”), including those that come from public goods like a cleaner environment) or fostering economic growth (“a principle of connectivity”) or both (Biller and Nabi 2013). If one considers that costs also imply forgone goals due to trade-offs that need to be equated, minimizing costs may be viewed as a goal or as a constraint to achieve other goals. A simple decision making matrix would thus bring together different goals with different paths to achieving these goals, and each cell would be filled by indicators (e.g. increase economic growth by 0.5% in year 1). One of the goals may act as a numeraire and weights may be assigned to the other goals with respect to this numeraire. From such a matrix, a weighted score of benefits can be derived. Once divided by the costs of each alternative path, a cost-effective indicator would be derived, indicating a preferred option. Both indicators and weights may have a high degree of subjectivity given the measurement issues. Weights may differ spatially (e.g. local versus global, across countries, rural versus urban), across economic sectors, across stakeholders, and across time (outcomes now versus future outcomes).
21A number of non-economic theories/techniques exist in the decision science literature to weight these factors. While desirable, not all factors affecting priority setting can be measured in monetized or quasi-monetized forms. In these cases, non-economic methods need to be used – including multi- attribute and multi-criteria decision theory, Delphi approach, and analytical hierarchy process (AHP).
All methods and techniques for priority setting in decision making come with caveats. Monetizing across the board has the advantage of converting factors in a common unit of measurement, but often generates important moral dilemmas. Alternatively, solely using expert opinion to direct decision making may result in skewed investments, as experts usually have their own bias toward their expertise.
Given the long-term nature of most infrastructure investments and their lock-in characteristic, the time dimension and how to discount the future play a particularly important role. Yet, this further complicates decision making since decisions made today generate political pressures and future rent- seeking. For example, implicit and explicit subsidies to urban sprawl in the United States generated a pattern of private vehicle dependency and expectations of a “rural” living combined with an urban experience and income generation. This in turn has tremendous external consequences that are difficult to address often because of political reasons. The process advanced mostly in the 1950s but continues today given vested interests. It is also well known that the way in which the future is discounted in decision making economic methods like CBA penalize the future with respect to the present. The economic logic of the currently used discount factor remains and enables comparisons of “apples and apples.” Yet, if long-term discrete or continuous phenomena that may potentially cause severe harm to societies – like pandemics, and climate change – are to be effectively addressed by decision makers, better methodologies need to be designed to enable comparisons for prioritizing investments across long time horizons under scarce resources.
6.2 Infrastructure Gap and Prioritization
20 It should be noted that the discussion here is not exclusive to infrastructure investments but encompasses decision making processes. Much of this discussion comes from OECD (2002).
21 This last factor becomes particularly important under uncertainty and over a long term as argued in Hallegatte et al. (2012).
18
Assessing the gap is fundamental to understand overall needs and potential financing requirements.
Yet, it should be noted that infrastructure gap assessment (IGA) does not necessarily determine which investments are priorities. IGA is usually based on a baseline of where a country, state, or municipality is in terms of infrastructure provision and where it would like to be in x years. The fact that IGA may be substantially larger in one infrastructure sector versus another does not infer that the large gap sector should be given all resources in a priority setting exercise. The size of the gap after all is also dependent on investment costs, existing technologies etc. The departure for priority setting exercises is the goals decision makers are attempting to reach. For example, if a goal is to generate employment, decision makers may place a large weight in labor-intensive infrastructure investments, while the IGA may indicate that the largest gap is in capital-intensive infrastructures.
226.2.1 Infrastructure, Economic Growth, and Welfare Debate
One of the burning questions any developing country often faces is how much financial resources should be allocated to infrastructure development, within infrastructure sectors, and other sectors (such as health, education, public safety, and national defense). But there is no rule to determine the investment allocations.
23It depends on a country’s priority, economic growth, and welfare objectives.
Considering that infrastructure is both a means to facilitate economic growth and development and a measure of the former, at least for developing countries – where there is greater scarcity of man-made and human capital related to infrastructure – one could expect that a higher share of GDP would need to be allocated for infrastructure investment. Funds received from bilateral and multilateral donor agencies may also be allocated for that purpose.
That said, there is a false dichotomy between prioritizing large-scale infrastructure versus addressing the needs of the poor. At a very basic level, this dichotomy is false because many large-scale infrastructure investments may concurrently facilitate economic growth and increase the welfare of poorer populations. For example, a large transport project may primarily target facilitating trade of raw materials, but at the same time it may also connect isolated poorer populations to better services. A more interesting debate is at which stage of development a particular infrastructure investment has a higher impact on economic growth versus on welfare. For instance, a power distribution project may have large welfare impacts given that it enables education and health outcomes, which may in turn translate into future economic growth as a more educated, healthier labor force join the labor market in the medium to long run. Yet, it may also facilitate growth in manufacture today, which in turn may promote short-term economic growth. Given that most power sources are limited, there is a clear policy choice related to power allocation for different usages. Instruments such as tariffs and other incentives play a vital role in allocating this scarce resource. Moreover, policy makers should be cognizant that attempting to apply the same standards across the board regardless of income may translate into no provision to the poor. For example, strict standards of offsite sewage collection may translate into no collection in slums, generating negative externalities to the rest of the city that the strict standards were
22Methodologies presented here are mainly ex-ante. They support decision making before the decision is taken. Yet, equally important for learning and adjustment in future decision making is to understand the impact of the interventions. For this purpose, one would need to design robust impact evaluations (IEs) such as randomized control trials, which are particularly challenging in infrastructure or infrastructure related investments. This is also an area that remains a major gap in the literature of decision making and priority setting.
23 Some existing literature attempted to address this question. Based on information from a previous study (Fay and Yepes, 2003), Estache and Fay (2010) estimate that developing countries might need 6.5% of their GDP, in average, during 2005-2015 period. Of which 2.3% would be needed to maintain the existing infrastructure and 3.2% for new infrastructure projects.
19