September 2011
Minimum Wage Increases in a Soft U.S. Economy
John T. Addison
Mckinley L. Blackburn
Chad D. Cotti
John T. Addison, Mckinley L. Blackburn, Chad D. Cotti Title:
Minimum Wage Increases in a Soft U.S. Economy ISSN: Unspecified
2011 Institut für Höhere Studien - Institute for Advanced Studies (IHS) Josefstädter Straße 39, A-1080 Wien
E-Mail: o ce@ihs.ac.atffi Web: ww w .ihs.ac. a t
All IHS Working Papers are available online: http://irihs. ihs. ac.at/view/ihs_series/
This paper is available for download without charge at:
https://irihs.ihs.ac.at/id/eprint/2085/
Minimum Wage Increases in a Soft U.S. Economy
John T. Addison, McKinley L. Blackburn, Chad D. Cotti
Reihe Ökonomie
Economics Series
Reihe Ökonomie Economics Series
Minimum Wage Increases in a Soft U.S. Economy
John T. Addison, McKinley L. Blackburn, Chad D. Cotti September 2011
Institut für Höhere Studien (IHS), Wien
Institute for Advanced Studies, Vienna
Moore School of Business University of South Carolina 1705 College Street Columbia, SC 29208, USA email: ecceaddi@moore.sc.edu and
Institute for Advanced Studies, Vienna McKinley L. Blackburn
Department of Economics Moore School of Business University of South Carolina 1705 College Street Columbia, SC 29208, USA email: blackbrn@moore.sc.edu Chad D. Cotti
Department of Economics University of Wisconsin-Oshkosh 800 Algoma Boulevard
Oshkosh, WI 54901, USA email: cottic@uwosh.edu
Founded in 1963 by two prominent Austrians living in exile – the sociologist Paul F. Lazarsfeld and the economist Oskar Morgenstern – with the financial support from the Ford Foundation, the Austrian Federal Ministry of Education and the City of Vienna, the Institute for Advanced Studies (IHS) is the first institution for postgraduate education and research in economics and the social sciences in Austria. The Economics Series presents research done at the Department of Economics and Finance and aims to share “work in progress” in a timely way before formal publication. As usual, authors bear full responsibility for the content of their contributions.
Das Institut für Höhere Studien (IHS) wurde im Jahr 1963 von zwei prominenten Exilösterreichern – dem Soziologen Paul F. Lazarsfeld und dem Ökonomen Oskar Morgenstern – mit Hilfe der Ford- Stiftung, des Österreichischen Bundesministeriums für Unterricht und der Stadt Wien gegründet und ist somit die erste nachuniversitäre Lehr- und Forschungsstätte für die Sozial- und Wirtschafts- wissenschaften in Österreich. Die Reihe Ökonomie bietet Einblick in die Forschungsarbeit der Abteilung für Ökonomie und Finanzwirtschaft und verfolgt das Ziel, abteilungsinterne Diskussionsbeiträge einer breiteren fachinternen Öffentlichkeit zugänglich zu machen. Die inhaltliche Verantwortung für die veröffentlichten Beiträge liegt bei den Autoren und Autorinnen.
Do apparently large minimum wage increases in an environment of straightened economic circumstances produce clearer evidence of disemployment effects than is typically reported in the new economics of the minimum wage? The present paper augments the sparse literature covering the very latest increases in the U.S. minimum wage, using three different data sets and the principal estimation strategies for handling geographically-disparate trends. Despite the seemingly more favorable milieu for identifying displacement effects, and although our treatment calls into question one well-received estimation strategy, our preferred specification generally fails to support a finding of negative employment effects.
That is to say, minimum-wage workers are apparently concentrated in sectors of the economy for which the labor demand response to statutory wage hikes is minimal. Popular concern with a “recessionary multiplier” thus seems overdone.
Keywords
Minimum wages, disemployment, earnings, low-wage sectors, geographically-disparate employment trends, recession
JEL Classification
J2, J3, J4, J8
I. Introduction 1 II. Recent Minimum-Wage Increases 3 III. Econometric Models and Data 7
A. Models ... 7 B. Datasets ... 9
IV. Empirical Findings 14
A. Results from the QCEW ... 14 B. Results from the CPS ... 17 C. Results from the ACS ... 21
V. Conclusions 23
References 25
Tables 27
I. Introduction
The earliest of the modern literature tackling the impact of minimum wages on labor- market outcomes tended to point fairly uniformly to the existence of small, negative effects of higher minimum wages on employment (Wellington, 1991; Brown, 1999). This result was supported in both time-series studies and state-level panel data research
focusing on teenagers. By contrast, a series of studies that focused on employment outcomes within the fast-food sector (most notably, Card and Krueger, 1995) failed to reproduce this finding of a negative employment effect, although the robustness of the fast-food estimates to data-measurement issues and statistical approach were soon to be called into question.
1However, recent studies using panel data from the restaurant industry (Addison et al., 2011; Dube et al., 2010) have tended to corroborate Card and Krueger’s lack of evidence of a negative employment effect. And other contemporary studies considering teenagers, rather than restaurants, have often tended to find less evidence of a general negative effect for teenagers.
2What accounts for this erosion of adverse minimum wage effects in recent
studies? Although there have been some changes in modeling/statistical approach, it may also be the case that the effect of minimum wages on employment has diminished to such an extent over the years that it is difficult, with currently available data, to distinguish statistically the effect from zero. That is to say, as later and later years of data are made available the researcher is increasingly adding years in which the minimum wage is low, both in real terms and relative to the average wage in the economy. As the minimum wage has fallen, decreasing numbers of, say, teenage workers will be affected by the legislation, so that any disemployment effects are also likely to be smaller.
3It is also the case that the recent literature has added data from years in which the general health of the U.S. labor market has been strong. Unlike the high unemployment years of the later
1Kennan (1995) and Neumark and Wascher (2000) questioned the data used by Card and Krueger, with Card and Krueger (2000) responding that such issues did not perturb their primary finding. In addition, Donald and Lang (2007) later criticized the necessary statistical assumptions that underlie the inherent small-scale experiment in the Card and Krueger approach.
2 See in particular Allegretto et al. (2011). Further, Neumark and Wascher (2007) also fail to uncover statistically significant evidence of a negative effect for teenagers in general, although not for particular minority/gender groups. Sabia (2009) does still find evidence of a negative employment effect for teenagers, a result Allegretto et al. argue is not robust to specification choice.
3 Analogously, an opposite situation was used as justification by Castillo-Freeman and Freeman’s (1992) for their finding of major adverse minimum-wage effects in Puerto Rico.
1970s and 1980s, the 15-year period after the 1991 federal minimum-wage increases was marked by relatively tight labor markets. Both Neumark and Wascher (2002) and
Holmes et al. (2009) have presented models consistent with minimum wage effects having larger adverse effects during recessionary periods.
Of course, the performance of the U.S. economy in the last few years can scarcely be viewed as stellar, as indexed by a doubling of the unemployment rate to over 10 percent at its peak. At the same time, the U.S. has also raised the federal minimum wage by over 40 percent from July 2007 to July 2009. Although many states had raised their minimum wages above $5.15 before the first installment in this round of increases, the hike in the federal minimum still had an effect in the vast majority of states, and was fully effective in over 70 percent of states by August 2009.
The idea of a substantial increase in the minimum wage during the most
significant recession in recent years drew frequent criticism from economists and other observers. If the 1991-2007 period was characterized by decreasing relative minimum wages and by low unemployment, a reversal of these trends in recent years might be expected to produce the result that the employment costs of the most recent minimum wage increases should be larger than before. Indeed, it was this expectation that partly motivated the research of Even and Macpherson (2010), who concentrated on the post- 2004 period and found evidence of somewhat larger disemployment effects than normally reported in recent research using earlier data. Specifically, their estimated elasticities for 16-19 year olds are in the range -0.19 to -0.32, and at the higher levels of each range with the inclusion of lagged effects. Superficially at least, there was therefore some suggestion of an uptick in implied disemployment effects, but these results do not hold up if one controls for trends more precisely and weights estimate appropriately.
In what follows, we also focus on recent data in estimating minimum wage effects on employment. We examine the restaurant-and-bar sector and a number of other low- wage industries, using three different data sets – the Quarterly Census of Employment and Wages (QCEW), the Current Population Survey (CPS), and the American
Community Survey (ACS). Further we are able to distinguish between three demographic groups – teenagers, young adults, and junior-high dropouts – for two of these data sets.
Mindful of issues related to heterogeneity in geographic trends in recent years, we shall
estimate our models using two recent approaches suggested for controlling for
geographic-specific trends. Overall, this study allows for an investigation of minimum wage effects during a period when wage minimums were rising in the face of a strong recession, and utilizes three different estimation approaches with three separate data sets across multiple industries and demographic sub-groups. Our results provide no evidence that recent minimum wage increases have reduced employment within low-wage
industries, and only limited support for a negative impact on teenage employment.
II. Recent Minimum-Wage Increases
Concerns over the impact of recent increases in the federal minimum wage have centered on the conjunction of two fears. The first was the perception that the minimum wage was being increased very substantially. The second was the timing, during a period in which the economy might not be able to easily absorb these increases well. Most labor economists were aware that infrequent increases in the minimum wage over the 1980- 2005 interval had caused it to fall considerably relative to average wages and assumed that the 40 percent legislated increase would substantially change this situation. Passed in May of 2007, the federal minimum-wage increase occurred in three separate $0.70 increases on each July of 2007-2009. At the time of the increase, only seven states had a minimum wage that was higher than the federal mandate of $7.25 that the legislation set for July 2009.
How sizeable was this minimum wage hike? It is perhaps useful to compare the
increases in question to the kind of changes we have observed in the past. The top line in
Figure 1 plots the real value of the federal minimum wage relative to the average real
value of the federal minimum over the 1939-2009 period. Values greater than one
indicate that the minimum wage is higher than the period average. The final increase in
July 2009 did lead to a federal minimum that was higher than the historical average, but
just barely. Indeed, the real value of the federal minimum was actually higher throughout
the period from the late 1950s to the middle 1980s. In short, on this metric the recent
episode is not particularly notable.
The bottom line in Figure 1 charts the federal minimum wage relative to the average wage in manufacturing. This construct also shows that the contemporary relative minimum wage is not particularly high compared with that earlier period. Thus, the federal minimum relative to the average manufacturing wage is only slightly higher in 2009 than it was after the last federal increase in 1997. On the other hand, the increase in the late 2000s was from a base federal minimum that on this measure had not been that low since 1950. So, in an absolute sense, the increases of 2007-2009 were non-trivial.
Of course, the period since 1980 has witnessed a plethora of state legislation adopting state minima that exceed federal levels. Figure 2 repeats the plot of the federal minimum relative to the average manufacturing wage for the last three decades, but now also charts that same average when the state minimums are also taken into account.
4Although state minimum increases also caused the overall state average to diverge from
4 We weight the minimum in each state by the state’s population in calculating the average minimum wage to be used in forming the relative state minimum wage. Note that the relative state minimum wage calculation includes all states, including those paying the federal minimum.
the federal minimum in the late 1980s and mid 1990s (both periods in which the federal minimum was not increased over several years), the importance of state minimum wage legislation is noticeably different over the last 10 years. Specifically, taking state minima into account, the relative minimum wage in 2009 was at its highest relative level since 1985.
Turning next to the issue of the broader economic backdrop, the idea that
minimum-wage effects might depend on the state of the economy – in our case, an
economy that was slipping into recession – seems worthy of examination. After all,
minimum wage positions tend to be unskilled jobs characterized by high turnover that are
most prone to disappear during a downturn. However compelling, this possibility has not
been the focus of much previous research in the minimum wage literature. There are
three principal exceptions. One is Neumark and Wascher (2002), who present a
disequilibrium treatment and explicitly model whether labor market outcomes lie at
equilibrium of labor supply and demand or on the labor demand curve alone (only in the
latter case is the minimum wage effective). The authors implement an endogenous switching regression model with employment data for 16 to 24 year olds, 1973-1989, that provides estimates of minimum wage effects when they are binding and also the
probabilities that observations are on the labor demand curve only. For our purposes, their critical result is that the probability that the minimum wage will be binding increases when the prime-age male unemployment rate is increasing.
Holmes et al. (2009) provide a different framework by estimating separate minimum-wage equations for NBER-defined contractions and expansions of the
economy, using aggregate U.S. time-series data for 1954-2008. They find evidence of a negative employment effect from minimum wages only during contractions when a 10 percent increase in the minimum wage is found to decrease white (black) teenage employment by 3.1 (5.0) percent. On the other hand, a dissenting result is provided by Allegretto et al. (2011) in a wider ranging study using CPS data on teens for 1990-2009.
The authors test for the role of the cycle using both cross section and time series variation in the unemployment rate. Neither interaction terms of minimum wages with
unemployment rates nor the joint effect of the minimum wage and the unemployment rate prove statistically significant.
In this paper, we examine the possibility that the severity of the recent recession
has created an environment in which minimum wage increases are likely to produce
stronger evidence of a negative employment effect. We are not the first to examine
minimum wage impacts during the recent recession. As was noted earlier, Evans and
Macpherson (2010) concentrate on the 2005-2009 period, and report negative minimum
wage effects on employment for teenagers during this interval. Another study by Gittings
and Schmutte (2010), using both CPS and Quarterly Workforce Indicators data, also finds
a negative effect on teenage employment for the longer sample period 2000-2009. Only
Hirsch et al. (2010),who investigate establishment-level data for quick-service restaurants
in Georgia and Alabama, 2007-2009, fail to uncover evidence of a negative employment
effect. Our goal is to add materially to these findings by utilizing three different data sets
to estimate employment effects for various demographic and industrial groups typically
associated with low-wage employment, with a particular focus on the 2005-2010 period..
III. Econometric Models and Data
A. ModelsOur primary empirical modeling uses the QCEW (or other data) to construct measure of employment and earnings across different counties (or states) in the U.S. The panel nature of our data allows us to exploit both cross-sectional and time-series effects in estimating how these outcomes vary with minimum wages. In particular, our basic set of models are specified as
it t i it 2 it 1
it
log( MW ) x
y
, (1)
where y is either the log of employment or the log of average weekly earnings, MW is the state-level minimum wage, x is a vector of other covariates potentially affecting y, and i refers to county or state, depending on the data set. Our fixed-effects estimation directly controls for geographic ) ( and time ) ( effects. “Clustered” standard errors robust to the presence of heteroskedasticity and to any correlation in errors between observations in the same state are used for inference. The use of these standard errors is particularly important in the QCEW given our primary variable of interest – the minimum wage – is measured at the state level.
As noted in the introduction, estimates of minimum-wage elasticities can be sensitive to the particular time period examined, and to the manner in which
geographically-disparate trends are handled in the estimation. In extensions to the above basic model, we shall employ two different methods of controlling for county-specific trends. The first is to explicitly incorporate these trends in the estimation of the model, so that our estimating equation becomes
it i t i it 2 it 1
it
log( MW ) x t
y
. (2)
Given the large number of counties in the QCEW sample, county-specific trends are most
easily incorporated by initially detrending all variables at the county-level, and then using
these detrended variables in the estimation. Both Addison et al. (2010) and Allegretto et
al. (2011) show that incorporating such trends can materially affect minimum-wage estimates (for the 1990-early 2000s period).
An alternative approach to handling geographically-disparate trends is to study border pairs (as in Dube et al. 2010). In this estimation, every pair of counties bordering each other but in different states is designated as a separate county pair (denoted with the subscript p), and the model is specified as
ipt pt ipt 2 ipt 1
ipt
log( MW ) x
y
. (3)
The individual county subscript i has only two values for each county pair, so fixed- effects estimation becomes the same as differencing the model across the two counties in a pair for each time period, and then estimating the model using these border-county differences. Such a specification does relax the linearity restriction on time trends inherent in the county-specific trend model, as the county-pair effect (
pt) is allowed to vary in whatever fashion over time (although it is restricted to be the same pattern for the two counties in that pair, something the detrended approach does not assume). One limitation of this model setup is that the same county will be included in the data more than once if it borders more than one county in the other state. To avoid overemphasizing counties in multiple pairs, we follow Dube et al. in weighting each county observation by the inverse of the number of times that county appears in the data set paired with a border county.
5Nonetheless, this estimation procedure still has the unattractive characteristic that many counties will be entered multiple times in the estimating sample, each time with a possibly different value for the fixed effect in the error term for determining the same employment level for that county.
6In using the CPS and ACS data, reliable measures of employment and earnings are only available at the state level. We modify the above border-county approach to
5In particular, the weight we construct is the average population in that county divided by the number of times that county appears in the border analysis. This is to accord with our two earlier-discussed estimations which also weight by average population.
6 As in Dube et al., we use two-way clustering that allows for correlation of any observations from the same state (note that this includes multiple repeats of the same county/quarter observation that necessarily appear in the data in this approach) as well of any observations that are in different states but share a common state-pair border.
consider instead all border-state comparisons, essentially generalizing the kind of two- state comparison considered in Card and Krueger (1995). As with the border-county estimation, any state that borders more than one other state will have its data included more than once in the estimated model. As noted above, we adjust our weights in estimation to reflect the number of times the state’s data enter the regression.
B. Datasets
1. QCEW
Our first set of models is estimated using data from the Quarterly Census of Employment and Wages (QCEW). These data are collected by the Bureau of Labor Statistics (BLS) from paperwork filed by employers with the unemployment insurance program, and so have excellent coverage. Geographic information down to the level of the county of the establishment is available in the public use data, and we construct measures of employment and earnings at this level. The industry of the establishments is coded using the North American Industrial Coding System (NAICS), allowing us to construct measures of total employment and average weekly earnings within specific sectors of the economy.
One limitation of the QCEW public use data is that the BLS censors observations when the number of establishments in a sector in the geographic area is low, leading us to omit many small counties from the analysis. Usually observations are present for either every quarter or for no quarter for any given county, and so we construct a balanced panel of counties with every quarter available in our analysis of the QCEW. Another limitation of the QCEW data is that no information on hours of work is available, so we are only able to construct a weekly earnings average.
7For a more detailed description of the QCEW data, see Addison, et al. (2010).
Our choice of sectors to analyze with the QCEW data centers on those that tend to pay low wages, but also with a tendency to have a sufficient number of establishments in a county so as to lessen censoring problems. Following both Addison et al. (2010) and Dube et al. (2010), much of our analysis will focus on Food Services and Drinking Places, as this is the sector in which minimum-wage employment is most prevalent. The
7 This measure includes most wage-like compensation, including tips, bonuses, stock options, and employer contributions to retirement plans.
QCEW data also allow us to disaggregate employment within this general sector, and so we also estimate models that use Full-Service Restaurants and the Limited-Service Eating Places as separate subsectors for which we estimate employment and earnings
regressions.
8,9Two additional sectors from the retail trade area are also studied here, namely the Food and Beverage Stores sector and the Gasoline Stations sector – as noted in Addison et al. (2009), both of these sectors employ a reasonably large number of workers with earnings just above the minimum wages, and censoring problems are reasonably small for these sectors.
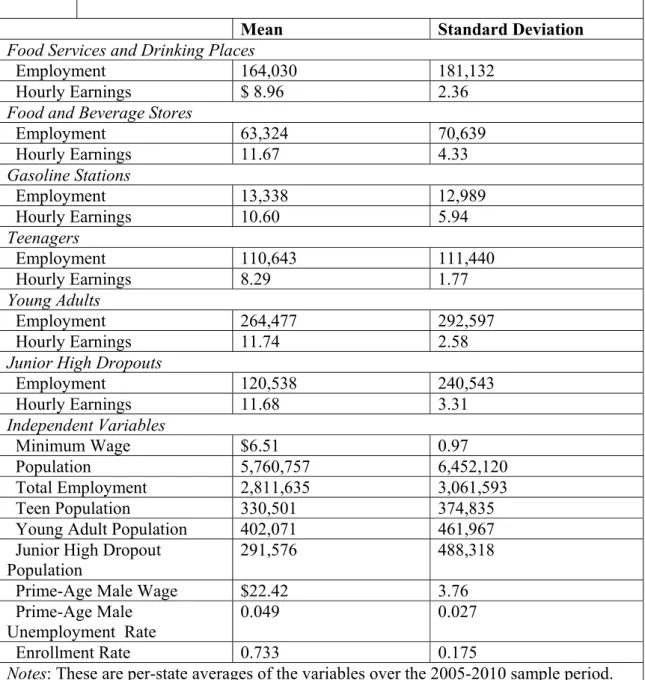
The independent variables in our models include relatively standard measures of demand/supply factors that could reasonably affect employment within low-wage sectors in a county. Most importantly, our minimum wage variable is the effective minimum wage measured at the state level (discussed above). For quarters in which the state raised the minimum wage in the middle of the quarter, we calculate the minimum wage for that quarter as the weighted average of the older and newer minimum (with weights
depending on the percentage of the time in that quarter in which the particular minimum is in effect). Population is included to capture effects of the size of the county on employment, while total employment in the county (from the QCEW) reflects effects from the size of the labor market. The average weekly earnings across all sectors is also included as a control, capturing whether the county has particularly high or low average wages in that quarter. The unemployment rate of the county (taken for the Local Area Unemployment Statistics) is included as a measure of the severity of the recession, while the school enrollment rate for individuals aged 16-24 is included as a potential supply
8 The remainder of the Food Services and Drinking Places sector is made up of drinking places and caterers, both of which have a greater likelihood of being censored than the two subsectors we do analyze.
9A share of the workers in the Full-Service Restaurants sector includes tipped employees, for whom minimum wage legislation does generally apply. State and federal minimum wages for tipped employees do exist, and are frequently tied to the minimum wage in effect. Specifically, while there is variation in how much “tip credit” is allowable, in all states the hourly wage including tips for “exempt” employees must still equal (or in some cases exceed) the highest minimum wage enforced in that state (whether it be state or federally determined). Moreover, in sevenl states (Alaska, California, Minnesota, Nevada, Oregon,
Montana, and Washington) no tip credit is allowed to employers, so the state minimum wage applies to all employees regardless of tip status. In twenty-six other states a partial-credit is enforced. Therefore, for employees in the Full-Service Restaurants sector most employees (tipped or non-tipped) will be affected by changes in minimum wages laws as, at the least, it will impact the tip-plus-wage rate they must legally be paid. Nevertheless, we do check the robustness of our results for the Full-Service Restaurants sector by alternatively treating the minimum wage as fixed for states where sub-minimum wages for tipped employees have not varied in recent years.
measure. This latter variable is measured at the state level using the Current Population Survey, and its inclusion is somewhat controversial as it is argued that it may be
endogenously determined with employment. Detailed summary statistics for our measures across the five sectors or subsectors we analyze are provided in Table 1.
2. The Current Population Survey
Although our initial analysis focuses on the QCEW data, we also estimate models for employment and earnings at the state level, using monthly data from the Current Population Survey (CPS). The CPS has been the most widely-used source for data in minimum-wage studies since the work of Card (1992)and Neumark and Wascher (1992).
Most of this research has concerned potential effects of the minimum wage on particular demographic groups – most commonly teenagers aged 16 to19 years but also ranging further afield to include young adults aged 20 to 24 years and/or high-school dropouts in some studies. We also use the CPS to study employment and earnings effects for all these groups, where dropouts are defined as those individuals aged 24 years or older but who have 9 years or less of completed education.When using the CPS, the complete set of respondents to the basic monthly survey is used in measuring employment for the various demographic groups. However, as earnings information is asked of the approximately one quarter of the sample that is part of the Outgoing Rotation Group (ORG), we have considerably fewer observations when measuring average earnings.
10That said, one advantage of the ORG sample over the QCEW data is that we can measure average hourly earnings: workers are asked their hourly wage if they are paid by the hour, but information on hourly earnings can be constructed from reports on usual hours worked for those workers whose earnings are specified at a weekly (or higher) rate.
11Also, given the aggregation of the observation from the county level to the state level, we are
10We find it odd that much of the recent research appears to use only the ORG samples to measure both employment and earnings, when more accurate measures of employment are available using the full monthly CPS.
11 In calculating the state averages for earnings, we drop all observations for whom the relevant earnings level was imputed in the CPS. This addresses concerns raised by Hirsch and Schumacher (2004) that regression estimates may be biased when imputed earnings are used for dependent-variable observations when the imputation is not based on values for relevant independent variables. The CPS does not use state as relevant individual information in constructing earnings imputations, so imputed earnings amounts are not appropriately matched to the minimum-wage value possibly relevant to the determination of that earnings value.
considerably less likely to experience missing observations due to lack of data with the CPS.
Although the CPS data have been used quite heavily in ascertaining minimum wage effects for particular demographic groups, they have not been widely used to address outcomes in specific industrial sectors. Since January 2003, however, the CPS has used the NAICS coding system for industrial classification, thereby allowing us to replicate our industrial-level QCEW analysis using the CPS data. The one limitation in this regard is that the CPS does not disaggregate the Food Services and Drinking Places, meaning that we are unable to undertake a separate analysis of full-service and limited- service restaurants.
We should also note that there are a few minor changes in definition for some of the independent variables in our CPS analysis. In particular, unemployment rates are now measured at the state-level, leading us to select the more traditional prime-age male unemployment rate as a control for recessionary conditions. This choice was not open to us with the QCEW, given the need for a county-level measure. Further, the average wage variable is now calculated using prime-age men only. Means and standard deviations for the CPS data are reported in Table 2.
3. The American Community Survey
The U.S. Census Bureau instituted the American Community Survey (ACS) as an
ongoing survey that obtains data similar to the former long-form of the decennial census
(which it replaced). The ACS surveys individuals every month, with a sample size that is
roughly five times larger than that available from the CPS. Given that earnings and labor-
supply questions are asked in the ACS, it potentially serves as a useful alternative to CPS
data in labor economics research. To be sure, the sampling frame for the first years of the
ACS was relatively small but, beginning with the 2005 survey, this increased to a sample
of roughly one percent of the population. Nonetheless, we begin our analysis with the
2006 data, as only in that year did the ACS start to include individuals living in group
quarters (such as college dorms). Our analysis ends with the 2009 data, the latest year in
which an ACS public use sample was available at the time of the writing. We are
unaware of any previous research on minimum-wage effects that has made use of the ACS.
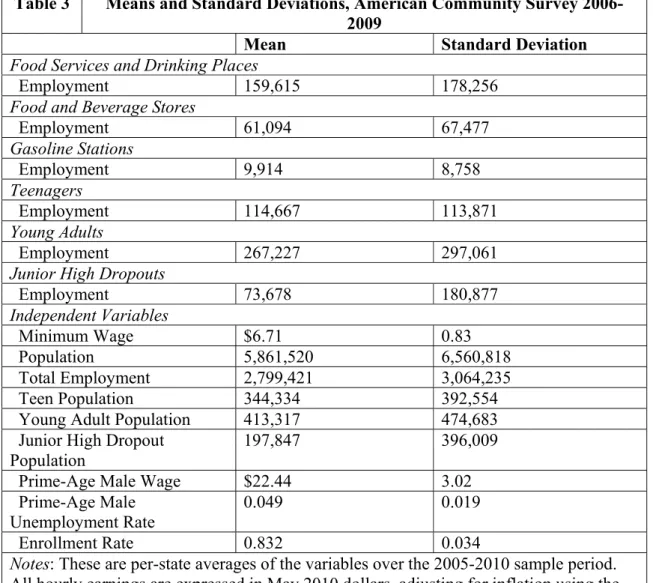
Although the ACS has the considerable advantage of providing more precise measures of the variables of interest tous, it has one important weakness. The ACS does not identify the month in which the interview takes place, only the year. As a result, current employment status reported by respondents in the ACS could refer to any of the 12 months of the year. If minimum-wage changes were initiated at the start of any year – as is most common with state-level changes – thiswould pose little difficulty. But much of the variation in minimum wages comes from increases in the federal minimum over 2007-2009; and all such increases occurred in July. This timing problem is perhaps not a severe in analyzing employment, when we use annual measures and assign a weighted average minimum wage (similar to the quarter-based minimumwage averages used with the QCEW). However, the fact that earnings in the ACS are measured in retrospective fashion, referring to total earnings in the previous twelve months, the inability to pinpoint the month of the report implies that any stated earnings could be related to any month in a two-year period (implying that the corresponding minimum-wage variable would need to be a weighted average over a two-year period). In this light, and given that we are less interested in earnings effects than employment effects, we restrict our analysis to employment outcomes in analyzing the ACS data.
As with the CPS, the ACS allows us to analyze employment outcomes for either demographic groups or industrial sectors. The ACS also uses the NAICS coding for industry, but like the CPS does not separately identify limited-service and full-service restaurants. With the exception of earnings, our control variables are taken from the ACS.
Problems with measuring earnings led us to use the prime-age male hourly earnings for
that state and year from the CPS, simply averaging across the 12 months for any state to
obtain our annual measure of this variable. Means and standard deviations for the
variables in this analysis are reported in Table 3.
IV. Empirical Findings
A. Results from the QCEWOur initial set of estimates focuses on minimum-wage effects on both
employment and earnings in the general restaurant-and-bar sector. Our expectation is that an increase in the minimum wage should lead to an increase in earnings, but that the elasticity should be considerably less than one (given that the majority of workers in the sector earn above the minimum wage). Any failure to find evidence consistent with this expectation could cast doubt on the particular empirical approach being used. Although recent minimum wage research for the restaurant-and-bar sector has pointed to an
absence of employment effects during the 1990s and early 2000s, the different nature and environment of minimum wage hikes in the late 2000s could lead to different findings for this latter interval.
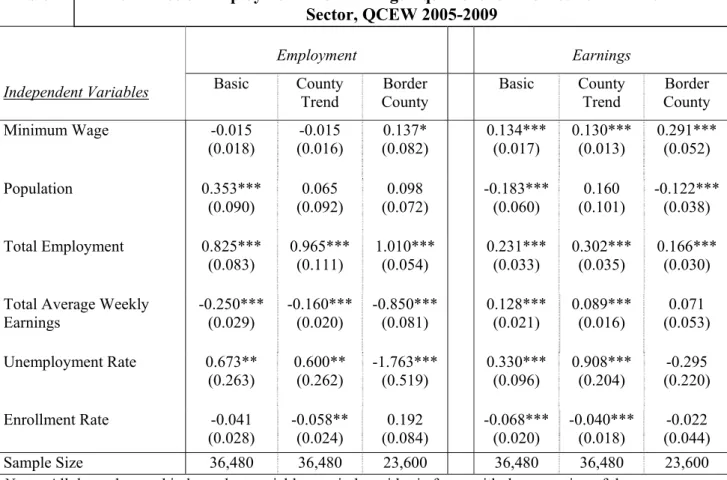
Table 4 reports estimates for three different specifications for handling geographic-specific trends. Our “basic” specification includes time dummies for each quarter in our sampled period. It thus controls nonparametrically for a general national trend in employment, but allows for no county-specific variation in that trend (see equation 1). The “county-trend” specification (detailed in equation 2) allows for a separate linear trend in each county (in addition to the general nonparametric national trend). Finally, the “border-county” specification allows for a shared nonparametric trend between any two border counties (see equation 3).
The estimated minimum wage coefficients in the earnings equations are generally as expected. Incorporating linear county-specific trends has little impact on this result, although the border-county analysis more than doubles the size of the estimated minimum-wage impact on earnings. The estimates are of a similar magnitude to those provided in Addison et al. (2011) and Dube et al. (2010), although the current border- county results are somewhat higher than these previous estimates.
12Both of these earlier papers failed to find statistically significant effects on employment in the broad
restaurant-and-bar sector, and a similar finding occurs here in the results that control for county-specific trends. However, the results from the border-county analysis (presented
12 In Addison et al.’s preferred specification with county-specific trends, the estimated earnings elasticity is 0.171, while in Dube et al.’s preferred specification using border-county pairs the estimated elasticity is 0.188. Both estimates are statistically significant at conventional levels.
in Table 4) actually provide a marginally significant positive elasticity for employment of around 0.14. The coefficient estimates for the control variables are generally as expected and somewhat similar across specifications, although the county-trends estimation does provide a somewhat unexpected positive and statistically significant coefficient estimate for the unemployment rate in the employment equation. However, the estimated impact is not large: an increase in the unemployment rate of 5 percentage points would be
predicted to increase employment in the sector by 3 percent, all else equal.
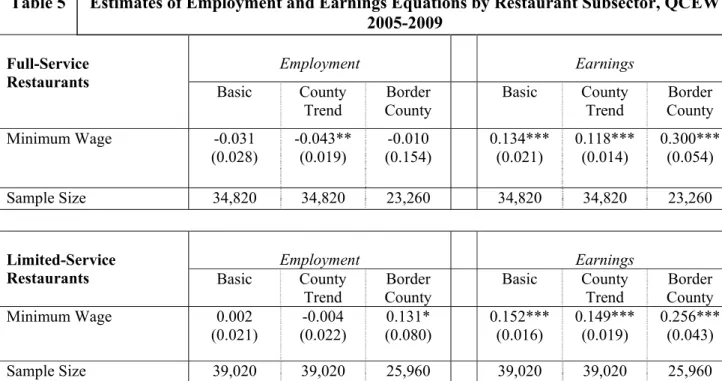
Separate estimates for the limited-service and full-service restaurant sectors are reported in Table 5. Our expectation is that as the use of minimum-wage labor is more prevalent in the limited-service (fast-food) sector, the minimum wage impact on earnings should also be higher. This expectation was supported in both Addison et al. (2011) and Dube et al. (2010). It is also borne out here to a limited extent, at least for the county- trend results in Table 5 (but not for the border-county results). The two earlier studies differed with respect to employment effects across the two subsectors – Addison et al.
(2011) reported a negative employment effect of minimum wages in the limited-service subsector but a positive one in full-service restaurants, while Dube et al. (2010) failed to find a statistically significant effect in either subsector. Turning to the results of the present study for 2005-2009, the border-county approach finds that the evidence of a positive employment elasticity is surprisingly from the limited-service subsector. On the other hand, the county-trend specification suggests a statistically significant negative effect, but now for the full-service subsector. That said, this latter estimate is nonetheless quite small – an elasticity of around -0.05 – but is significant due to the very small standard error provided with the county-trend analysis. In fact, most of the standard errors are smaller in the current set of results compared with the parallel results in the two earlier studies, despite the smaller time period. This outcome likely stems from the greater variation in the minimum-wage variable in the later period compared to the earlier data.
1313 To explore the sensitivity of the results in the Full-service Restaurant sector to the treatment of minimum wages for tipped employees (see footnote 9), we constructed a new minimum wage variable that holds the nominal minimum wage constant in states where changes in the regular minimum wage occurred but where the tipped-worker sub-minimum was not changed. While the employment coefficient estimate for the
“basic” method is now larger in magnitude and statistically significant when we use this alternative
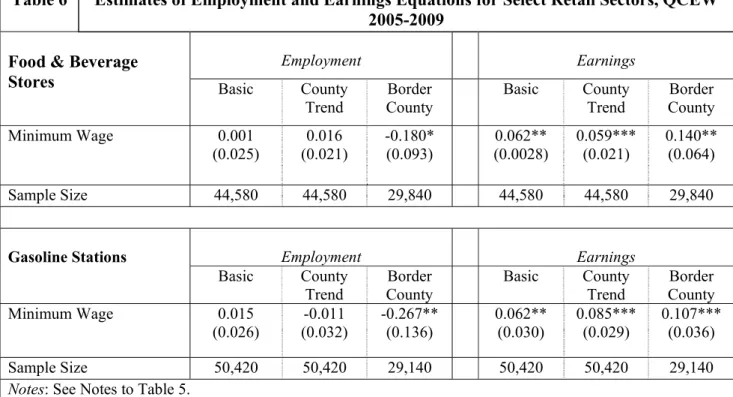
Our next set of estimates, reported in Table 6, is based on data from food and beverage stores and from gasoline stations. The basic and county-trend results suggest small earnings impacts for both sectors, and no suggestion of an employment effect in either sector. On the other hand, the border-county analysis suggests a negative impact on employment in both sectors, and one that is particularly large – an elasticity of almost -0.3 – among gasoline stations. Given that the percentage of workers earnings no more than $1 above the minimum wage in gasoline stations was only 13 percent in 2005 (Addison et al., 2009), this sizeable elasticity seems somewhat unlikely. In general, we find the border-county results for this period unstable and often implausible, and given our reservations about the inconsistencies in this specification we tend to find the county- trend approach preferable in handling geographically-diverse trends.
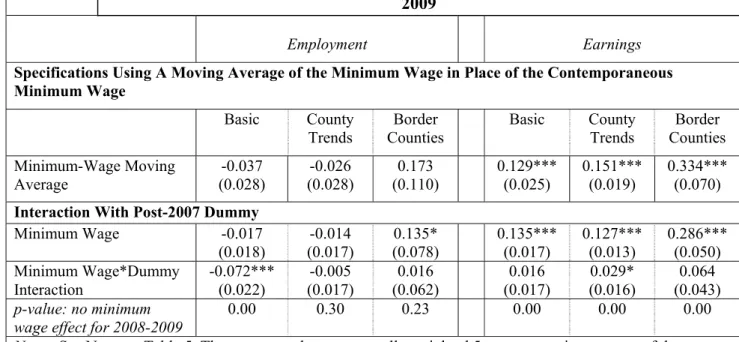
Next, we return to our broad food services and drinking places sector to examine the role of lagged minimum wage effects as well as the differences in effects during the recession years. Past research has often found support for lagged effects from minimum wage changes (see the discussion in Neumark and Wascher, 2006). The justification is that adjustments to mandates are not instantaneous, most notably on the employment side where lags of up to a year have commonly been examined. To avoidexpanding the
number of parameters to be estimated dramatically, we use a five-quarter moving average of the minimum wage with four lags, equally weighting the current quarter and all
quarterly values of the minimum wage within the previous year. Results of this exercise are contained in the upper panel of Table 7. None of the estimated employment
elasticities is statistically significant. The opposite is of course true for the earnings equation, where all coefficient estimates are strengthened (although it is not clear why we should expect any important lagged effect for earnings).
The lower panel of Table 7 allows the minimum wage effect to differ between the 2005-2007 and 2008-2009 intervals. The first period pinpoints years in which the
economy was still growing while the second period isolates the recession years when the
measure of the state minimum wage (an estimate of -0.08, with a p-value of 0.001), conclusions from the county- trend and border-county results are not affected.
unemployment rate was significantly higher.
14It is also the case that much more of the variation in the minimum wage in the later period was due to federal minimum wage changes, so that this comparison should also inform as to whether it makes sense to draw a distinction between the effects of federal and independent state minimum wage
initiatives. From the lower panel of the table it is apparent that the earnings results are scarcely impacted, although in our preferred specification there is some indication of a modestly higher minimum wage effect in the later period. As far as employment is concerned, there is some indication of a negative minimum wage effect that is present only in the recessionary years, but this result disappears once geographic-specific trends are incorporated. Neither the county-trend nor border-county analysis provides
statistically significant evidence of a negative employment effect during the recession years.
By way of summary, our preferred estimates do not suggest negative (or positive) impacts of recent minimum wages on employment within the sector analyzed, with the exception of a small negative effect estimated among full-service restaurants.
B. Results from the CPS
The CPS allows us to examine minimum-wage effects both at the industry and demographic-group level. Observations here can be measured monthly, but only at the state level. We attempt to assimilate the estimation approaches used with the QCEW data, adding a separate state-specific linear trend in the “state trends” specification and comparing all border states (instead of border counties) in the “border-state”
specification.
15Although there has been much recourse to the CPS to estimate
minimumwage effects for demographic groups, especially teenagers, it has been much less used for estimating effects at the industry level.
14The NBER identified the recession as beginning in December 2007, with the trough occurring in June 2009. Of course, unemployment remained high throughout 2009 and 2010, staying above 9 percent in every month. In comparison, it was below 5.5 percent in every month over 2005-2007.
15 Recall that a state may be entered multiple times in the border-state specification if it borders more than one state. This explains why the sample size increases by more than four-fold in that specification compared with the other CPS specifications. By contrast, in the case of the QCEW analysis, the border- county approach actually reduces the sample size because a large number of counties in the state’s interior are lost in that data. Standard errors in the border-state analysis are calculated allowing for two-way clustering for both the state and the state pair.
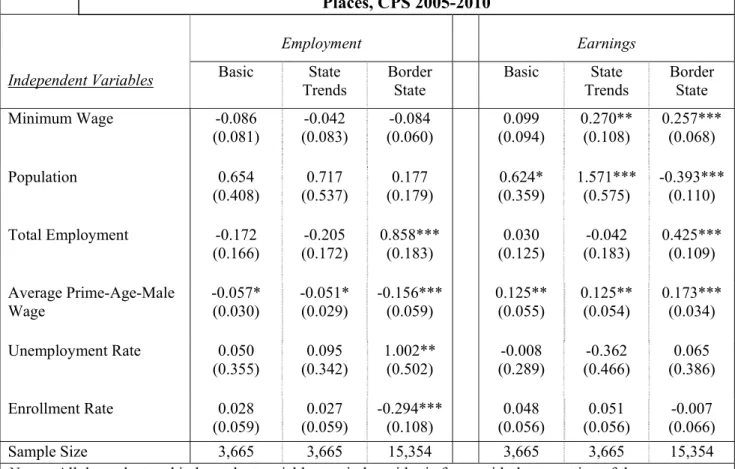
Table 8 reports estimates for employment and earnings equations for the general food services and drinking places sector. As can be seen, in this instance it is necessary to include some kind of state-level trend controls in order to document significant evidence of a minimum wage increase on earnings. The estimated elasticities for earnings from the state-trend specification are somewhat larger than those estimated when using the QCEW data with a similar specification, although the results are not strictly comparable given the difference in earnings definitions.
16On the other hand, the estimated elasticities for employment are now all negative, but in all cases statistically insignificant. The results are comparable across the two surveys when using the county/state trend specifications, but are significantly different when using the border analysis; specifically, the
significantly positive estimate from the QCEW data is not supported with the CPS.
Admittedly, several of the additional covariates are statistically insignificant in the employment equations with the state-trend estimation – one would expect that either population or total employment would be important in that equation, but this is the case only in the border-state estimates. This result may just reflect a decreased precision in those estimates, given the short time frame being examined.
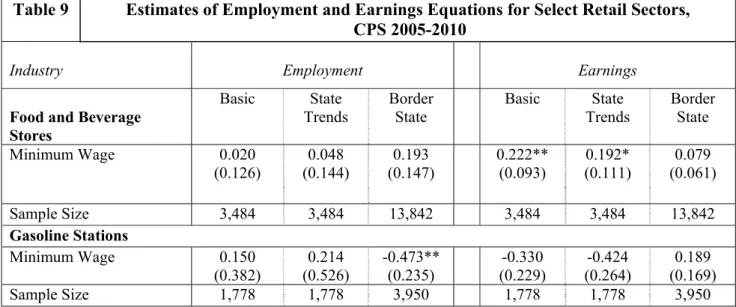
17Although the CPS does not allow us to disaggregate food services and drinking places, we are able to examine the two additional sectors looked at with the QCEW, namely food and beverage stores and gasoline stations. The results are reported in Table 9 and are somewhat disappointing for gasoline stations in that the data do not provide sufficient information to estimate the earnings elasticity in this sector precisely (with two of the coefficient estimates actually negative). On the other hand, the earnings elasticities are positive and statistically significant for food and beverage stores when using either the basic or state-trends specification (although not for the border-state approach). For their part, the estimated employment elasticities are generally statistically insignificant,
16 The CPS definition is an hourly earnings variable, while the QCEW definition is weekly earnings, suggesting that the difference in estimated elasticities could be due to a fall in average hours of work when minimum wages are increased. However, this interpretation is not strongly supported as the difference in coefficient estimates across the CPS and QCEW for the geographic-specific trend specification is not statistically significant.
17 It is also the case that the underlying variables have a non-negligible degree of measurement error, given they are estimated using the CPS, and the use of fixed effects estimation worsens the problems that causes for estimation. The border-state approach does not as effectively control for fixed effects (as discussed above), so measurement error may not be as influential in that specification.
with the one exception of the rather large estimated negative employment elasticity for gasoline stations when using the border-state analysis. Although this particular result does accord with the similar finding from the QCEW data, the lack of evidence of a positive impact of the minimum wage on hourly earnings makes it difficult to understand.
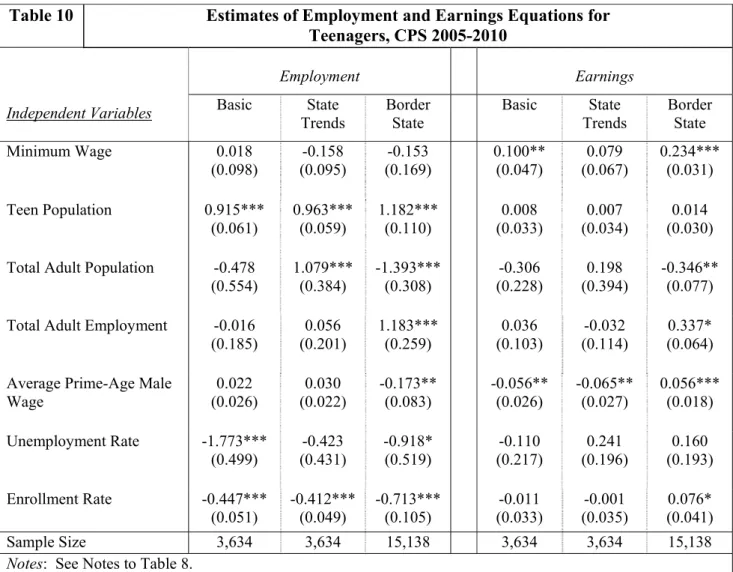
Estimates of minimum-wage impacts on teenagers are given in Table 10, and provide a major point of contact with the wider literature. One peculiar result here is the failure of the state-trend specification to suggest evidence of a positive impact of
minimum wages on earnings over the 2005-2010 interval. Although the minimum-wage point estimates of the basic and state-trend specifications are of similar magnitude, the higher standard error for the state-trend specification leaves the coefficient
insignificant.
18The border-state analysis also provides evidence consistent with this expectation of an increasing impact on earnings. However, none of these specifications provide statistically significant evidence of a negative employment effect.
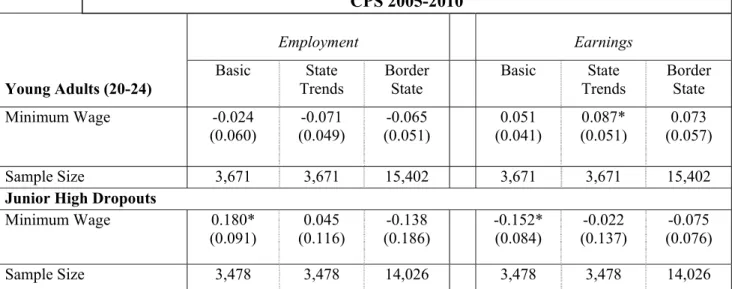
19Table 11 presents similar estimates for young adults aged 20 to 24 years and for junior-high dropouts aged 24 years or more. The state-trend analysis does provide a marginally significant earnings elasticity for young adults, but the other earnings and employment elasticities for this group are insignificant with or without the incorporation of
geographic-specific trends. For junior-high dropouts, the basic specification provides an unexpectedly and marginally significant positive coefficient estimate of the minimum- wage elasticity, coinciding with an equally unexpected negative and marginally significant coefficient estimate in the earnings equation. However, neither of these results survives the incorporation of geographically-diverse trends (using either method).
A few extensions of our basic model were estimated, with results presented for food service and drinking places in Table 12 and for teenagers in Table 13. Previous research has often looked for lagged effects from minimum-wage changes, with mixed
18 Nonetheless, the state-specific trend coefficients are jointly statistically significant, with a p-value less than 0.00001, so the specification that includes these trends is preferred based on this specification test.
19This notably includes the basic specification without state-level trends, a result that may seem at odds with that of Even and Macpherson (2010), who report a statistically significant negative employment elasticity for teenagers using the CPS over a similar time period when using a somewhat similar specification. If we replicate the Evans and Macpherson specification, we too find a negative and marginally significant coefficient estimate. However, this result is no longer significant when we (a) change the national-trend controls from the annual dummies (which they use) to monthly dummies (which we use), or (b) weight by state population. (Results are available from the authors upon request.)
results. One might expect some slow adjustments, especially on the employment side, and lags up to a year are often examined. To avoid expanding the number of parameters to be estimated dramatically, we examine the possibility of lagged effects by using a 13- month moving average of the minimum wage, equally weighting the current and all previous monthly value of the minimum wage within the previous year. As can be seen from the upper panels of Tables 12 and 13, the estimated employment elasticities are all statistically insignificant, although the estimated teenage elasticities in Table 13 are still reasonably large. The evidence for an earnings effect for food services and drinking places using the state trends specification is weakened, perhaps unsurprisingly given that there should be little lagged effect on the earnings side (especially if there is little
employment effect). No such weakening is discernible in the case of the border-state specification.
As a second extension, in the bottom panels of Tables 12 and 13 allow minimum- wage effects to differ over the cycle in the same manner as in Table 7. For food services and drinking places (bottom of Table 12), none of the specifications provide evidence of a difference in employment effects between the 2005-2007 and 2008-2010 periods. For teenage workers (bottom of Table 13), there is evidence of a negative employment effect restricted to the recessionary period, both for the basic specification and for the
specification with state-level trends.
20This accords with the state-trend results for the earnings equation, where there is a statistically significant interaction effect, suggesting the presence of an earnings effect of minimum wage for teenagers but only in the recessionary period. This result makes particular sense if the minimum wage affected considerably more teenagers in low-wage states whose minimum wages were only increased when the federal minimum increases occurred. The border-state results also provide support for a larger earnings effect during the recessionary period, although in this case the employment effects are uniformly statistically insignificant.
An additional robustness consideration involves excluding the enrollment rate from the equations for teens. There may be some concern about the potential simultaneity between teen employment and teen enrollment. Accordingly, excluding the control would
20 One statistical limitation of this result is that we cannot reject that the difference in the coefficients before and after 2007 is zero, nor that that the coefficient in the 2005-2007 interval is zero.
leave the results interpretable as reduced-form effects on employment that may work through changing enrollment as well. Minimum wage coefficient estimates without enrollment controls are reported in the middle panel of Table 13. In comparison to the Table 10 results, the effect of eliminating this control is to increase slightly the absolute magnitude of the estimated employment coefficient when geographic-specific trends are accommodated. Moreover, the coefficient estimate is now marginally significant for the state-trend specification, suggesting an employment elasticity of almost -0.2.
Given the indication that teenagers have suffered some employment loss from increases in the minimum wage (especially during the recessionary period), the
unambiguous absence of any employment impact in the food services and drinking places sector (where much of teenage employment is to be found) could be due to a substitution of labor away from teenagers toward older workers when the minimum wage rises. To examine the evidence in favor of this type of reaction, we estimated specifications in which the log of the number of teens employed in the food services and drinking places sector is the dependent variable, and overall employment in that sector is one of the controls. These results are reported in the last panel of Table 14. Although the estimates are negative once geographic-specific trends are added, they fail to attain statistical significance.
21Clearly, it is difficult to separate out any such substitution possibilities in these data, as the associated standard errors on the relevant estimates are large.
C. Results from the ACS
As noted in section III, our ACS analysis is restricted to measures constructed at the annual level and tackles employment outcomes only. Data considerations also limit the starting date of our analysis to 2006 (and, as with the QCEW, data were not available for 2010 at the time of writing). In all other respects, however, the ACS allows for similar measurements to those taken from the CPS. Although less ideal than the CPS because of these restrictions, the ACS does have the advantage that its larger base sample allows for accurate measurement of the underlying variables. As noted above, it has not been used previously in studies of the minimum wages.
21 We also estimated a specification that allows this substitution effect to be different in the recessionary period, but in this case too the effect was insignificant for the post-2007 period.
As with the CPS, we estimate employment equations using the ACS both for different low-wage sectors and for different low-wage demographic groups. Table 15 presents the sectoral results. Despite the use of annual measures, and a narrower time frame, we have precision of the estimates comparable to that with the CPS. Nevertheless, the minimum-wage coefficient estimates from both the basic and state-trend
specifications are statistically insignificant. On the other hand, there are statistically significant positive employment elasticities with respect to the minimum wage from the border-state estimates, with particularly large values for the food-and-beverage stores sector. But, as also found in Table 8 with the CPS, there is evidence of a strikingly large positive impact of higher unemployment rates on employment in the food-service sector.
For this reason, it is difficult to have much confidence in this approach. The border-state approach again provides a negative, large, and statistically significant employment effect for gasoline stations, a result not supported in the other two specifications. This is also an unexpected result from the border-state comparison. Interestingly, evidence of a negative coefficient for this sector was found in all three data sets using the border-state approach. As noted before, we do not feel confident that the state-border approach fully controls for state effects, and for this specification the minimum-wage coefficient may be reflecting some other difference between states with high- and low-minimum-wage states.
22Finally, results by demographic groups are presented in Table 16. As with the CPS, none of the minimum-wage coefficients for teenagers, young adults, or junior-high dropouts are statistically significant (despite a tendency toward added precision relative to the CPS estimates) using either the basic or state-trend specification.
23The border- state analysis does provide a statistically significant negative minimum-wage elasticity for teenagers, but this coincides with a large positive and statistically significant estimate of the enrollment rate on teen employment, a result that is also difficult to explain.
22 For instance, if we estimate the basic specification completely ignoring all state effects, we find a large and negative minimum-wage coefficient estimate for gasoline station employment, although in this case it is statistically insignificant.
23We also estimated regressions for teenagers without the enrollment controls. Unlike their CPS counterparts, the coefficient estimates changed little and remained insignificant for these alternative specifications. We did not estimate regressions that allow for separate effects during the recessionary years, as the data yield only two observations per state in the post-2007 interval.