Rheinisch-Westfälisches Institut für Wirtschaftsforschung
A Study on labour market transitions using micro-data from the Statistics on Income and Living Conditions (SILC)
Contract No. VC/2013/0020 Final Report – January 2014
Research Project for the European Commission – DG Employment, social aff airs and equal opportunities
Vorstand des RWI Prof. Dr. Christoph M. Schmidt (Präsident)
Prof. Dr. Thomas K. Bauer (Vizepräsident) Prof. Dr. Wim Kösters
Verwaltungsrat
Dr. Eberhard Heinke (Vorsitzender);
Manfred Breuer; Dr. Henning Osthues-Albrecht; Reinhold Schulte (stellv.
Vorsitzende);
Dr. Hans Georg Fabritius; Prof. Dr. Justus Haucap; Hans Jürgen Kerkhoff;
Dr. Thomas Köster; Dr. Thomas A. Lange; Martin Lehmann-Stanislowski;
Hans Martz; Andreas Meyer-Lauber; Hermann Rappen; Reinhard Schulz;
Dr. Michael N. Wappelhorst
Forschungsbeirat
Prof. Michael C. Burda, Ph.D.; Prof. Dr. Lars P. Feld; Prof. Dr. Stefan Felder;
Prof. Nicola Fuchs-Schündeln, Ph.D.; Prof. Timo Goeschl, Ph.D.; Prof. Dr. Justus Haucap; Prof. Dr. Kai Konrad; Prof. Dr. Wolfgang Leininger; Prof. Regina T.
Riphahn, Ph.D.
Ehrenmitglieder des RWI
Heinrich Frommknecht; Prof. Dr. Paul Klemmer †; Dr. Dietmar Kuhnt
RWI Projektbericht
Herausgeber:
Rheinisch-Westfälisches Institut für Wirtschaftsforschung Hohenzollernstraße 1/3, 45128 Essen, Germany
Phone +49 201–81 49-0, Fax +49 201–81 49-200, e-mail: rwi@rwi-essen.de Alle Rechte vorbehalten. Essen 2013
Schriftleitung: Prof. Dr. Christoph M. Schmidt
A Study on labour market transitions using micro-data from the Statistics on Income and Living Conditions (SILC)
Contract No. VC/2013/0020 Final Report – January 2014
Research Project for the European Commission – DG Employment, social affairs and equal opportunities
Rheinisch-Westfälisches Institut für Wirtschaftsforschung
A Study on labour market transitions using micro-data from the Statistics on Income and Living Conditions (SILC)
Contract No. VC/2013/0020 Final Report – January 2014
Research Project for the European Commission – DG Employment, social affairs and equal opportunities
Project Team
Dr. Ronald Bachmann (Leader), Dr. Peggy Bechara (Leader), Anica Kramer, Sylvi Rzepka.
The project team would like to thank Julia Bredtmann, Maria Kleverbeck, Claudia Lohkamp, Oliver Rehbein, Anja Rösner, Sandra Schaffner, Dr. Markus Scheuer, Daniela Schwindt and Tsezarii Zhydetskyi for research assistance and support of the project.
This publication is commissioned by the European Union Programme for Employ- ment and Social Solidarity - PROGRESS (2007-2013).
This programme is implemented by the European Commission. It was established to financially support the implementation of the objectives of the European Union in the employment, social affairs and equal opportunities area, and thereby con- tribute to the achievement of the Europe 2020 Strategy goals in these fields.
The seven-year Programme targets all stakeholders who can help shape the development of appropriate and effective employment and social legislation and policies, across the EU-27, EFTA-EEA and EU candidate and pre-candidate coun- tries.
For more information see: http://ec.europa.eu/progress.
The information contained in this publication does not necessarily reflect the position or opinion of the European Commission.
Executive Summary
This report presents empirical evidence on labour market transitions in the European labour markets using micro data from the Statistics on Income and Living Conditions (SILC) and from the European Union Labour Force Survey (EU‐LFS). The aim of the study is to analyse labour market transitions between labour market states and contract types (temporary and perma‐
nent contracts), and how these have been affected by the recent financial and economic down‐
turn. In doing so, we focus on labour market transitions coming from the labour market states employment (including self‐employment), unemployment and education. Furthermore, we identify similarities and differences between the EU Member States and between demographic groups.
The report starts by giving a short overview of the extent and evolution of the economic and financial crisis. We then summarise the theoretical and empirical literature which is most rele‐
vant for our analyses. Here, the search and matching model of the labour market takes centre stage, both for the theoretical background as well as for the empirical investigation. The empir‐
ical analysis is based on the SILC data set, as well as on the EU‐LFS, which we use for Germany and Romania, as these two countries are not sufficiently covered by SILC. We analyse labour market transitions both descriptively and econometrically, using multinomial logit models.
The results of our study show reduced employment stability (i.e. higher outflows from em‐
ployment) during the recession, and a corresponding increase in employment‐to‐
unemployment transition rates. Furthermore, men are more negatively affected than women by the crisis with respect to employment stability and employment‐to‐unemployment flows. In addition, employment‐to‐unemployment transitions increase significantly more for young workers than for workers belonging to other age groups. For flows out of temporary employ‐
ment, the effects of the business cycle are much larger, and the impact on certain socio‐
demographic groups is much more differentiated. Men are much more affected by the crisis due to a higher increase in the transition probability from temporary employment to unem‐
ployment. Furthermore, the transitions from temporary employment into unemployment in‐
crease most for the youngest workers. In addition, the stepping‐stone function of temporary work is most strongly reduced for high‐skilled compared to any other skill group during the crisis.
With respect to transitions out of self‐employment, we did not find strong effects of the eco‐
nomic crisis. However, there is some evidence that persons who are self‐employed are less likely to make a transition into dependent‐status employment, and more likely to make a tran‐
sition to unemployment, during the crisis.
As for transitions out of unemployment, we see some tendency that formerly unemployed people make a transition into education and inactivity, the latter transition increasing particu‐
larly for women. We also find that the probability to make a transition to employment, espe‐
cially to permanent employment, decreases. For men, the probability to remain unemployed is higher than for women, and they are less likely to get employed again during the economic crisis. Turning to flows out of education, we find that the probability of remaining in education is higher in times of crisis, because apparently individuals delay their entry into the labour mar‐
ket.
In order to investigate the effects of institutions, we investigated how different labour market institutions are correlated with cross‐country differences in reactions to the crisis. In doing so,
we concentrated on transitions from employment to unemployment and vice‐versa. While for employment‐to‐unemployment transitions, we identified the degree of employment protection and union density as institutions likely to influence cross‐country differences, we detected only weak or no correlations of institutions for the unemployment‐to‐employment flows. Further‐
more, we conducted a cluster analysis and performed regressions for a sample of countries selected from the different clusters. This exercise showed that different institutional frame‐
works are likely to have an effect on labour market transitions.
Many of our findings are very relevant from a policy point of view. First, we find strong heter‐
ogeneous effects, with men and young persons being affected most strongly. Second, different forms of employment were affected differently. Temporary employment, in particular, wit‐
nessed strong outflows. At the same time, the stepping‐stone function of temporary employ‐
ment and of self‐employment was greatly reduced.
Résumé
Ce rapport présente des résultats empiriques concernant les transitions sur le marché du tra‐
vail dans les marchés européens du travail calculés à l'aide de micro‐données en se basant sur les statistiques de l’Union Européenne sur le revenu et les conditions de vie (EU‐SILC) et de l'Enquête sur les forces de travail de l'Union européenne (EFT UE). L'objectif de l'étude est de mettre en évidence les transitions entre les états sur le marché du travail des personnes actives et les types de leurs contrats (contrats temporaires et permanents). En outre, cette étude ana‐
lyse l'impact de la récente crise financière et économique sur leurs transitions. Dans cette ana‐
lyse l'observation se concentre surtout sur les transitions en provenance des états suivants:
« employé » (y compris l'auto ‐ emploi ), « au chômage » et « l’éducation ». En plus, l’illustration des similitudes et des différences entre les États Membres de l'UE et entre les groupes démographiques est mis en évidence.
Le rapport commence par donner un bref aperçu de la dimension et de l'évolution de la crise économique et financière. Ensuite, un résumé de la littérature théorique et empirique, qui est à la base de cette étude sera présenté. Sur ce point, les théories de la recherche d'emploi et des appariements occupent une place centrale, aussi bien pour l'arrière‐plan théorique que pour l'enquête empirique. L'analyse empirique est basée sur des données SILC , ainsi que sur l'EFT UE , que nous utilisons pour l'Allemagne et la Roumanie, deux pays qui ne sont pas suffisam‐
ment couverts par SILC . Quant aux méthodes, nous analysons les transitions sur le marché du travail non seulement d’une manière descriptive mais aussi économétrique, en utilisant des modèles logit multinomiaux.
Les résultats de notre étude montrent une stabilité réduite de l'emploi durant la période en considération (c.‐à‐d. – des sorties plus élevées de l'emploi) pendant la récession, et une aug‐
mentation correspondante dans les taux de transition emploi‐ chômage. En considérant la sta‐
bilité de l'emploi et les flux emploi‐chômage, les hommes sont plus affectés que les femmes par la crise. En outre, les transitions emploi‐ chômage augmentent considérablement plus chez les jeunes travailleurs que chez les travailleurs appartenants à d'autres groupes d'âge. Les effets du cycle d'affaires sont beaucoup plus grands pour les flux qui reduisent le nombre des personnes en état de l'emploi temporaire, tandis que l'impact du cycle d’affaire sur certains groupes socio‐
démographique est beaucoup plus nuancé. Les hommes sont beaucoup plus touchés par la crise en raison d'une augmentation plus importante de la probabilité de transition d'un emploi temporaire au chômage. De plus, les transitions de l'emploi temporaire au chômage augmen‐
tent le plus pour les travailleurs les plus jeunes. En outre, la fonction de tremplin du travail temporaire est plus fortement réduite pour les travailleurs hautement qualifiés par rapport à n'importe quel autre groupe de compétences pendant la crise.
En ce qui concerne les transitions en provenance de l'auto‐ emploi, nous n'avons pas trouvé des effets forts de la crise économique. Cependant, en temps de crise, il y a certains éléments de preuve que les personnes auto‐employées sont moins susceptibles de faire une transition vers le statut de l'emploi salarié que de faire une transition vers le chômage.
Comme pour les transitions de sortie du chômage, nous voyons une tendance des anciens chômeurs à faire une transition vers l'éducation ou une formation et aussi vers l'inactivité. La dernière transition mentionnée se manifeste particulièrement parmi les femmes. L'analyse donne aussi comme résultat que la probabilité de faire une transition vers l'emploi, en par‐
ticulier à un emploi permanent, diminue dans la crise. Pour les hommes, la probabilité de rester au chômage est plus élevée que pour les femmes, et les hommes sont moins susceptibles d'ob‐
tenir un emploi en temps d’une crise économique. En ce qui concerne les flux en provenance de l’état de l'éducation, l'analyse démontre aussi que la probabilité de la prolongation de l'édu‐
cation est plus élevée en période de crise, parce que les individus retardent apparemment leur entrée dans le marché du travail.
Afin d'étudier les effets des institutions, l’analyse se concentre sur la question comment les différentes institutions du marché du travail sont en corrélation avec les différences dans les réactions à la crise entre les pays. Ce faisant, nous nous sommes concentrés sur les transitions de l'emploi vers le chômage et vice‐ versa. En ce qui concerne les transitions emploi‐ chômage, nous avons identifié le degré de protection de l'emploi et le taux de syndicalisation comme des institutions susceptibles à influencer les différences des résultats entre pays. En outre, nous n’avons détecté que de faibles ou même aucunes corrélations entre les institutions du marché du travail et le flux du chômage à l'emploi. En outre, nous avons effectué une analyse ty‐
pologique et des régressions pour un échantillon de pays choisis parmi les différents groupes.
Cet exercice a montré que les différents cadres institutionnels sont susceptibles d'avoir un effet sur les transitions sur le marché du travail
Beaucoup de nos résultats sont très pertinents du point de vue de la politique. Nous trouvons, d'abord, des effets hétérogènes signifiants chez les hommes et les adolescents, qui sont les plus touchés par la crise. En outre, les différentes formes d'emploi ont été affectées différemment.
L’emploi temporaire, en particulier, était réduit dans une large mesure, mais la sortie de l'auto‐
emploi accrue, bien que dans une moindre mesure. Au même temps, la fonction tremplin de l'emploi temporaire et de l’auto‐emploi a été grandement réduite.
Zusammenfassung
Dieser Bericht präsentiert empirische Ergebnisse zu Arbeitsmarktübergängen in den europäi‐
schen Arbeitsmärkten mit Mikrodaten aus der Statistik über Einkommen und Lebensbedingun‐
gen (SILC) und aus der EU‐Arbeitskräfteerhebung (EU‐LFS). Das Ziel der Studie ist es, Arbeits‐
marktübergänge zwischen verschiedenen Arbeitsmarktzuständen und Vertragstypen (befristete und unbefristete Verträge) zu analysieren, und zu untersuchen, wie diese von der jüngsten Finanz‐und Wirtschaftskrise betroffen wurden. Dabei konzentrieren wir uns auf Arbeitsmarkt‐
übergänge aus den Arbeitsmarktzuständen Beschäftigung (einschließlich Selbständigkeit), Ar‐
beitslosigkeit und Bildung. Außerdem werden Gemeinsamkeiten und Unterschiede zwischen den EU‐Mitgliedstaaten sowie zwischen den Bevölkerungsgruppen untersucht.
Der Bericht gibt zunächst einen kurzen Überblick über das Ausmaß und die Entwicklung der Wirtschafts‐ und Finanzkrise. Es folgt eine Zusammenfassung der relevanten theoretischen und empirischen Literatur. Hier steht das Search and Matching Modell im Mittelpunkt, sowohl für den theoretischen Hintergrund als auch für die empirische Untersuchung. Die empirische Ana‐
lyse basiert sowohl auf den SILC Daten, als auch auf EU‐LFS, welche für Deutschland und Rumä‐
nien genutzt werden, da diese beiden Länder nicht ausreichend von SILC abgedeckt werden.
Die Arbeitsmarktübergänge werden sowohl deskriptiv als auch ökonometrisch mit Hilfe von multinomialen Logit‐Modellen analysiert.
Die Ergebnisse unserer Studie zeigen eine reduzierte Beschäftigungsstabilität (mehr Übergän‐
ge aus Beschäftigung) in der Rezession, und eine entsprechende Zunahme der Übergänge von der Beschäftigung in die Arbeitslosigkeit. Darüber hinaus sind Männer stärker von der Krise betroffen als Frauen, wenn man die Beschäftigungsstabilität und Übergänge von der Beschäfti‐
gung in die Arbeitslosigkeit betrachtet. Übergänge von Beschäftigung zu Arbeitslosigkeit sind außerdem deutlich häufiger für junge Arbeitnehmer, verglichen mit anderen Altersgruppen.
Für die Übergänge aus der befristeten Beschäftigung sind die Auswirkungen des Konjunk‐
turzyklus viel größer, und die Auswirkungen auf bestimmte sozio‐ demographische Gruppen sind viel differenzierter. Aufgrund eines höheren Anstiegs in der Übergangswahrscheinlichkeit aus temporärer Beschäftigung in Arbeitslosigkeit sind Männer viel stärker von der Krise betrof‐
fen. Außerdem steigen die Übergänge aus befristeter Beschäftigung in Arbeitslosigkeit am meisten für die jüngsten Arbeitnehmer. Darüber hinaus sinkt die Sprungbrettfunktion der be‐
fristeten Beschäftigung während der Krise am stärksten für Hochqualifizierte.
Keine starken Effekte der Wirtschaftskrise lassen sich in Bezug auf die Übergänge aus Selbst‐
ständigkeit finden. Allerdings gibt es einige Hinweise darauf, dass Personen, die selbstständig beschäftigt sind, mit einer geringeren Wahrscheinlichkeit in eine abhängige Beschäftigung wechseln, und mit einer erhöhten Wahrscheinlichkeit in die Arbeitslosigkeit fallen.
Für die Übergänge aus Arbeitslosigkeit kann man eine gewisse Tendenz zu Übergängen in Ausbildung und Inaktivität erkennen, letzteres insbesondere für Frauen. Zweitens finden wir, dass die Wahrscheinlichkeit eines Übergangs in die Beschäftigung, insbesondere in die unbe‐
fristete Beschäftigung sinkt. Für Männer ist die Wahrscheinlichkeit arbeitslos zu bleiben höher als für Frauen, und es ist weniger wahrscheinlich für sie, während der Wirtschaftskrise wieder eingestellt zu werden. In Bezug auf die Übergänge aus Bildung finden wir, dass die Wahrschein‐
lichkeit in der Bildung zu bleiben in Krisenzeiten höher ist, weil die betroffenen Personen of‐
fenbar den Einstieg in den Arbeitsmarkt verzögern.
Um die Auswirkungen von Institutionen zu analysieren, wurde untersucht, wie unterschiedli‐
che Arbeitsmarktinstitutionen mit länderspezifischen Unterschieden der Reaktionen auf die Krise korrelieren. Dabei konzentrierten wir uns auf Übergänge von Beschäftigung in Arbeitslo‐
sigkeit und umgekehrt. Für die Übergänge von Beschäftigung zu Arbeitslosigkeit identifizierten wir den Grad des Kündigungsschutzes und die Gewerkschaftsdichte als signifikante Institutio‐
nen, welche wahrscheinlich Unterschiede zwischen den Ländern erklären können. Allerdings entdeckten wir insgesamt nur schwache oder gar keine Zusammenhänge zwischen Institutio‐
nen und den Übergängen von der Arbeitslosigkeit in die Beschäftigung. Außerdem führten wir eine Clusteranalyse nach Arbeitsmarktinstitutionen durch und untersuchten Arbeitsmarktflüsse für eine Auswahl von Ländern aus den verschiedenen Clustern. Das Ergebnis zeigte, dass die Rahmenbedingungen hinsichtlich der Arbeitsmarktinstitutionen offenbar einen Einfluss auf Arbeitsmarkttransitionen haben.
Viele unserer Ergebnisse sind aus wirtschaftspolitischer Sicht sehr relevant. Erstens haben wir stark heterogene Effekte identifizieren können, bei denen Männern und Jugendliche am stärks‐
ten betroffen wurden. Zweitens wurden verschiedene Formen der Beschäftigung von der Krise unterschiedlich stark betroffen. So gab es insbesondere starke Transitionen aus befristeter Beschäftigung heraus. Außerdem ging die Sprungbrettfunktion befristeter Beschäftigung und selbständiger Beschäftigung stark zurück.
Table of Contents
Executive Summary ... I Résumé ...III Zusammenfassung ... V
1. Introduction ...8
2. Literature Review ... 11
2.1 Introduction: The search and matching model ... 11
2.2 The search and matching model of the labour market ... 11
2.3 Labour market transitions and the business cycle: Theoretical considerations ... 12
2.4 Labour market transitions and institutions: Theoretical considerations ... 15
2.5 Labour market transitions in the Great Recession – Empirical Evidence ... 17
3. Micro Data and Empirical Strategy ... 18
3.1 Micro data... 19
3.1.1 EU‐SILC ... 19
3.1.2 EU‐LFS ... 24
3.1.3 Comparability of data sets ... 27
3.2 Macro data ... 27
3.2.1 Business cycle indicators ... 27
3.2.2 Institutional settings ... 33
3.3 Empirical Strategy ... 39
4. Cluster Analysis ... 44
5. Descriptive Analysis ... 47
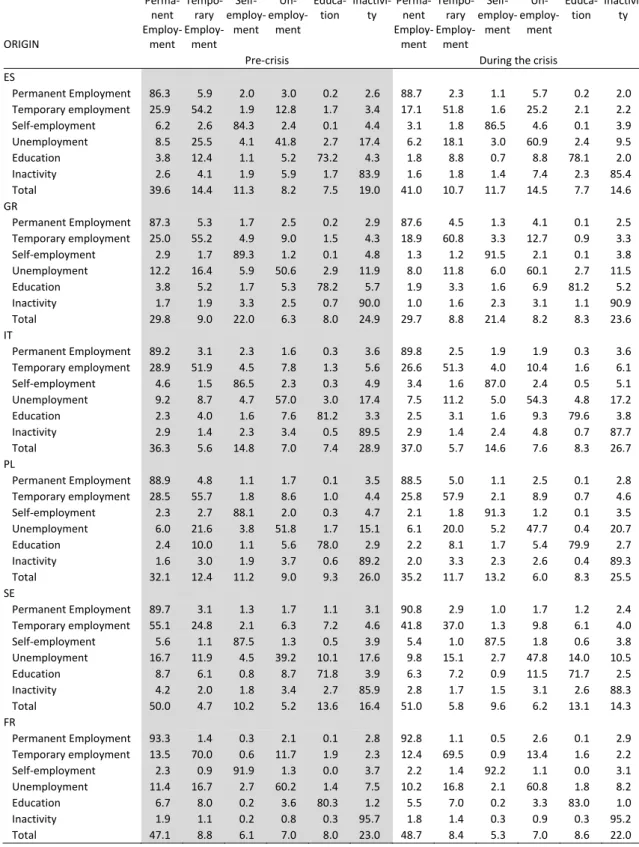
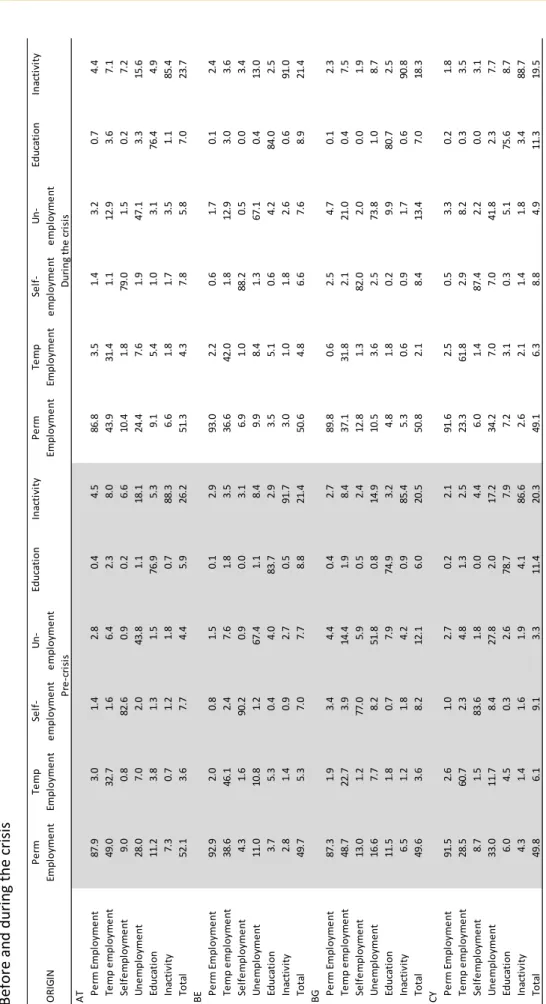
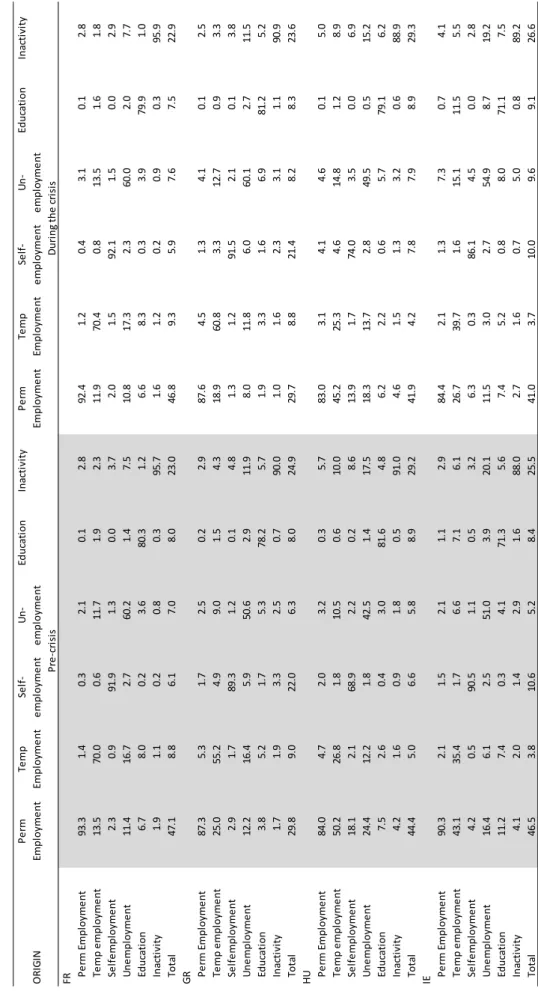
5.1 The European labour markets before the crisis ... 48
5.2 Labour market dynamics before and during the crisis ... 52
5.2.1 Labour market transitions on an aggregate level ... 52
5.2.2 Labour market transitions for different socio‐economic groups ... 55
5.2.3 Labour market transitions for selected countries ... 63
5.3 Comparison of yearly and monthly Markov transition matrices ... 71
6. Econometric Analysis ... 73
6.1 Transitions from employment ... 73
6.1.1 Regression results for transitions from employment ... 73
6.1.2 Regression results for transitions from permanent employment ... 76
6.1.3 Regression results for transitions from temporary employment ... 78
6.2 Regression results for transitions from self‐employment ... 79
6.3 Transitions from unemployment ... 82
6.3.1 Regression results for transitions from unemployment ... 82
6.3.2 Regression results for transitions from unemployment, detailed labour market states ... 85
6.4 Regression results for transitions from education ... 86
6.5 Labour market institutions ... 89
6.5.1 Cross‐country differences and specific labour market institutions ... 89
6.5.2 Cross‐country differences and country clusters ... 99
6.6 Monthly transitions out of unemployment ... 103
7. Summary and policy conclusions ... 104
Appendix 1: Tables and figures ... 108
Appendix 2: Additional indicators of economic and financial activity ... 209
References ... 211
List of Tables, Figures and Boxes
Table 1.1 The economic crisis and GDP development ... 9
Table 3.1 Preferred data set by country ... 20
Table 3.2 Availability of microdata by country, EU‐SILC ... 21
Table 3.3 Description of key variables, EU‐SILC ... 22
Table 3.4 Data availability of key variables, EU‐SILC... 23
Table 3.5 Availability of microdata by country, EU‐LFS ... 25
Table 3.6 Description of key variables, EU‐LFS ... 25
Table 3.7 Data availability of key variables, EU‐LFS ... 26
Table 3.8 Description of country‐level data: business cycle indicators ... 27
Table 3.9 Availability of country‐level data: business cycle indicators ... 29
Table 3.10 Preferred data source to identify the start of the economic crisis ... 32
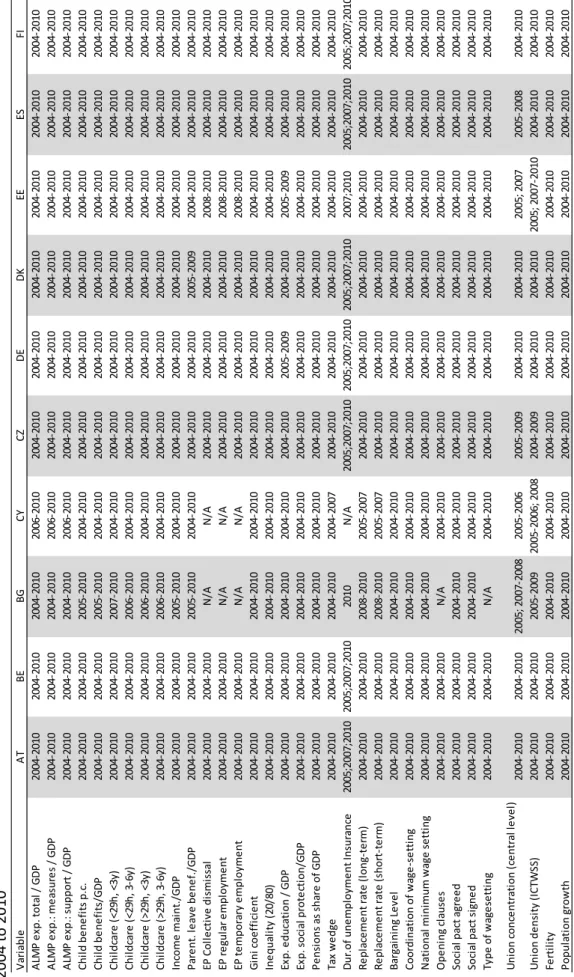
Table 3.11 Description of country‐level data: labour market institutions ... 34
Table 3.12 Availability of country‐level data: labour market institutions ... 36
Table 4.1 Institutional variables used for cluster analysis ... 45
Table 4.2 Clusters with respect to category A variables ... 45
Table 4.3 Clusters with respect to category B variables ... 46
Table 4.4 Clusters with respect to category C variables ... 46
Table 4.5 Clusters with respect to all categories ... 47
Table 5.1 Yearly Markov transition matrix for all countries ... 52
Table 5.2 Yearly Markov transition matrix for all countries, detailed employment states ... 54
Table 5.3 Yearly Markov transition matrix for all countries, by gender ... 56
Table 5.4 Yearly Markov transition matrix for all countries, by age group ... 59
Table 5.5 Yearly Markov transition matrix for all countries, by skill group ... 61
Table 5.6 Yearly Markov transition matrix for selected countries, detailed employment states ... 64
Table A.3.1 References for country‐level data: business cycle indicators ... 108
Table A.3.2 References for country‐level data: labour market institutions ... 109
Table A.5.1 Yearly Markov transition matrix for all countries, different labour market states states ... 111
Table A.5.2 Yearly Markov transition matrix for selected countries, detailed different labour market states states ... 117
Table A.6.1 Yearly transitions from employment to different labour market states, EU‐ SILC ... 124
Table A.6.2 Yearly transitions from employment to different labour market states, EU‐ LFS ... 125
Table A.6.3 Yearly transitions from employment to different labour market states, crisis indicator, EU‐SILC ... 126
Table A.6.4 Yearly transitions from employment to different labour market states, crisis indicator, EU‐LFS ... 126
Table A.6.5 Yearly transitions from employment to different labour market states, heterogeneous effects of the crisis by age groups, EU‐SILC ... 127
Table A.6.6 Yearly transitions from employment to different labour market states, heterogeneous effects of the crisis by age groups, EU‐LFS ... 128
Table A.6.7 Yearly transitions from employment to different labour market states, heterogeneous effects of the crisis by gender, EU‐SILC ... 129
Table A.6.8 Yearly transitions from employment to different labour market states, heterogeneous effects of the crisis by gender, EU‐LFS ... 130
Table A.6.9 Yearly transitions from employment to different labour market states,
heterogeneous effects of the crisis by skill groups, EU‐SILC... 131 Table A.6.10 Yearly transitions from employment to different labour market states,
heterogeneous effects of the crisis by skill groups, EU‐LFS ... 132 Table A.6.11 Yearly transitions from employment to different labour market states,
controlling for GDP growth, entire period, EU‐SILC ... 133 Table A.6.12 Yearly transitions from employment to different labour market states,
controlling for GDP growth, entire period, EU‐LFS ... 134 Table A.6.13 Yearly transitions from employment to different labour market states,
controlling for GDP growth, before the crisis, EU‐SILC ... 135 Table A.6.14 Yearly transitions from employment to different labour market states,
controlling for GDP growth, before the crisis, EU‐LFS ... 136 Table A.6.15 Yearly transitions from employment to different labour market states,
controlling for GDP growth, during the crisis, EU‐SILC ... 137 Table A.6.16 Yearly transitions from employment to different labour market states,
controlling for GDP growth, during the crisis, EU‐LFS ... 138 Table A.6.17 Yearly transitions from permanent employment to different labour market
states, EU‐SILC ... 139 Table A.6.18 Yearly transitions from permanent employment to different labour market
states, crisis indicator, EU‐SILC ... 140 Table A.6.19 Yearly transitions from permanent employment to different labour market
states, heterogeneous effects of the crisis by gender, EU‐SILC ... 141 Table A.6.20 Yearly transitions from permanent employment to different labour market
states, heterogeneous effects of the crisis by age groups, EU‐SILC ... 142 Table A.6.21 Yearly transitions from permanent employment to different labour market
states, heterogeneous effects of the crisis by skill groups, EU‐SILC ... 143 Table A.6.22 Yearly transitions from permanent employment to different labour market
states, controlling for GDP growth, entire period, EU‐SILC ... 144 Table A.6.23 Yearly transitions from permanent employment to different labour market
states, controlling for GDP growth, before the crisis, EU‐SILC ... 145 Table A.6.24 Yearly transitions from permanent employment to different labour market
states, controlling for GDP growth, during the crisis, EU‐SILC ... 146 Table A.6.25 Yearly transitions from temporary employment to different labour market
states, EU‐SILC ... 147 Table A.6.26 Yearly transitions from temporary employment to different labour market
states, crisis indicator, EU‐SILC ... 148 Table A.6.27 Yearly transitions from temporary employment to different labour market
states, heterogeneous effects of the crisis by gender, EU‐SILC ... 149 Table A.6.28 Yearly transitions from temporary employment to different labour market
states, heterogeneous effects of the crisis by age groups, EU‐SILC ... 150 Table A.6.29 Yearly transitions from temporary employment to different labour market
states, heterogeneous effects of the crisis by skill groups, EU‐SILC ... 151 Table A.6.30 Yearly transitions from temporary employment to different labour market
states, controlling for GDP growth, entire period, EU‐SILC ... 152 Table A.6.31 Yearly transitions from temporary employment to different labour market
states, controlling for GDP growth, before the crisis, EU‐SILC ... 153 Table A.6.32 Yearly transitions from temporary employment to different labour market
states, controlling for GDP growth, during the crisis, EU‐SILC ... 154 Table A.6.33 Yearly transitions from selfemployment to different labour market states,
EU‐SILC ... 155
Table A.6.34 Yearly transitions from selfemployment to different labour market states,
EU‐LFS ... 156 Table A.6.35 Yearly transitions from selfemployment to different labour market states,
crisis indicator, EU‐SILC ... 157 Table A.6.36 Yearly transitions from selfemployment to different labour market states,
crisis indicator, EU‐LFS ... 157 Table A.6.37 Yearly transitions from selfemployment to different labour market states,
heterogeneous effects of the crisis by gender, EU‐SILC ... 158 Table A.6.38 Yearly transitions from selfemployment to different labour market states,
heterogeneous effects of the crisis by gender, EU‐LFS ... 159 Table A.6.39 Yearly transitions from selfemployment to different labour market states,
heterogeneous effects of the crisis by age groups, EU‐SILC ... 160 Table A.6.40 Yearly transitions from selfemployment to different labour market states,
heterogeneous effects of the crisis by age groups, EU‐LFS ... 161 Table A.6.41 Yearly transitions from selfemployment to different labour market states,
heterogeneous effects of the crisis by skill groups, EU‐SILC ... 162 Table A.6.42 Yearly transitions from selfemployment to different labour market states,
heterogeneous effects of the crisis by skill groups, EU‐LFS ... 163 Table A.6.43 Yearly transitions from selfemployment to different labour market states,
controlling for GDP growth, entire period, EU‐SILC ... 164 Table A.6.44 Yearly transitions from selfemployment to different labour market states,
controlling for GDP growth, entire period, EU‐LFS ... 165 Table A.6.45 Yearly transitions from selfemployment to different labour market states,
controlling for GDP growth, before the crisis, EU‐SILC ... 166 Table A.6.46 Yearly transitions from selfemployment to different labour market states,
controlling for GDP growth, before the crisis, EU‐LFS ... 167 Table A.6.47 Yearly transitions from selfemployment to different labour market states,
controlling for GDP growth, during the crisis, EU‐SILC ... 168 Table A.6.48 Yearly transitions from selfemployment to different labour market states,
controlling for GDP growth, during the crisis, EU‐LFS ... 169 Table A.6.49 Yearly transitions from unemployment to different labour market states,
EU‐SILC ... 170 Table A.6.50 Yearly transitions from unemployment to different labour market states,
EU‐LFS ... 171 Table A.6.51 Yearly transitions from unemployment to different labour market states,
crisis indicator, EU‐SILC ... 172 Table A.6.52 Yearly transitions from unemployment to different labour market states,
crisis indicator, EU‐LFS ... 173 Table A.6.53 Yearly transitions from unemployment to different labour market states,
heterogeneous effects of the crisis by gender, EU‐SILC ... 174 Table A.6.54 Yearly transitions from unemployment to different labour market states,
heterogeneous effects of the crisis by gender, EU‐LFS ... 175 Table A.6.55 Yearly transitions from unemployment to different labour market states,
heterogeneous effects of the crisis by age groups, EU‐SILC ... 176 Table A.6.56 Yearly transitions from unemployment to different labour market states,
heterogeneous effects of the crisis by age groups, EU‐LFS ... 177 Table A.6.57 Yearly transitions from unemployment to different labour market states,
heterogeneous effects of the crisis by skill groups, EU‐SILC ... 178 Table A.6.58 Yearly transitions from unemployment to different labour market states,
heterogeneous effects of the crisis by skill groups, EU‐LFS ... 179
Table A.6.59 Yearly transitions from unemployment to different labour market states,
controlling for GDP growth, entire period, EU‐SILC ... 180 Table A.6.60 Yearly transitions from unemployment to different labour market states,
controlling for GDP growth, entire period, EU‐LFS ... 181 Table A.6.61 Yearly transitions from unemployment to different labour market states,
controlling for GDP growth, before the crisis, EU‐SILC ... 182 Table A.6.62 Yearly transitions from unemployment to different labour market states,
controlling for GDP growth, before the crisis, EU‐LFS ... 183 Table A.6.63 Yearly transitions from unemployment to different labour market states,
controlling for GDP growth, during the crisis, EU‐SILC ... 184 Table A.6.64 Yearly transitions from unemployment to different labour market states,
controlling for GDP growth, during the crisis, EU‐LFS ... 185 Table A.6.65 Yearly transitions from unemployment to different labour market states
(detailed employment states), EU‐SILC ... 186 Table A.6.66 Yearly transitions from unemployment to different labour market states
(detailed employment states), crisis indicator, EU‐SILC ... 187 Table A.6.67 Yearly transitions from unemployment to different labour market states
(detailed employment states), heterogeneous effects of the crisis by gender, EU‐SILC ... 188 Table A.6.68 Yearly transitions from unemployment to different labour market states
(detailed employment states), heterogeneous effects of the crisis by age
groups, EU‐SILC ... 189 Table A.6.69 Yearly transitions from unemployment to different labour market states
(detailed employment states), heterogeneous effects of the crisis by skill
groups, EU‐SILC ... 190 Table A.6.70 Yearly transitions from unemployment to different labour market states
(detailed employment states), controlling for GDP growth, entire period, EU‐
SILC ... 191 Table A.6.71 Yearly transitions from unemployment to different labour market states
(detailed employment states), controlling for GDP growth, before the crisis,
EU‐SILC ... 192 Table A.6.72 Yearly transitions from unemployment to different labour market states
(detailed employment states), controlling for GDP growth, during the crisis,
EU‐SILC ... 193 Table A.6.73 Yearly transitions from education to different labour market states, EU‐
SILC ... 194 Table A.6.74 Yearly transitions from education to different labour market states, EU‐LFS ... 195 Table A.6.75 Yearly transitions from education to different labour market states, crisis
indicator, EU‐SILC ... 196 Table A.6.76 Yearly transitions from education to different labour market states, crisis
indicator, EU‐LFS ... 197 Table A.6.77 Yearly transitions from education to different labour market states,
controlling for GDP growth, entire period, EU‐SILC ... 198 Table A.6.78 Yearly transitions from education to different labour market states,
controlling for GDP growth, entire period, EU‐LFS ... 199 Table A.6.79 Yearly transitions from education to different labour market states,
controlling for GDP growth, before the crisis, EU‐SILC ... 200 Table A.6.80 Yearly transitions from education to different labour market states,
controlling for GDP growth, before the crisis, EU‐LFS ... 201 Table A.6.81 Yearly transitions from education to different labour market states,
controlling for GDP growth, during the crisis, EU‐SILC ... 202
Table A.6.82 Yearly transitions from education to different labour market states,
controlling for GDP growth, during the crisis, EU‐LFS ... 203
Table A.6.83 Monthly transitions from unemployment to different labour market states, crisis indicator, EU‐SILC ... 204
Table A.6.84 Yearly transitions from employment to different labor market states, controlling for economic and financial activity ... 205
Table A.6.85 Yearly transitions from employment to different labor market states for selected countries, EU‐SILC ... 206
Table A.6.86 Yearly transitions from unemployment to different labor market states for selected countries, EU‐SILC ... 207
Figure 1.1 Unemployment rate over time ... 10
Figure 5.1 Pre‐crisis labour market status for all countries ... 48
Figure 5.2 Pre‐crisis labour market status for selected countries ... 49
Figure 5.3 Labour force participation by age group ... 49
Figure 5.4 Labour force participation by gender ... 50
Figure 5.5 Labour force participation by skill group ... 50
Figure 5.6 Pre‐crisis labour market status by age group... 51
Figure 5.7 Pre‐crisis labour market status by age group... 51
Figure 5.8 Transitions from employment to... ... 53
Figure 5.9 Transitions from permanent employment over time ... 53
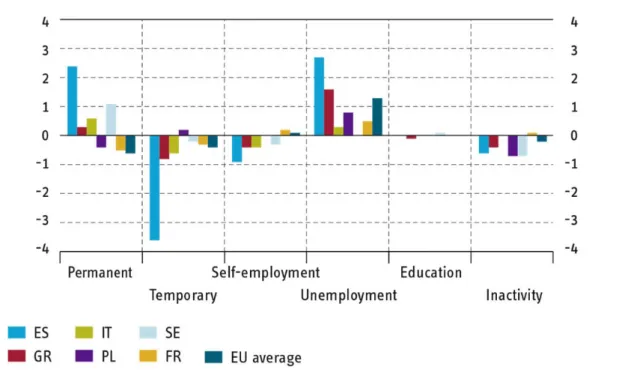
Figure 5.10 Differences in pre‐crisis and during crisis transitions out of employment ... 54
Figure 5.11 Transitions from unemployment to... ... 55
Figure 5.12 Transitions from employment by gender ... 56
Figure 5.13 Transitions from unemployment by gender ... 57
Figure 5.14 Differences in transition rates from employment by gender ... 58
Figure 5.15 Differences in transition rates from unemployment by gender ... 58
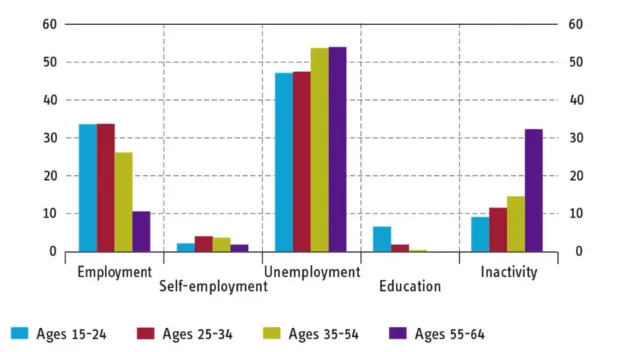
Figure 5.16 Pre‐crisis transition rates from employment by age group ... 59
Figure 5.17 Pre‐crisis transition rates from unemployment to by age group ... 60
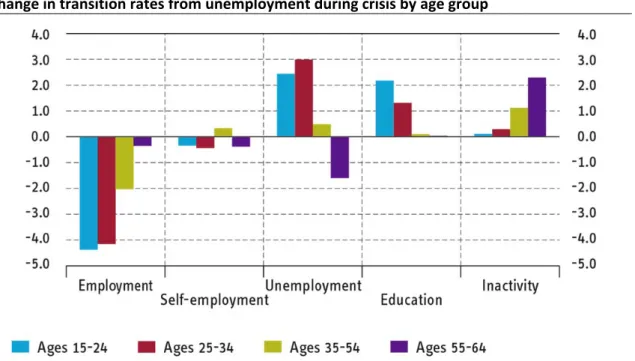
Figure 5.18 Change in transition rates from unemployment during crisis by age group ... 61
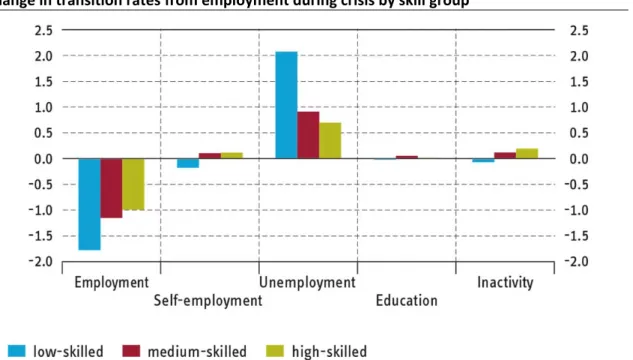
Figure 5.19 Change in transition rates from employment during crisis by skill group ... 62
Figure 5.20 Change in transition rates during crisis from unemployment by skill group ... 63
Figure 5.21 Pre‐crisis transitions from temporary employment to... ... 65
Figure 5.22 Pre‐crisis transitions from permanent employment to... ... 65
Figure 5.23 Pre‐crisis transitions from temporary employment to... ... 66
Figure 5.24 Pre‐crisis: Transitions from unemployment to... ... 66
Figure 5.25 Changes in transitions from permanent employment to… ... 67
Figure 5.26 Changes in transitions from temporary employment to... ... 68
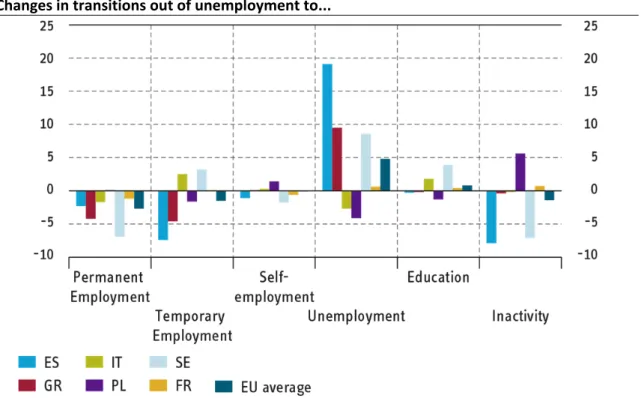
Figure 5.27 Pre‐crisis transitions out of unemployment to… ... 68
Figure 5.28 Changes in transitions out of unemployment to... ... 70
Figure 5.29 Differences in transition rates before/during the crisis from employment to ... ... 71
Figure 5.30 Differences in transition rates before/during the crisis from unemployment to ... ... 72
Figure 6.1 Country fixed effects from employment‐to‐unemployment transitions ... 90
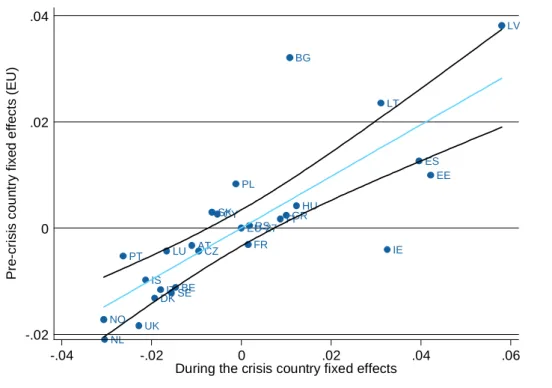
Figure 6.2 Correlation between pre‐crisis and during the crisis country fixed effects from employment‐to‐unemployment transitions ... 91
Figure 6.3 Correlation between employment‐to‐unemployment transition country fixed effects and wage setting coordination ... 92
Figure 6.4 Correlation between employment‐to‐unemployment transition country
fixed effects and union density ... 92
Figure 6.5 Correlation between employment‐to‐unemployment transition country fixed effects and employment protection ... 93
Figure 6.6 Country fixed effects from unemployment‐to‐employment transitions ... 94
Figure 6.7 Correlation between pre‐crisis and during the crisis country fixed effects for unemployment‐to‐employment transitions ... 94
Figure 6.8 Correlation between unemployment‐to‐employment transition country fixed effects and short‐term unemployment benefits ... 95
Figure 6.9 Correlation between unemployment‐to‐employment transition country fixed effects and long‐term unemployment benefits ... 96
Figure 6.10 Correlation between unemployment‐to‐employment transition country fixed effects and short‐term benefit coverage rates ... 97
Figure 6.11 Correlation between unemployment‐to‐employment transition country fixed effects and long‐term benefit coverage rates ... 97
Figure 6.12 Correlation between unemployment‐to‐employment transition country fixed effects and temporary work employment protection ... 98
Figure 6.13 Correlation between unemployment‐to‐employment transition country fixed effects and active labour market policies ... 99
Figure A.6.1 Correlation between pre‐crisis and during the crisis country fixed effects and differences in raw transitions for employment‐to‐unemployment flows .... 206
Figure A.6.1 Correlation between pre‐crisis and during the crisis country fixed effects and differences in raw transitions for unemployment‐to‐employment flows .... 208
Box 3.1 Markov transition chains and Markov matrices ... 39
Box 3.2 Cluster Analysis ... 40
Box 3.3 Logit and Probit model ... 42
Box 3.4 Multinomial logit model ... 42
1. Introduction
The current economic crisis, which started in 2008, lead to high and persistent unemployment rates and diverging developments of European labour markets.1 This phase of economic reces‐
sion has its roots in a financial crisis. The starting point was the U.S. subprime crisis. In 2007, strongly inflated house prices peaked, and the housing bubble burst. Consequently, borrowers could not pay back their loans. This housing market crisis lead to an international financial crisis as debt equity had been resold globally. Financial markets collapsed, with the private invest‐
ment bank Lehman Brothers in September 2008 being one of the most prominent victims.
These developments in the financial markets spread out to the real economy, and a world‐wide phase of economic recession started in the second to third quarter of 2008.
The transmission of the financial crisis to a crisis of the real economy occurred through several channels (IMF 2009). First, the financial crisis significantly reduced the ability of banks to lend (Hempell, Sorensen 2010), which lead to a remarkable decline in business investments. With expectations about the future economic development worsening, the ability to raise money on equity markets also declined. Second, international goods and capital flows decreased to a great extent. Third, for capital flows one can observe that formerly widely spread investments diverted to the most safe and liquid markets, which created problems especially for smaller and more vulnerable countries. Fourth, policy makers faced the problem of finding on the one hand solutions that immediately help to de‐stress financial markets and on the other hand solutions that help to re‐organize the financial architecture in a sustainable way. Finally, consumer sen‐
timent worsened, which lead to a considerable decline in consumption expenditure.
As already indicated, the financial crisis became a crisis of the real economy by mid‐2008. E.g.
in the fourth quarter of 2008, global GDP shrank by about 6.25 per cent. However, world re‐
gions were affected differently by the crisis. European economies first of all faced a decline in demand in their export markets as their trading partners went into recession. Western Europe‐
an countries were hit the most by decreasing trade volumes, reduced business expectations, and decreased expectations of private households about future income and the on‐going finan‐
cial (system) as well as debt problems. Eastern European countries and other countries from the Commonwealth of Independent States (CIS) faced a sharp downturn in external financing, which they heavily rely upon, as well as a strong decline in manufacturing exports (IMF 2009).
Table 1.1 gives an overview of the length and depth of the economic crisis. First, the table in‐
dicates the quarter when the economic crisis started2. Early reactions of GDP to the financial crisis can be seen for e.g. Finland, Sweden and Estonia, where GDP already slowed down in the first quarter of 2008. For the vast majority of countries, the crisis started either in the second quarter – Germany, Hungary, Italy, United Kingdom (UK) – or in the third quarter, namely Bel‐
gium or Slovenia. In Cyprus, Bulgaria and Norway, the crisis started in the first quarter of 2009.
Next, the last quarter of the economic recession is given for every country. One can easily see that an early start of the recession is not automatically connected with an earlier end of the recession. For instance Latvia went into a phase of economic recession in the first quarter of
1 The following information draws on IMF (2009).
2 All computations are done on the basis of the technical definition in order to identify times of booms and recessions, see Section 3.2.1.
2008. This phase ended in the third quarter of 2009. In contrast, in the Netherlands the crisis started in quarter four in 2008 and ended in quarter two in 2009.
Table 1.1
The economic crisis and GDP development
Country Start quarter End quarter Length in quar‐
ter
Deepest decline in GDP growth
Quarter of deepest GDP growth decline
Average GDP growth decline
Malta 2008q4 2009q1 2 ‐3.57 2009q1 ‐2.70
Bulgaria 2009q1 2009q2 2 ‐6.00 2009q2 ‐3.01
Luxembourg 2008q2 2008q4 3 ‐6.41 2008q4 ‐2.65
Belgium 2008q3 2009q1 3 ‐2.10 2009q1 ‐1.44
Czech Republic 2008q4 2009q2 3 ‐3.38 2009q2 ‐1.89
Netherlands 2008q4 2009q2 3 ‐2.08 2009q2 ‐1.58
Germany 2008q2 2009q1 4 ‐4.12 2009q1 ‐1.73
Denmark 2008q3 2009q2 4 ‐2.42 2009q2 ‐2.06
Lithuania 2008q3 2009q2 4 ‐13.35 2009q2 ‐3.97
Slovenia 2008q3 2009q2 4 ‐4.65 2009q2 ‐2.46
Cyprus 2009q1 2009q4 4 ‐1.34 2009q4 ‐0.73
Sweden 2008q1 2009q1 5 ‐3.72 2009q1 ‐1.55
Austria 2008q2 2009q2 5 ‐1.80 2009q2 ‐1.02
France 2008q2 2009q2 5 ‐1.71 2009q2 ‐0.89
Finland 2008q1 2009q2 6 ‐6.35 2009q2 ‐1.79
Italy 2008q2 2009q2 6 ‐3.63 2009q2 ‐1.23
Romania 2008q4 2010q1 6 ‐5.67 2010q1 ‐2.01
Estonia 2008q1 2009q3 7 ‐9.75 2009q3 ‐3.01
Latvia 2008q1 2009q3 7 ‐10.07 2009q3 ‐3.89
Spain 2008q2 2009q4 7 ‐1.70 2009q4 ‐0.72
Hungary 2008q2 2009q3 7 ‐3.36 2009q3 ‐1.24
United Kingdom 2008q2 2009q3 7 ‐2.47 2009q3 ‐1.06
Iceland 2008q4 2010q2 7 ‐5.34 2010q2 ‐2.15
Norway 2009q1 2010q3 8 ‐1.65 2010q3 ‐0.91
Ireland 2008q1 2009q4 9 ‐3.64 2009q4 ‐1.35
Greece 2008q4 2010q4 9 ‐2.80 2010q4 ‐1.39
Average / / 5.27 ‐4.35 / ‐1.86
Notes: GDP data mainly come from Eurostat. Poland and Slovakia are not included as according to the technical definition no clear starting point of the crisis can be identified. See therefore for references and computing explanations Chapter 3.
Therefore, the next column displays the length of the economic recession period in quarters.
Most of the countries have undergone the crisis for 5 to 6 quarters. Countries as Malta (2), Belgium (3) and Slovenia (4) recovered earlier, others as Norway (8) or Greece (9) later. Besides the length of the recession period of the 2008 economic crisis, it is important to have a look at the depth of the crisis. E.g. Lithuania has undergone four quarters of recession, which is below the average of all countries in the table listed, but had to face a decline in GDP growth of more than 13 per cent in the second quarter of 2009. The last row shows the average decline of GDP growth rates during the respective quarters within the economic crisis. Here, for example the British economy moderately contracted by 1.06 per cent for a total period of seven quarters.
The impact of this economic shock on European labour markets was very strong. Between 2008 and 2010, four million persons lost their jobs within the EMU region (ECB 2012). This translates into an increase of the unemployment rate for the country sample we are going use
in our micro‐econometric analysis of almost 3.8 percentage points between 2008 and 2010.
However, this impact varies widely across European countries. Figure 1.1 illustrates the devel‐
opment of the unemployment rates for a sub‐set of countries.
Figure 1.1
Unemployment rate over time
Source: Eurostat, see Chapter 3 for a detailed discussion. – Notes: Annual unemployment rate.
Country sample average includes all countries of the micro‐econometric analysis besides Ice‐
land.
Back in 2004, unemployment rates across Europe differed strongly. For example Poland’s un‐
employment rate was close to 20 per cent, a range of countries clustered between 8 and 12 per cent and the UK had the lowest rate close to 5 per cent. During the next years, national unemployment rates decreased or remained relatively stable. However, this development was interrupted by the 2008 economic crisis, and unemployment rates started to increase, in some countries dramatically so as in the case of Spain. Furthermore, it is important to note that the effects on the labour market are lagging GDP growth. For example, unemployment rates in Sweden rose continuously for some time according to Table 1.1. However, Sweden was out of the recession period already from the first quarter of 2009, and was in recession for a total of five.
Overall, there are several factors that determined the different effects of the economic crisis on European labour markets. First, the crisis differed in length and depth by country. Second, the existing, pre‐crisis macro‐economic conditions of a country are an important channel. For example, a greatly inflated housing market was a pre‐condition for a collapsed of the construc‐
tion sector and increased inflows into unemployment in a number of countries. Third, the la‐
bour market situation before the crisis played an important role. For example, countries with a high share of workers with a temporary contract had to face a significantly higher rise in unem‐
ployment rates. Fourth, labour market institutions differ by country, which can lead to different labour market effects even when the initial decline in GDP is the same.
In this study, we will analyse the effects of the crisis on labour market transitions in Europe.
More specifically, the aim of the study is to fully exploit the richness of the micro data from the
EU‐SILC and the EU‐LFS to examine in detail the labour market transitions between employ‐
ment states and between contract types, and how these transitions have been affected by the recent financial and economic downturn. A specific focus lies on identifying similarities and differences between demographic groups but also between Member States as a reaction to the crisis. Furthermore, non‐standard employment types such as part‐time and/or temporary work are of high interest for this study.
The study is structured as follows. The following chapter contains a review of the relevant lit‐
erature, both from a theoretical and an empirical point of view. Chapter 3 presents the micro data sets and the macro data employed, as well as our empirical strategy. In Chapter 4, we conduct a cluster analysis, which aims at identifying country groups sharing similar institutional features. Chapters 5 and 6 contain the descriptive and econometric analysis of labour market transitions before and during the economic crisis. The final chapter summarises our main re‐
sults, discusses methodological issues and makes corresponding recommendations, and pro‐
vides policy conclusions.
2. Literature Review
2.1 Introduction: The search and matching model
The following literature review gives a selective overview of theoretical studies relating to la‐
bour market transitions. This field of the literature has grown very strongly during the last two decades and is now very large. We therefore focus on the aspects of the literature which are most relevant for our purpose. The model underlying the theoretical discussion is the search and matching model of the labour market. This model is far superior to frictionless models (in particular the neoclassical model of the labour market), which generally focus only on employ‐
ment and/or unemployment stocks, and are thus not able to analyse labour market dynamics.
Explicitly considering labour market dynamics allows for a more careful analysis of the business cycle features of the labour market, as well as of the role of institutions. Many institutional features, such as unemployment benefits and employment protection, affect workers' incen‐
tives with respect to accepting employment and a given wage. The resulting effect on the wage distribution has an impact on firms' hiring decisions. Thus, based on the search and matching model a rich set of channels through which labour market institutions operate can be analysed.
Given the importance of the search and matching model of the labour market, we start with a brief description of this model (Section 2.2). Against this background, Section 2.3 contains an overview of theoretical analyses of the effect of business cycle movements on labour market transitions. The fourth section concludes the theoretical discussion with a review of studies which analyse the impact of labour market institutions on labour market transitions. Looking at empirical studies, we proceed correspondingly, i.e. we give an overview of the empirical evi‐
dence on the effects of the recession on labour market transitions in Europe (Section 2.5). A specific focus in the review of both the empirical and the theoretical studies will be on the cy‐
clical features of labour markets (in particular the impact of the “severe economic recession”), on cross‐country differences, on differences between sub‐groups of the population (e.g. young and/or disadvantaged workers), and on the importance of institutions.
2.2 The search and matching model of the labour market
The search and matching model of the labour market has become the workhorse model for theoretically analysing labour market dynamics, in particular flows between different labour market states (employment, unemployment, out‐of‐the‐labour‐force), different jobs (job‐to‐job
transitions) and different contract types (permanent, temporary). The basic version of this model includes two labour market states, employment and unemployment (see, e.g. Pissarides 2000, and Cahuc, Zylberberg 2004). Unemployed workers look/ search for a job and firms open vacancies in order to find a worker. Because of imperfections in the labour market (e.g. infor‐
mational asymmetries), this takes time and effort and is therefore costly. The two sides of the market are brought together by a matching function which is a modelling device for the trading frictions and informational imperfections in the labour market.3 The matching function deter‐
mines how many meetings are generated from a given number of (unemployed) workers and vacancies during a given time interval. When a worker and a firm meet, they decide on whether it is worthwhile to form a match. If this is the case, they negotiate a wage and the match be‐
comes productive. In the standard case, a reservation wage rule governs the job acceptance decision: if the expected wage is equal to or above a certain threshold – the reservation wage – , the worker accepts the job offer, and rejects it otherwise. Depending on the model specifica‐
tion, job matches are either destroyed exogenously or endogenously. In both cases, the match dissolves and the worker becomes unemployment. In the case of exogenous job destruction, the firm or the worker are not able to influence the job destruction decision; with endogenous job destruction, jobs are destroyed when the productivity4 of a match falls below a certain threshold (the reservation wage), e.g. during an aggregate downturn of economics conditions – this is investigated in more detail in Section 2.3.
Equilibrium in this model prevails when the employment, unemployment, and vacancy levels, as well as the flows between the labour market states, are constant. Furthermore, constant employment and unemployment levels entail an equality of the flows emanating from and go‐
ing to a specific labour market state. For example, this means that the number of workers en‐
tering a new job equals the number of laid‐off workers, and the number of workers entering unemployment equals the number of unemployed individuals finding a job. The equilibrium is therefore determined by the factors affecting flows to and out of employment. Flows to em‐
ployment are governed by the job acceptance decision and by the decision of firms on how many vacancies to open. Flows out of employment are determined by the rate at which jobs get destroyed.
Extended versions of the search and matching model include additional labour market states, such as non‐participation and education, job‐to‐job transitions as well as different contract types, such as permanent and fixed‐term contracts. We discuss these additional features in the next section, with a particular focus on the cyclical features of labour market dynamics.
2.3 Labour market transitions and the business cycle: Theoretical considerations
In order to analyse the effects of business cycle fluctuations in a search and matching model of the labour market, job destruction should be modelled as endogenous. In this case, produc‐
tivity is usually governed by a stochastic process, i.e. it changes over time. The partners to a match (i.e. the employer and the employee) decide whether production is worthwhile every time a productivity shock arrives – e.g. as the economy slides into recession –, and wages are renegotiated if the match continues to exist (Mortensen, Pissarides 1994).
3 See Petrongolo/Pissarides (2001) for an overview of both theory and empirics concerning the matching
function.
4 Note that we use the term “productivity” as shorthand for the value of a match between an employer
and an employee. This value can be affected by either supply‐side factors (e.g. technology) or demand‐
side factors (e.g. aggregate demand).