Program
Tuesday 24.11 d-wave: Phase-sensitive experiment + other evidence Pseudogap phase, Helium superfluidity, Topology
Student Presentation: Ron – Magic angle graphene & SC Wojtek – Room temperature SC Monday 30.11 Guest Lecture: Fabian Natterer
Tuesday 01.12 Guest Lecture: Thomas Greber
Student Presentation: Chuang – Fermi liquids
Haunlong – Quantum Oscillations Monday 07.12 Guest Lecture: Marta Gibert
Tuesday 08.12 Guest Lecture: Marc Janoschek
Student Presentation: Jianfei – Quasi crystals Yoel – Human brain MRI Monday 14.12 Student Presentation: Ugur – SC cubits
Lebin – Majorana Fermions (*) Pascal – ($)
Eder – p-wave superconductivity Tuesday 15.12 Recap + Exam Prep.
($) Resonant Inelastic x-ray scattering Nature Physics 13, 1201 (2017) Nat. Comm. 10, 786 (2019)
(*) Literature should to be defined.
Superconductivity
History of superconductivity
From Wikipedia
d-wave ARPES
NATURE PHYSICS
DOI: 10.1038/NPHYS3009REVIEW ARTICLE
∼1993 a
Intensity (a.u.)
−0.4 −0.2 0.0 0.2
∆k ∼ 0.05 �−1
∆E ∼ 30 meV Bi2212 OD78
20 K 85 K
30
20
10
0
Gap (meV)
90 75
60 45
30 15
0
θ(°)
T = 30 K
∆E ∼ 3 meV
∆k ∼ 0.005 Å−1 Bi2212
OD80
d ∼2010 e
Energy
(π,0) (0,π)
Bi2212 UD92
∼2010
θ(°) 40
30 20 10 0
Gap (meV)
90 75 60 45 30 15 0
Bi2212 OD86
T = 20 K
∆E ∼ 20 meV
∆k ∼ 0.016 Å−1
∼2001 b c
A
B kx
ky
− −
+
+ A
B
Fermi surface
E − EF (eV)
Γ
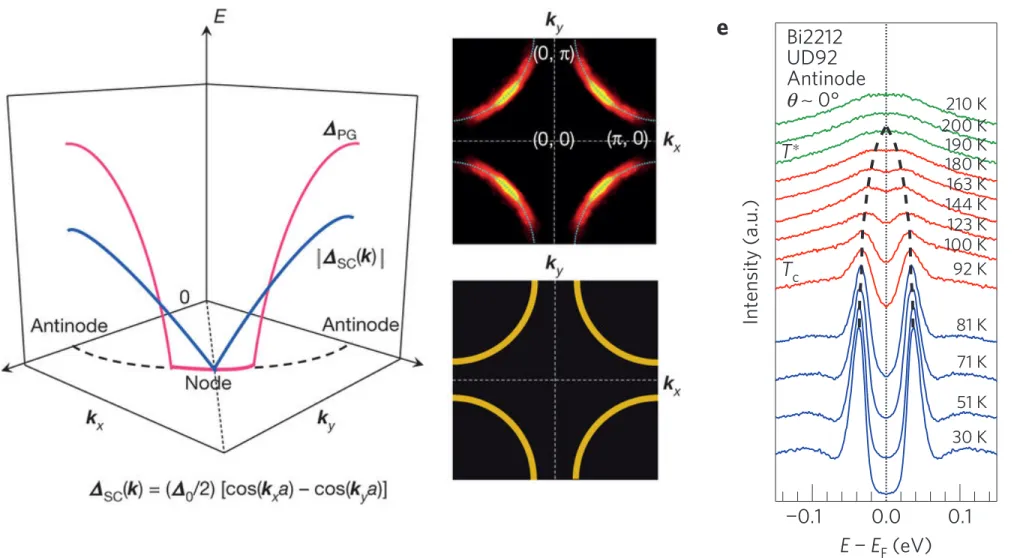
Figure 2|d-wave superconducting gap symmetry in cuprates witnessed by ARPES and the improvement of ARPES data quality.a, Superconducting gap anisotropy first observed in 1993 (reproduced from ref. 6). The lower spectra (A) are taken at the node and the upper spectra (B) at the antinode.
b, Schematic of ad-wave order parameter on a circular Fermi surface. Gap is zero at the node where the superconducting gap changes sign (A) and maximum at the antinode (B).c, Typical synchrotron gap measurement a decade ago as a function of the Fermi angle✓. Error bars indicate uncertainty of determiningEF (±0.5 meV), error from the fitting procedure and an additional 100% margin.d, Near-nodal gaps measured by a modern laser-based ARPES system with superior resolution and high photon flux. Error bars reflect3 error in the fitting procedure and an additional 100% margin.
e, Three-dimensional ARPES data set, showing the quasi-particle dispersions both perpendicular and parallel to the Fermi surface near the node, reproduced from ref. 16.
Pseudogap
The pseudogap at T
c< T < T
⇤also shows a strong momentum anisotropy in the occupied states; thus, ARPES is a powerful experimental tool for investigating this central enigma in the cuprates. In Fig. 3, we show the systematic momentum, temperature and doping dependence of the spectral gaps in Bi2212. As shown in Fig. 3a, at T ⌧ T
cin an underdoped T
c= 92 K Bi2212 sample (denoted as UD92), the ARPES spectra along the Fermi surface show a strong momentum dependence. The EDCs are symmetrized with respect to E
Fto visualize the existence of a gap relative to E
F. The symmetrization removes the Fermi–Dirac cutoff, under the assumption of particle–hole symmetry, which is valid for a superconducting gap at k
Fand convenient for this part of the discussion. Momenta where symmetrized EDCs show a single peak at k
Fare said to be ungapped, and gapped momenta are characterized by a dip at E
Fin the symmetrized EDCs. The magnitude of the gap in the superconducting state was extracted by fitting these EDCs to a phenomenological model of the spectral function
27. The superconducting gap is plotted as a function of Fermi angle ✓ in blue symbols in Fig. 3c and follows a simple d -wave form (blue dashed curve).
We show in Fig. 3b the symmetrized EDCs along the Fermi surface at T > T
c. In an ideal d -wave superconductor, one expects the superconducting gap to retain its d -wave form and to close uniformly at all momenta at ⇠T
c. In contrast to this expectation,
only a portion of the EDCs around the node shows a single peak at E
Fat T > T
cas a signature of a vanishing gap. The EDCs around the antinode still show a gap feature. The gap function above T
cobtained by the same fitting procedure as that for T < T
cis overlaid in Fig. 3c (red dashed line). The pseudogap, an anomalous gap above T
c, shows a strong momentum anisotropy that has some similarity to the d -wave form of the superconducting gap, but with an extended ungapped region around the node, defined as the
‘Fermi arc’, which will be discussed later. In ARPES, the pseudogap temperature T
⇤is defined as the temperature at which the gap at the antinodal k
Fcloses. In Fig. 3e, the temperature dependence of the spectra at the antinode of UD92 is shown as an example where T
⇤⇠ 190 K. The existence of the antinodal gap above T
cwas a surprise, as it is not a simple metallic normal state that forms the basis for BCS theory. As an energy gap has special meaning to a superconductor, the pseudogap is an obstacle which must be first understood.
Nodal–antinodal dichotomy of the gaps
Temperature dependence of the gaps. The key characteristics of the pseudogap and the relationship between the pseudogap and superconductivity have been extensively investigated by systematically studying the gap function for di fferent dopings, temperatures and materials. Because of the completeness of the data set, we mainly discuss in this section the gap function in Bi2212.
NATURE PHYSICS | VOL 10 | JULY 2014 | www.nature.com/naturephysics 485
© 2014 Macmillan Publishers Limited. All rights reserved
NATURE PHYSICS
DOI: 10.1038/NPHYS3009REVIEW ARTICLE
∼1993 a
Intensity (a.u.)
−0.4 −0.2 0.0 0.2
∆k ∼ 0.05 �−1
∆E ∼ 30 meV Bi2212 OD78
20 K 85 K
30
20
10
0
Gap (meV)
90 75 60 45 30 15 0
θ(°)
T = 30 K
∆E ∼ 3 meV
∆k ∼ 0.005 Å−1 Bi2212
OD80
d ∼2010 e
Energy
(π,0) (0,π)
Bi2212 UD92
∼2010 θ(°) 40
30 20 10 0
Gap (meV)
90 75 60 45 30 15 0
Bi2212 OD86
T = 20 K
∆E ∼ 20 meV
∆k ∼ 0.016 Å−1
∼2001 b c
A
B kx
ky
− −
+
+ A
B
Fermi surface
E − EF (eV)
Γ
Figure 2|d-wave superconducting gap symmetry in cuprates witnessed by ARPES and the improvement of ARPES data quality.a, Superconducting gap anisotropy first observed in 1993 (reproduced from ref. 6). The lower spectra (A) are taken at the node and the upper spectra (B) at the antinode.
b, Schematic of ad-wave order parameter on a circular Fermi surface. Gap is zero at the node where the superconducting gap changes sign (A) and maximum at the antinode (B).c, Typical synchrotron gap measurement a decade ago as a function of the Fermi angle✓. Error bars indicate uncertainty of determiningEF(±0.5 meV), error from the fitting procedure and an additional 100% margin.d, Near-nodal gaps measured by a modern laser-based ARPES system with superior resolution and high photon flux. Error bars reflect3 error in the fitting procedure and an additional 100% margin.
e, Three-dimensional ARPES data set, showing the quasi-particle dispersions both perpendicular and parallel to the Fermi surface near the node, reproduced from ref. 16.
Pseudogap
The pseudogap at Tc <T <T⇤ also shows a strong momentum anisotropy in the occupied states; thus, ARPES is a powerful experimental tool for investigating this central enigma in the cuprates. In Fig. 3, we show the systematic momentum, temperature and doping dependence of the spectral gaps in Bi2212. As shown in Fig. 3a, at T ⌧Tc in an underdoped Tc=92 K Bi2212 sample (denoted as UD92), the ARPES spectra along the Fermi surface show a strong momentum dependence. The EDCs are symmetrized with respect to EF to visualize the existence of a gap relative to EF. The symmetrization removes the Fermi–Dirac cutoff, under the assumption of particle–hole symmetry, which is valid for a superconducting gap at kF and convenient for this part of the discussion. Momenta where symmetrized EDCs show a single peak at kF are said to be ungapped, and gapped momenta are characterized by a dip at EF in the symmetrized EDCs. The magnitude of the gap in the superconducting state was extracted by fitting these EDCs to a phenomenological model of the spectral function27. The superconducting gap is plotted as a function of Fermi angle✓ in blue symbols in Fig. 3c and follows a simpled-wave form (blue dashed curve).
We show in Fig. 3b the symmetrized EDCs along the Fermi surface at T >Tc. In an ideal d-wave superconductor, one expects the superconducting gap to retain its d-wave form and to close uniformly at all momenta at ⇠Tc. In contrast to this expectation,
only a portion of the EDCs around the node shows a single peak at EF at T >Tc as a signature of a vanishing gap. The EDCs around the antinode still show a gap feature. The gap function above Tc
obtained by the same fitting procedure as that forT<Tc is overlaid in Fig. 3c (red dashed line). The pseudogap, an anomalous gap above Tc, shows a strong momentum anisotropy that has some similarity to thed-wave form of the superconducting gap, but with an extended ungapped region around the node, defined as the
‘Fermi arc’, which will be discussed later. In ARPES, the pseudogap temperature T⇤ is defined as the temperature at which the gap at the antinodal kF closes. In Fig. 3e, the temperature dependence of the spectra at the antinode of UD92 is shown as an example whereT⇤⇠190 K. The existence of the antinodal gap aboveTc was a surprise, as it is not a simple metallic normal state that forms the basis for BCS theory. As an energy gap has special meaning to a superconductor, the pseudogap is an obstacle which must be first understood.
Nodal–antinodal dichotomy of the gaps
Temperature dependence of the gaps. The key characteristics of the pseudogap and the relationship between the pseudogap and superconductivity have been extensively investigated by systematically studying the gap function for different dopings, temperatures and materials. Because of the completeness of the data set, we mainly discuss in this section the gap function in Bi2212.
NATURE PHYSICS | VOL 10 | JULY 2014 |www.nature.com/naturephysics 485
© 2014 Macmillan Publishers Limited. All rights reserved
k-dependent superconducting gap
d-wave symmetry
http://www.nature.com/articles/nphys3009
Copper-oxide superconductors
REVIEW ARTICLE NATURE PHYSICS DOI: 10.1038/NPHYS3009
c
k
xk
y(0,π)
(π,0) (π,π)
θ Node
Antinode
b 1.0
0.5 0.0
−0.5 E − E
F(eV)
(0,0) (π,0) (π,π) (0,0)
Antinode
Temperature
Hole concentration p AFI
Pseudogap
Superconducting Normal state
0 Optimal
doping
Underdoped Overdoped
a
Cu
2+O
2−Node
Γ
Figure 1 | High-T
ccuprate superconductors. a, Schematic phase diagram. The inset shows the crystal structure of the CuO
2planes, which are of central relevance to superconductivity and the pseudogap. b, Schematic band dispersion in reciprocal space for cuprates along the high-symmetry cuts, as shown in blue in c. c, Fermi surface, where the nodal and antinodal momenta and the Fermi angle ✓ are defined.
high T
cand should provide clues of how even higher T
cvalues can be achieved.
In this article, we show how ARPES has contributed to the understanding of the cuprates. We first introduce the superconducting gap and the pseudogap in the ARPES spectra, and move on to show the systematic doping and temperature dependence of the gap functions in momentum space, and present its interpretation. Finally, in discussing phase competition between the pseudogap and superconductivity, we pay special attention to recent results
12–14in understanding the pseudogap due to some order (the pseudogap order) distinct from superconductivity, which may be consistent with various symmetry breakings in the pseudogap state observed by different experimental techniques.
We show evidence for a phase transition into a pseudogap phase at T
⇤having broken electronic symmetry that is distinct from superconductivity. Well below T
c, we discuss how the pseudogap order is intertwined and entangled with superconductivity, which suggests multiple phenomenologically distinct ground states with non-trivial phase boundaries within the superconducting dome.
These results provide us with deeper insights into the cuprate phase diagram, renewing the foundation for further study towards the complete understanding of the high-T
cmechanism.
Angle-resolved photoemission spectroscopy (ARPES)
ARPES has been a leading tool to study gap anisotropies discussed in this article because it directly measures the occupied part of the single-particle spectral function
15with ever increasing energy and momentum resolution. The cuprates are well-suited for the ARPES technique because of their quasi-2D electronic structure. The Bi
2Sr
2CaCu
2O
8+(Bi2212) and Bi
2Sr
2 xLa
xCuO
6+(Bi2201) families in particular feature pristine cleaved surfaces that protect the low-energy bulk electronic structure, owing to the weak van der Waals forces between the two Bi–O planes. Over the past two decades, experiments have improved tremendously (Fig. 2a,c,d), allowing more precise information about electronic structure, including the gap functions, to be obtained (Fig. 2e). One recent development is the use of narrow-bandwidth ultraviolet lasers as light sources for photoemission
14,16–23. The superior resolution of laser ARPES provides unprecedented access to the lowest energy excitations near the node, as shown in Fig. 2d,e. Furthermore, traditional synchrotron-based ARPES
continues to be improved with brighter synchrotrons and more powerful spectrometers. Synchrotron-based experiments have the advantage of covering a larger region of momentum space with photon energy flexibility. When one combines modern synchrotron and laser-based ARPES experiments, one can gain deep insights into the nature of energy gaps, as reviewed in this article.
Superconducting gap
In conventional BCS superconductors, an energy gap
SCopens below T
cwith s-wave symmetry and minimal momentum dependence. 2
SCis the energy required to break each of the Cooper pairs of electrons, which form the superconducting condensate. In contrast, the superconducting gap in the cuprates is characterized by a strong momentum dependence. Early debates came to the conclusion that the superconducting gap function is consistent with an order parameter having d
x2 y2symmetry, with support from ARPES (ref. 6), penetration depth
24, Raman
25and phase-sensitive measurements
26. The d -wave symmetry of the superconducting gap has become an accepted fact when one constructs theories and interprets experimental results.
On the Fermi surface (Fig. 1c), the gap is the largest at the antinode—Fermi momentum (k
F) on the Brillouin zone boundary near ( ⇡ , 0), where the Fermi angle ✓ = 0 . The gap size gradually decreases towards the node along the Fermi surface and becomes zero at the node—k
Fin the CuO bond diagonal direction ( ✓ = 45 ).
The superconducting gap changes sign across the node (Fig. 2b).
We note that the terminology ‘node’ and ‘antinode’ is still used above T
cto refer to those particular regions of the Fermi surface.
An ARPES study on Bi2212 by Shen and colleagues
6was one of the key experiments that clarified the superconducting order parameter in the cuprates. This study compared energy distribution curves (EDCs) at two characteristic momenta, the node and the antinode, above and below T
cto show the anisotropy of the gap. At the antinode, the opening of a gap below T
cwas detected as a leading edge shift of the EDC to higher binding energy and the emergence of a sharp quasi-particle peak at
sc⇠ 30 meV (upper EDCs in Fig. 2a).
In contrast, the spectrum at the node does not show a shift in the leading edge gap across T
cand the sharpening of the spectrum at low temperature is predominantly of thermal origin (lower EDCs in Fig. 2a).
484 NATURE PHYSICS | VOL 10 | JULY 2014 | www.nature.com/naturephysics
© 2014 Macmillan Publishers Limited. All rights reserved
ht tp s: // www .q uo ra .c om /W ha t-is -a -d -wa ve -su pe rc on du ct or -vs -an -s -wa ve -su pe rc on du ct or
Su pe rc on du ct in g ga p sy m m et ry
17.11.2020 Page 7
Type-II superconductors
Measuring conductance spectra of superconducting materials
J. E. Hoffman, “A Search for Alternative Electronic Order in the High Temperature Superconductor Bi2Sr2CaCu2O8+δby Scanning Tunneling Microscopy” (2003)
➢ According to BCS theory the DOS in a conventional SC is gapped at the Fermi surface
→ constant gap for s-wave SC
→ angle-dependent gap for d-wave SC (non- uniform zero-magnetic field order parameter)
Maggio-Aprile, Ivan, et al. "Direct vortex lattice imaging and tunneling spectroscopy of flux lines on YBa2Cu3O7-δ."
Physical Review Letters 75.14 (1995): 2754.