arXiv:1107.0553v2 [hep-ex] 22 Nov 2011
Observation of D → K η and Search for CP Violation in D → π η Decays
E. Won,21 B. R. Ko,21 I. Adachi,9 H. Aihara,51 K. Arinstein,1 D. M. Asner,38T. Aushev,16 A. M. Bakich,45 E. Barberio,27 A. Bay,23 V. Bhardwaj,39 B. Bhuyan,11 M. Bischofberger,29 A. Bondar,1 A. Bozek,33
M. Braˇcko,25, 17 J. Brodzicka,33 T. E. Browder,8 P. Chang,32 A. Chen,30 P. Chen,32 B. G. Cheon,7 K. Chilikin,16 I.-S. Cho,56 K. Cho,20 S.-K. Choi,6 Y. Choi,44 J. Dalseno,26, 47 M. Danilov,16 Z. Doleˇzal,2 Z. Dr´asal,2A. Drutskoy,16 S. Eidelman,1 J. E. Fast,38 V. Gaur,46N. Gabyshev,1 A. Garmash,1 Y. M. Goh,7
B. Golob,24, 17 J. Haba,9 T. Hara,9 K. Hayasaka,28 H. Hayashii,29Y. Horii,50 Y. Hoshi,49 W.-S. Hou,32 Y. B. Hsiung,32 H. J. Hyun,22 T. Iijima,28 K. Inami,28 A. Ishikawa,50 R. Itoh,9 M. Iwabuchi,56 Y. Iwasaki,9
T. Iwashita,29 N. J. Joshi,46 T. Julius,27 J. H. Kang,56 N. Katayama,9 T. Kawasaki,35H. Kichimi,9 H. J. Kim,22 H. O. Kim,22 J. B. Kim,21 J. H. Kim,20 K. T. Kim,21M. J. Kim,22 S. K. Kim,43 Y. J. Kim,20
K. Kinoshita,3 N. Kobayashi,40, 52 S. Koblitz,26 P. Kodyˇs,2 S. Korpar,25, 17 P. Kriˇzan,24, 17 T. Kumita,53 A. Kuzmin,1 Y.-J. Kwon,56J. S. Lange,4 M. J. Lee,43S.-H. Lee,21 J. Li,43 Y. Li,55 J. Libby,12 C.-L. Lim,56 C. Liu,42Y. Liu,32 D. Liventsev,16R. Louvot,23S. McOnie,45K. Miyabayashi,29 H. Miyata,35Y. Miyazaki,28
R. Mizuk,16 G. B. Mohanty,46 Y. Nagasaka,10E. Nakano,37 M. Nakao,9 H. Nakazawa,30Z. Natkaniec,33 S. Neubauer,19 S. Nishida,9 K. Nishimura,8 O. Nitoh,54 S. Ogawa,48T. Ohshima,28 S. Okuno,18 S. L. Olsen,43, 8
Y. Onuki,50 P. Pakhlov,16G. Pakhlova,16 H. Park,22H. K. Park,22 K. S. Park,44R. Pestotnik,17M. Petriˇc,17 L. E. Piilonen,55 M. R¨ohrken,19 S. Ryu,43 H. Sahoo,8 K. Sakai,9 Y. Sakai,9 T. Sanuki,50 O. Schneider,23 C. Schwanda,14 A. J. Schwartz,3 K. Senyo,28 O. Seon,28 M. E. Sevior,27C. P. Shen,28 T.-A. Shibata,40, 52 J.-G. Shiu,32 F. Simon,26, 47 J. B. Singh,39 P. Smerkol,17Y.-S. Sohn,56A. Sokolov,15 E. Solovieva,16S. Staniˇc,36
M. Stariˇc,17 M. Sumihama,40, 5 T. Sumiyoshi,53 S. Suzuki,41 G. Tatishvili,38 Y. Teramoto,37 K. Trabelsi,9 M. Uchida,40, 52 S. Uehara,9T. Uglov,16 Y. Unno,7S. Uno,9 Y. Usov,1 S. E. Vahsen,8 G. Varner,8 A. Vinokurova,1
C. H. Wang,31M.-Z. Wang,32 P. Wang,13 M. Watanabe,35 Y. Watanabe,18 K. M. Williams,55 B. D. Yabsley,45 Y. Yamashita,34 M. Yamauchi,9Z. P. Zhang,42 V. Zhilich,1 V. Zhulanov,1 A. Zupanc,19 and O. Zyukova1
(The Belle Collaboration)
1Budker Institute of Nuclear Physics SB RAS and Novosibirsk State University, Novosibirsk 630090
2Faculty of Mathematics and Physics, Charles University, Prague
3University of Cincinnati, Cincinnati, Ohio 45221
4Justus-Liebig-Universit¨at Gießen, Gießen
5Gifu University, Gifu
6Gyeongsang National University, Chinju
7Hanyang University, Seoul
8University of Hawaii, Honolulu, Hawaii 96822
9High Energy Accelerator Research Organization (KEK), Tsukuba
10Hiroshima Institute of Technology, Hiroshima
11Indian Institute of Technology Guwahati, Guwahati
12Indian Institute of Technology Madras, Madras
13Institute of High Energy Physics, Chinese Academy of Sciences, Beijing
14Institute of High Energy Physics, Vienna
15Institute of High Energy Physics, Protvino
16Institute for Theoretical and Experimental Physics, Moscow
17J. Stefan Institute, Ljubljana
18Kanagawa University, Yokohama
19Institut f¨ur Experimentelle Kernphysik, Karlsruher Institut f¨ur Technologie, Karlsruhe
20Korea Institute of Science and Technology Information, Daejeon
21Korea University, Seoul
22Kyungpook National University, Taegu
23Ecole Polytechnique F´ed´erale de Lausanne (EPFL), Lausanne´
24Faculty of Mathematics and Physics, University of Ljubljana, Ljubljana
25University of Maribor, Maribor
26Max-Planck-Institut f¨ur Physik, M¨unchen
27University of Melbourne, School of Physics, Victoria 3010
28Nagoya University, Nagoya
29Nara Women’s University, Nara
30National Central University, Chung-li
31National United University, Miao Li
32Department of Physics, National Taiwan University, Taipei
33H. Niewodniczanski Institute of Nuclear Physics, Krakow
34Nippon Dental University, Niigata
35Niigata University, Niigata
36University of Nova Gorica, Nova Gorica
37Osaka City University, Osaka
38Pacific Northwest National Laboratory, Richland, Washington 99352
39Panjab University, Chandigarh
40Research Center for Nuclear Physics, Osaka
41Saga University, Saga
42University of Science and Technology of China, Hefei
43Seoul National University, Seoul
44Sungkyunkwan University, Suwon
45School of Physics, University of Sydney, NSW 2006
46Tata Institute of Fundamental Research, Mumbai
47Excellence Cluster Universe, Technische Universit¨at M¨unchen, Garching
48Toho University, Funabashi
49Tohoku Gakuin University, Tagajo
50Tohoku University, Sendai
51Department of Physics, University of Tokyo, Tokyo
52Tokyo Institute of Technology, Tokyo
53Tokyo Metropolitan University, Tokyo
54Tokyo University of Agriculture and Technology, Tokyo
55CNP, Virginia Polytechnic Institute and State University, Blacksburg, Virginia 24061
56Yonsei University, Seoul
We report the first observation of the doubly Cabibbo-suppressed decaysD+ →K+η(′) using a 791 fb−1 data sample collected with the Belle detector at the KEKB asymmetric-energye+e−col- lider. The ratio of the branching fractions of doubly Cabibbo-suppressed relative to singly Cabibbo- suppressedD+→π+η(′) decays areB(D+ →K+η)/B(D+ →π+η) = (3.06±0.43±0.14)% and B(D+ →K+η′)/B(D+ →π+η′) = (3.77 ±0.39 ±0.10)%. From these, we find that the relative final-state phase difference between the tree and annihilation amplitudes inD+ decays,δT A, is (72
±9)◦or (288±9)◦. We also report the most precise measurements ofCP asymmetries to date:
ADCP+→π+η = (+1.74±1.13±0.19)% andADCP+→π+η′ = (−0.12±1.12±0.17)%.
PACS numbers: 11.30.Hv, 11.30.Er, 13.25.Ft, 14.40.Lb
Decays of charmed mesons play an important role in understanding the sources of SU(3) flavor symme- try breaking structure [1, 2] and can also be sensi- tive probes of the violation of the combined charge- conjugation and parity symmetries (CP) produced by the irreducible complex phase in the Cabibbo-Kobayashi- Maskawa flavor-mixing matrix [3] in the standard model (SM). This SU(3) flavor symmetry structure is not well studied in D+ meson decays into two-body final states with an η(′), since they are all Cabibbo-suppressed de- cays. Examples of two-body decays with an η(′) in the final state are the doubly Cabibbo-suppressed (DCS) de- cays D+ → K+η(′) and the singly Cabibbo-suppressed (SCS) decays D+ → π+η(′). The DCS decays D+ → K+η(′) have not yet been observed. The observation of such modes is not only intrinsically important to illu- minate the meson decay process but also there is gen- eral interest in the experimental technique of measuring an extremely rare decay processes with neutral particles.
Observation ofD+→K+η(′)would complete the picture
of DCS decays forD+ mesons decaying to pairs of light pseudoscalar mesons.
In this Letter, we report the first observation ofD+→ K+η(′) decays. The DCS decaysD+→K+η(′)together withD+ → K+π0 can be used to measure the relative phase difference between the tree and annihilation am- plitudes (δT A), which is an important piece of informa- tion relevant to final-state interactions in D meson de- cays. Note that experimentally one is able to determine only the tree and annihilation amplitudes and the relative phase difference between them since all decays involving K0 will be overwhelmed by Cabibbo-favored decays in- volving a ¯K0, with no way to distinguish between them because one detects only aKS0 [4]. In addition, the most sensitive search forCP violation inD+ →π+η(′)decays is reported. Observation ofCP violation inD+→π+η(′) decays with current experimental sensitivity would rep- resent strong evidence for processes involving physics be- yond the SM [5].
The data used in this analysis were recorded at or near
the Υ(4S) resonance with the Belle detector [6] at the e+e−asymmetric-energy collider KEKB [7]. The sample corresponds to an integrated luminosity of 791 fb−1.
We apply the same charged track selection criteria that were used in Ref. [8]. Charged kaons and pions are identified by requiring the ratio of particle identifi- cation (PID) likelihoods [8] to be greater or less than 0.6, respectively. For kaons (pions) used in this analy- sis, the efficiencies and misidentification probabilities are approximately 87% (88%) and 9% (10%), respectively.
For the reconstruction of theη meson in theD+→h+η decay, where h+ refers to either π+ or K+, we use the η→π+π−π0mode instead of the frequently usedη→γγ (ηγγ) mode since our event selection will include stringent requirements on the vertex formed from charged tracks in theη decay. We find that theη→γγ mode has a small signal to background ratio and poorηinvariant mass res- olution that prohibit the final signal extraction from our data. To reconstruct theη′ meson inD+→h+η′ decay, we use theη′ →π+π−ηγγ decay. The minimum energy of theγfrom theπ0orηis chosen to be 60 MeV for the bar- rel and 100 MeV for the forward region of the calorime- ter [9]. The decay vertex of theD+ is formed by fitting the three charged tracks (h+π+π−) to a common ver- tex and requiring a confidence level (C.L.) greater than 0.1%. For π0 reconstruction in D+ → h+η, we require the invariant mass of theγγ pair to be within [0.12,0.15]
GeV/c2 and for the η we require the invariant mass of the π+π−π0 system to be within [0.538,0.558] GeV/c2. In the D+ → h+η′ mode, to reconstruct the daughter ηγγ, we require the invariant mass of theγγ pair to be within [0.50,0.58] GeV/c2. Furthermore, in order to re- move a significant π0 contribution under the ηγγ signal peak, we reject γ candidates as described in Ref. [10].
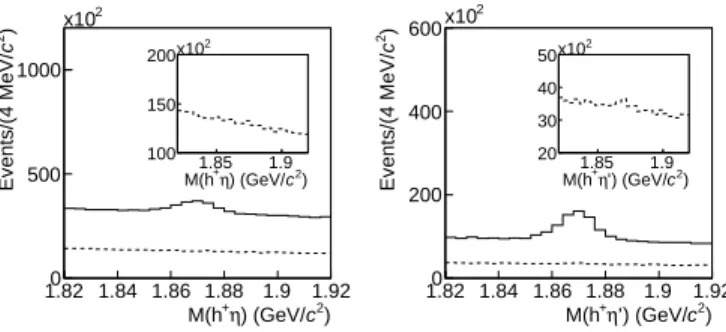
Theπ+π−ηγγ invariant mass is required to be within the range [0.945,0.970] GeV/c2. The momenta of photons from the π0 and the ηγγ combination are recalculated with π0 and η mass [11] constraints, respectively. The invariant mass distributions of the h+η(′) system after the initial selection described above are shown in Fig. 1 where there is little indication of signal for either of the DCS modes.
In order to search forD+→K+η(′)decays, the follow- ing four variables are considered. The first is the angle (ξ) between the charmed meson momentum vector, as reconstructed from the daughter particles, and the vec- tor joining its production and decay vertices [12]. The second variable is the isolation χ2 (χ2iso) normalized by the number of degrees of freedom (d.o.f) for the hypoth- esis that the candidate tracks forming the charmed me- son arise from the primary vertex, where the primary vertex is the most probable point of intersection of the charmed meson momentum vector and the e+e− inter- action region [12]. Because of the finite lifetime of D+ mesons their daughter tracks are not likely to be compat- ible with the primary vertex. The third and the fourth
2) c ) (GeV/
η M(h+
1.82 1.84 1.86 1.88 1.9 1.92 )2cEvents/(4 MeV/
0 500 1000
x102
2) c ) (GeV/
+η M(h1.85 1.9 100
150 200x102
2) c
’) (GeV/
η M(h+
1.82 1.84 1.86 1.88 1.9 1.92 )2cEvents/(4 MeV/
0 200 400 600
x102
2) c
’) (GeV/
+η M(h1.85 1.9 20
30 40 50x102
FIG. 1: The invariant mass distributions of h+η (h+η′) in the left (right) plot after the initial selection. The solid histograms show π+η(′) while the dashed histograms show K+η(′) final states. The two inset histograms areK+η(′) de- cays with enlarged vertical scales.
variables are the momentum of theη(′)(pη(′)) in the lab- oratory system, and the momentum of the D+ in the center-of-mass system (p∗D+). To optimize the selection, we maximizeǫsig/√
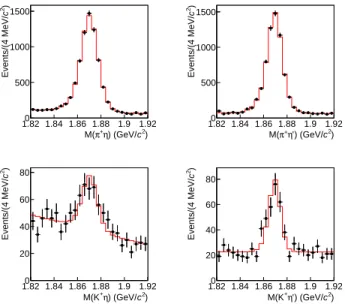
NB whereǫsigandNB are the signal efficiency and the background yield in the invariant mass distribution ofD+ candidates. A uniform grid of 10,000 points in four dimensions spanned by the four kinematic variables described above is used to select an optimal set of selection requirements using Monte Carlo (MC) sim- ulation samples [13]. Since we use MC samples, this is similar to the importance-sampled grid search technique in Ref. [14]. The optimal selection for theD+ →K+η mode is found to be: ξ < 5◦, χ2iso > 10,pη >1 GeV/c, andp∗D+ >3 GeV/c, and for D+ →K+η′ is : ξ < 5◦, χ2iso > 5, pη′ > 1.5 GeV/c, and p∗D+ > 3 GeV/c. The same selection criteria are applied to the normalization modes, D+ → π+η(′). Figure 2 shows the π+η(′) and K+η(′) invariant mass distributions after the final selec- tions used for the branching fraction measurements. Pos- sible structures, for example fromDs+→K+π−π+π0 or D+s → K+K−π+π0 due to particle misidentification or cross-feed betweenη and η′ are studied using MC sam- ples; we find no indication of such background.
A fit is then performed for D+ → π+η(′) candidates and the results are shown as the top two plots in Fig. 2.
The signal probability density function (PDF) is mod- eled as the sum of a Gaussian and a bifurcated Gaussian while the combinatorial background is modeled as a lin- ear background. Theχ2/d.o.f of fits are 0.7 and 1.4, re- spectively. For fits to these DCS decays, we fix the width of the Gaussian, the two widths of the bifurcated Gaus- sian, and then ratio of the normalizations of the Gaussian and the bifurcated Gaussian to the values obtained from the fits to the SCS modes in order to obtain stable fits.
The fixed widths are scaled according to the difference of widths observed in the signal MC samples. We ex- amine possible systematic uncertainties due to this later.
The statistical significance of the signal based on the log-
TABLE I: Yields from the data and the signal efficiencies for the branching fraction measurements. Errors are statistical only.
Mode yield Signal Efficiency (%)
D+→K+η 166± 23 1.35±0.01 D+→K+η′ 180± 19 1.20±0.01 D+→π+η 6476±110 1.68±0.02 D+→π+η′ 6023± 93 1.59±0.01
likelihood ratio is 9σand more than 10σ(σrepresents one standard deviation from the background-only hypothe- sis) for D+ →K+η and D+ →K+η′, respectively; the corresponding invariant mass distributions and fits are shown in the lower panel of Fig. 2. The χ2/d.o.f of fits to the K+η and K+η′ final states are 0.8 and 0.9, respectively. In order to compute the ratio of branch- ing fractions of DCS modes with respect to SCS modes, the signal efficiencies for the selection criteria described above are estimated with our signal MC samples. Table I lists all the information used for the branching fraction measurements.
2) c ) (GeV/
η π+
M(
1.82 1.84 1.86 1.88 1.9 1.92 )2cEvents/(4 MeV/
0 500 1000 1500
2) c
’) (GeV/
η π+
M(
1.82 1.84 1.86 1.88 1.9 1.92 )2cEvents/(4 MeV/
0 500 1000 1500
2) c ) (GeV/
η M(K+
1.82 1.84 1.86 1.88 1.9 1.92 )2cEvents/(4 MeV/
0 20 40 60 80
2) c
’) (GeV/
η M(K+
1.82 1.84 1.86 1.88 1.9 1.92 )2cEvents/(4 MeV/
0 20 40 60 80
FIG. 2: The invariant mass distributions used for the branch- ing fraction measurements. The top two plots are for theπ+η (left) andπ+η′(right) final states while the bottom two plots are for theK+η (left) andK+η′ (right) final states. Points with error bars and histograms correspond to the data and the fit, respectively.
The dominant sources of the systematic uncertainty in the branching fraction measurements are the uncertain- ties of the parameters that are fixed in the fits to DCS decays, and are estimated to be 3.4% (2.1%) for theη(η′) mode. These uncertainties are determined by refitting the data with the fit parameters varied by one standard deviation. Other sources include the choice of the fitting
functions, estimated to be 2.7% (1.0%) for the η (η′) mode, and the uncertainty in the PID, estimated to be 1.1% for the both modes. A summary of the systematic uncertainties for the ratio of branching fraction measure- ments can be found in Table II. The ratios of branching fractions areB(D+ → K+η)/B(D+ →π+η) = (3.06 ± 0.43± 0.14)% and B(D+ → K+η′)/B(D+ → π+η′) = (3.77 ± 0.39 ± 0.10)%. We use the measurements of the SCS modes from Ref. [15] to calculate the absolute branching fractions. Table III shows the comparison of our branching fractions with the best present limits from Ref. [15]. While the measured branching fraction for the K+η mode is in agreement with the SU(3) based expec- tations [1, 2], the K+η′ mode is measured to be larger, by approximately three standard deviations.
TABLE II: Summary of all relative systematic uncertainties for the measurements of ratios of branching fractions.
Source σB(D+→K+η) B(D+→π+η)
(%) σB(D+→K+η′) B(D+→π+η′)
(%)
PID 1.1 1.1
Signal PDF 3.4 2.1
Fit method 2.7 1.0
Total 4.5 2.6
Using the relations in Ref. [4], which give
|T|2 = 3|A(K+η)|2
|A|2 = 1 2
"
|A(K+π0)|2+|A(K+η′)|2
#
− |A(K+η)|2
cosδT A = 1 2|T||A|
"
2|A(K+η)|2+1
2|A(K+η′)|2
− 3
2|A(K+π0)|2
#
(1) whereT (A) is the tree (annihilation) amplitude andA is the specified decay amplitude, and from the recent branching fraction measurement of B(D+ → K+π0) = (1.72±0.20)×10−4[15], we find that the relative final- state phase difference between the tree and annihilation inD+ decays,δT A, is (72±9)◦ or (288±9)◦.
TABLE III: Comparison of our branching fraction results to the present best upper limit (90% C.L.) from Ref. [15]. The first and second uncertainties are statistical and systematic, respectively.
Measurement Belle Ref. [15]
B(D+→K+η) (1.08±0.17±0.08)×10−4 <1.3×10⁻⁴ B(D+→K+η′) (1.76±0.22±0.12)×10−4 <1.9×10⁻⁴
For ourACP measurement in theD+→π+η(′)modes, we re-optimize our selection by maximizingNS/σSwhere σS is the statistical error on the signal yieldNS in the
simulated sample. The re-optimized requirements for D+→π+ηdecays are: ξ <5◦,χ2iso>5,pη>1.0 GeV/c, andp∗D+ >2.5 GeV/c, and for D+→π+η′ are: ξ <5◦, χ2iso>2,pη′>1.0 GeV/c, andp∗D+>2.5 GeV/c, respec- tively. These requirements are slightly less stringent than the selection criteria used for the branching fraction mea- surements of DCS modes. This improves the statistical sensitivity onACP by around 15%.
We determine the quantitiesADCP+→π+η(′) [16] by mea- suring the asymmetry in signal yield
ADrec+→π+η(′) ≡ NrecD+→π+η(′)−NrecD−→π−η(′) NrecD+→π+η(′)+NrecD−→π−η(′)
∼= ADCP+→π+η(′) +ADF B++Aπǫ+, (2) whereNrec is the number of reconstructed decays. Note that we neglect the terms involving the product of asym- metries and the approximation is valid for small asym- metries. The measured asymmetry in Eq. (2) includes two contributions other than ACP. One is the forward- backward asymmetry (ADF B+) due to γ∗ −Z0 interfer- ence in e+e− → c¯c and the other is the detection ef- ficiency asymmetry between positively and negatively charged pions (Aπǫ+). To correct for the asymmetries other than ACP, we use a sample of Cabibbo-favored Ds+ → φπ+ decays, in which the expected CP asym- metry from the SM is negligible. Assuming that AF B
is the same for all charmed mesons, the difference be- tween ADrec+→π+η(′) and ADrec+s→φπ+ yields the CP viola- tion asymmetry ADCP+→π+η(′). We reconstructφ mesons via the K+K− decay channel, requiring the K+K− in- variant mass to be between 1.01 and 1.03 GeV/c2. This is the same technique as the one developed in Ref. [17].
In order to obtain ACP, we subtract the measured asymmetry forD+s →φπ+ from that forD+→π+η(′)in three-dimensional (3D) bins, where the 3D bins are the transverse momentum, plabT π, and the polar angle of the π+ in the laboratory system, cosθπlab, and the charmed meson polar angle in the center-of-mass system, cosθ∗D+
(s)
. Simultaneous fits to theD(s)+ andD−(s)invariant mass dis- tributions for each bin are carried out. A double Gaus- sian for the signal and a linear function for the back- ground are used as PDFs for Ds+ →φπ+. The average value over all bins is found to be ADrec+s→φπ+= (0.17 ± 0.13)%. After the subtraction ofADrec+s→φπ+ component, weighted averages of the ACP values summed over the 3D bins are (+1.74± 1.14)% and (−0.12± 1.13)% for D+→π+η andD+→π+η′, respectively, where the un- certainties originate from the finite size of theD+ →π+η (1.13%),D+ → π+η′ (1.12%), andD+s →φπ+ (0.13%) samples. The χ2/d.o.f values summed over the 3D bins are 28.7/11=2.6 for D+ → π+η and 15.7/11=1.4 for D+→π+η′.
The dominant source of systematic uncertainty in the
ACPmeasurement is the uncertainty in theADrecs+→φπ+de- termination, which originates from the following sources:
the statistics of the D+s → φπ+ sample (0.13%), pos- sible detection asymmetry of kaons from φ → K+K− (0.05%) [18] and the choice of binning for the 3D map (0.12%, 0.01%), forD+→π+ηandD+→π+η′, respec- tively. Another source is the fitting of the invariant mass distribution (fit interval, choice of the fitting function), which contributes uncertainties of 0.05% to ADCP+→π+η, and 0.07% toADCP+→π+η′. Possible systematic uncertain- ties due to the fixed signal PDF parameters are estimated to be 0.01% forADCP+→π+η and 0.07% forADCP+→π+η′. By combining all sources in quadrature, we obtainADCP+→π+η
= (+1.74 ±1.13± 0.19)% andADCP+→π+η′ = (−0.12 ± 1.12±0.17)%. These are the most precise measurements ofADCP+→π+η(′) to date.
In conclusion, we report the first observation of DCS D+ →K+η(′) decays using a 791 fb−1 data sample col- lected with the Belle detector at the KEKB asymmetric- energy e+e− collider. The ratios of branching frac- tions of DCS modes with respect to the SCS modes are B(D+→K+η)/B(D+ →π+η) = (3.06±0.43±0.14)%
andB(D+ →K+η′)/B(D+ → π+η′) = (3.77 ±0.39 ± 0.10)%. Using our DCS branching fractions and that of D0→K+π0from Ref. [15], the first measurement of the relative phase difference between the tree and annihila- tion amplitudes in D+ decays is reported with δT A = (72±9)◦ or (288±9)◦using the technique suggested in Ref. [4]; this is important information relevant to final- state interactions. We also search forCP asymmetries in SCS modes down to theO(%) level.
We thank the KEKB group for excellent operation of the accelerator, the KEK cryogenics group for effi- cient solenoid operations, and the KEK computer group and the NII for valuable computing and SINET4 net- work support. We acknowledge support from MEXT, JSPS and Nagoya’s TLPRC (Japan); ARC and DIISR (Australia); NSFC (China); MSMT (Czechia); DST (In- dia); MEST, NRF, NSDC of KISTI, and WCU (Korea);
MNiSW (Poland); MES and RFAAE (Russia); ARRS (Slovenia); SNSF (Switzerland); NSC and MOE (Tai- wan); and DOE (USA). E. Won acknowledges support by NRF Grant No. 2011-0027652 and B. R. Ko acknowl- edges support by NRF Grant No. 2011-0025750.
[1] B. Bhattacharya and J. L. Rosner, Phys. Rev. D 81, 014026 (2010).
[2] H-Y. Cheng and C.-W. Chiang, Phys. Rev. D81, 074021 (2010);
[3] M. Kobayashi and T. Maskawa, Prog. Theor. Phys.49, 652 (1973).
[4] C.-W. Chiang and J. L. Rosner, Phys. Rev. D65, 054007
(2002).
[5] Y. Grossman, A. L. Kagan, and Y. Nir, Phys. Rev. D75, 036008 (2007).
[6] A. Abashian et al. (Belle Collaboration), Nucl. Instr.
Meth. A479, 117 (2002).
[7] S. Kurokawa and E. Kikutani, Nucl. Instrum. Methods Phys. Res., Sect. A499, 1 (2003).
[8] E. Won et al. (Belle Collaboration), Phys. Rev. D 80, 111101(R) (2009).
[9] H. Ikedaet al., Nucl. Instrum. Methods Phys. Res., Sect.
A441, 401 (2000).
[10] B. R. Ko et al. (Belle Collaboration), Phys. Rev. Lett.
106, 211801 (2011).
[11] K. Nakamuraet al.(Particle Data Group), J. of Phys. G 37, 075021 (2010).
[12] B. R. Ko et al. (Belle Collaboration), Phys. Rev. Lett.
102, 221802 (2009).
[13] D. J. Lange, Nucl. Instrum. Methods Phys. Res., Sect.
A462, 152 (2001); R. Brunet al. GEANT 3.21, CERN Report DD/EE/84-1, 1984.
[14] E. Won, Ph. D. thesis, University of Rochester, 2000; H.
Prosperet al., in Proceedings of the 1995 Computing in High Energy Physics Conference, Rio de Janeiro, 1995 (World Scientific Publishing Co., River Edge, 1995).
[15] H. Mendezet al. (CLEO Collaboration), Phys. Rev. D 81, 052013 (2010).
[16] ADCP+→π+η(′) is defined as Γ(DΓ(D++→π→π++ηη((′)′)))+Γ(D−Γ(D−−→π→π−−ηη((′)′))). [17] B. R. Ko et al. (Belle Collaboration), Phys. Rev. Lett.
104, 181602 (2010).
[18] M. Stariˇc et al. (Belle Collaboration), arXiv:1110.0694[hep-ex].