Systems
Robert Jackermeier and Bernd Ludwig
Abstract The performance of indoor positioning systems is usually measured by their accuracy in meters. This facilitates the comparison of different systems, but does not necessarily give information about how well they perform in real-life sce- narios, e. g. during indoor navigation of walking persons. In this paper, we present a task-oriented evaluation that adapts the idea of landmark navigation: Instead of specifying the error metrically, system performance is measured by the ability to determine the correct segment of an indoor route, which in turn enables the navi- gation system to give correct instructions. We introduce the area match metric in order to identify areas where positioning proves problematic. In order to evaluate the described metric, we use a pedestrian dead reckoning approach to compute in- door positions. Without any external correction, the correct segment of the test route is identified in 88.4% of all trials. Based on these results, we explore options how to identify and predict erroneous situations during the navigation process as well as beforehand.
1 Introduction and Motivation
Indoor positioning for pedestrian navigation is still an open problem as no position- ing system that delivers absolute – such as GPS – coordinates is available. Many solutions providing precise (sub meter) localization require additional technical de- vices [5, 16, 18]. However, they are not at disposal in everyday life situations at which pedestrian navigation systems target.
Robert Jackermeier
University Regensburg, Chair for Information Science, Universit¨atsstraße 31, D-93053 Regensburge-mail: robert.jackermeier@ur.de
Bernd Ludwig
University Regensburg, Chair for Information Science, Universit¨atsstraße 31, D-93053 Regensburge-mail: bernd.ludwig@ur.de
1
Technically simpler solutions use sensors that come with every smartphone, such as accelerometers, gyroscopes, and step counters [1, 24]. Such approaches provide relative positioning data, and often suffer from cold start problems [6]. Solutions based on GSM, LTE, and WiFi receivers can compute absolute coordinates of an area in which a user is located, but fail in tracking a user’s movement precisely [25].
Independently from the used sensor technology, the approaches described above have in common that they do not take spatial knowledge into account which we understand to describe the ways persons can take in an indoor area: information about the user’s current position limits the options for a position update. While — as Waqar et al [25] point out — such technology can advantageously be used to imple- ment the described solutions quickly at any location (that eventually provides GSM, LTE or WiFi infrastructure), its major drawback is that these positioning algorithms do not provide effective means for error cancellation in terms of the navigation task a person is currently solving.
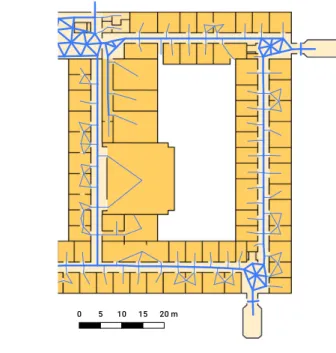
Fig. 1 Indoor navigation graph in the test area. Main edges used for localization are shown as thick lines. Notice the mesh-like topology in larger open areas.
0 5 10 15 20 m
We address exactly this issue. We describe an approach that models spatial knowledge with an indoor navigation graph (see Fig. 1 as an example) that con- tains all routing decisions and path segments between any two arbitrary locations in an indoor/outdoor environment requesting a decision from the user how to execute a system’s routing instruction. We apply our indoor navigation graphs to cancel the positioning error of relative positioning algorithms (e.g. step counters) that accumu- lates while a person is navigated. A similar approach is taken by Link et al [12].
In contrast to our approach the authors rely on OpenStreetMap data that are much
more complex to handle and therefore less flexible for adapting a system to a new
environment where there doesn’t already exist a corresponding model. Further, the authors use the OpenStreetMap data for a metric evaluation of the approach, while we relate success to navigation instructions: we consider positioning to be success- ful if it allows a navigation system to give the correct next instruction relative to the users position on the route, or, more generally, if it allows a location based service relying on it to function properly.
For rendering this definition operational, we introduce the area match score as a new metric for indoor positioning. We analyze the performance of an algorithm we implemented on the basis of this definition. From results of the analysis we derive effective criteria for an automatic decision when the computed position estimate data is no longer reliable. In such cases, dead reckoning approaches cannot recover the error. We conclude that effective positioning algorithms for pedestrian naviga- tion must be able to apply different techniques for sensing the user’s environment in order to provide optimal position estimates.
In this paper, we first report the relevant state of the art, then we explain how we relate landmark-based navigation and indoor positioning and develop our math- ematical model for the posed problem. Next, we present an empirical evaluation for a navigation task that required test persons to continuously walk on an indoor route on one of the floors of a complex and therefore cognitively demanding building on the campus of our university. Finally, we discuss the obtained results in the light of our task-based performance metric. We analyze limitations of the approach and derive relevant issues of future work from the insights obtained from the evaluation.
2 State of the Art in Indoor Positioning
As already stated in the introduction, many localization techniques based on differ- ent types of sensors have been proposed for pedestrian indoor navigation systems and indoor positioning in a broader sense. Despite all these research efforts, there is still no technology established as a widely accepted state of the art similarly to GPS for outdoor areas.
As our work is focused on positioning algorithms that do not need sensors beyond those available in a smartphone anyway, the following review of the state of the art leaves aside more exotic approaches that require special sensors or hardware.
WiFi-based indoor localization can be widely deployed in modern buildings
where a sufficient WiFi infrastructure is usually available, but suffers from multiple
problems, as Davidson and Pich´e [3] point out: Creation and maintenance of radio
maps is time consuming and therefore expensive. A low scan rate on current smart-
phones leads to disjointed position estimates. Furthermore, device heterogeneity, the
smartphones orientation, and the attenuation of signals by humans are identified as
disadvantages. Due to these issues, WiFi-based systems generally achieve an accu-
racy of at most a few meters and are suited to determine the approximate position,
but not for continuous tracking.
0 2.5 5 7.5 10 m
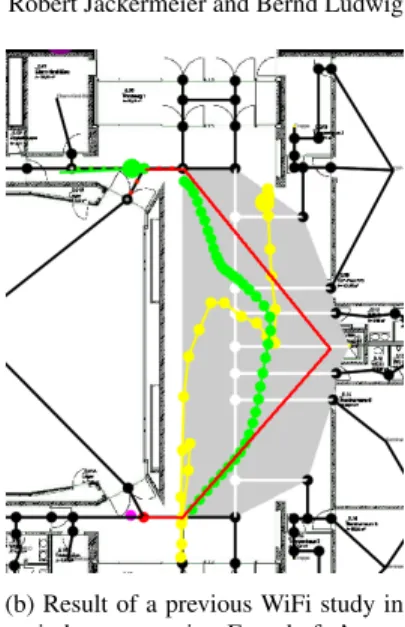
(a) Result of a previous WiFi study in an indoor area using Fraunhofer’s awiloc. While standing still at the po- sitions indicated in red, the reported locations (colored dots) are scattered around the area with a root mean square error between 2.1 and 5.0 m.
(b) Result of a previous WiFi study in an indoor area using Fraunhofer’s aw- iloc. The position reported by awiloc (yellow) follows the ground truth (red, from bottom to top) very loosely, if at all. Only by fusing step detection data with a Kalman filter (green) the actual trajectory can be approximated.
Fig. 2: Performance of WiFi signals in indoor positioning tasks
Our own findings confirm these claims: Figure 2a shows some of the results from an earlier study, where the location reported by Fraunhofer’s WiFi-based awiloc system
1wanders around in an indoor area even if the test person is not moving.
Nevertheless, the RMSE of the position reaches up to 5 meters. Even more problems arise when the test person is moving (an example can be seen in Fig. 2b), where the location updates usually are lagging behind and do not match the path that was actually taken.
On the other hand, Bluetooth Low Energy (BLE) beacons as another wireless localization technique are designed to be more accurate, but are far less widespread and therefore more expensive to deploy. In particular, as they are mounted at fixed positions and send signals over a small distance only, persons could be tracked con- tinuously only if beacons were mounted along all paths persons can walk on.
A recent development for getting an rough estimate of the user’s position bases on sending a sound signal via the smartphone’s loudspeaker and recording it imme- diately with the microphone. Rooms have particular acoustic characteristics that can be recognized to identify in which room out of a set of trained rooms the smartphone is currently located [19].
1
https://www.iis.fraunhofer.de/en/ff/lv/lok/tech/feldstaerke/rssi/tl.html
In summary, several approaches exist that provide a rough estimate of the user’s current position, but not of the user’s movement, and therefore can be applied in a hybrid approach to reinitialize a dead reckoning algorithm after it has failed to determine a reliable position estimate.
For tracking movements, pedestrian dead reckoning (PDR) is widely used. Sev- eral solutions do not need any external infrastructure, but rely solely on inertial sensors available in smartphones.
True inertial navigation by the double integration of acceleration values is not feasible since the sensor measurements are much too noisy. Instead, PDR is mostly accomplished by a variant of so called Step and Heading Systems (SHS), that de- tect the user’s steps and try to estimate their length and direction [6]. Step detection on smartphones is historically achieved through the accelerometer using various techniques (see [7, 20, 21]). Lately, dedicated step detector sensors are available in more and more devices. The heading can be inferred from a combination of mag- netic compass and gyroscope, while step length can be either assumed as fixed or dynamic, e. g. based on the frequency [6].
The main disadvantage of any dead reckoning solution is the need for an initial position from which the relative positioning can start as SHS by their nature can- not compute absolute positions. Furthermore, the positioning error increases over time due to noisy sensor data. Given both of these problems either error correction through external sensors or an algorithm that matches the sensor data to a final posi- tion estimate are necessary to employ dead reckoning for more complex tasks such a navigating a user or other location based services.
As in our work external sensors should be avoided, matching algorithms are the only option for solving the indoor positioning problem. Maps are often represented as discrete graphs (see e.g. [22]) and have been used successfully to locate robots in complex environments. For pedestrian indoor localization, graph models of the environment were first introduced by Liao et al [11]. They introduced the particle filtering method on a Voronoi graph in order to make the position estimation more robust and efficient. Since then, other researchers have adapted and improved this approach (e.g. by adding multiple sensor modalities): The system recently presented by Hilsenbeck et al [9] is operating on a graph generated from a 3D model of the environment. Herrera et al [8] use existing material from OpenStreetMap and enrich it with information about the indoor areas of a building. Ebner et al [4] generate a densely connected graph from the floor plan of a building. All these approaches have in common that creating a map is either time consuming or expensive (due to the need for special hardware) or relies on existing data. Furthermore, normally the resulting graphs do not contain any information besides the geometry of the building, making them unsuitable to use as data source for the path planner of a navigation system.
As far as the evaluation of indoor positioning is concerned, the state of the art
can be surveyed best by looking at recent competitions that aim to compare the
performance of indoor positioning systems. Held regularly, the provide an oppor-
tunity to gain insights into established evaluation methods. Potort`ı et al [17] report
the results of the EvAAL-ETRI competition held in conjunction with the IPIN 2015
conference. To assess the error of the participating systems, they add a penalty for wrongly detected floors or buildings to the actual positioning error. The final rank- ing is determined by the 75% quantile of the resulting errors. In their evaluation of the 2015 EvAAL-ETRI WiFi fingerprinting competition, Torres-Sospedra et al [23] use the mean error as the metric to rank the competitors: The mean error of the tested system is not lower than 6 meters. Lymberopoulos et al [13] again use the mean positioning error to rank the systems participating in the 2014 Microsoft Indoor Localization Challenge. Interestingly however, they remark that the mean error or other commonly used metrics do not represent the performance of a system in its entirety. We follow this assessment and argue for a task-oriented view on the performance of a positioning approach that we introduce below.
3 Data Model for Landmark-based Navigation
While the mean positioning error is definitely of interest for building autonomous systems that can navigate in indoor environments (e.g. robots for ambient assisted living), for the implementation of many location based services it is an inappropri- ate performance metric. In our view, this is due to the fact that users of location based services experience the environment from a cognitive perspective that assigns meaning to perceivable objects. E.g. a pedestrian can walk to a distant object with- out continuous technical assistance while a robot cannot. Therefore, in applications involving humans it may often be sufficient to know that the user is close to a se- mantically meaningful object (e.g. a door at the end of a corridor or a certain cloth shop in a shopping mall). The main consequence of this hypothesis is that the preci- sion of indoor positioning has to be measured in terms of the user’s relative position to objects relevant for his current task instead of meters in a coordinate system that the user cannot even perceive.
For an implementation of this idea, we rely on graphs to formally represent a map of the environment and define and locate relevant objects. With such a representation of the environment, also the task of navigating a user can be based on relevant objects which are commonly known as landmarks in the GIS literature (see e.g.
Ohm et al [15]).
At this point, we can state the major contribution of the present paper. We pro- pose an approach to combine a graph-like representation of an environment with the minimally necessary metric information to correctly align the data computed by a SHS in the graph in order to assign the user’s position to more easily perceivable objects in the environment which we call areas or landmarks depending whether we refer to a part of a path the user should walk on or a relevant object the user can perceive in the environment. It has to be noted that we do not assume a partic- ular sensor technology or SHS algorithm. We only assume to receive vectors that quantify the step length and direction of a pedestrian’s movement.
This approach for an indoor navigation system shares similarities with other work
(in particular [12]). As a new contribution, we introduce the concepts of areas and
the area match score that link indoor positioning based on SHS with landmark based navigation (section 4). By doing this, we relax performance requirements for positioning algorithms as we no longer need to optimize the metric errors at any time of the navigation process. Instead, it is sufficient to identify the correct area a user is currently walking on: given the current area, the system can generate a navigation instruction that incorporates a landmark easily perceivable from the esti- mated position of the user. Under normal conditions, users are able to walk towards the indicated landmark without further assistance. Then, in order to continue the navigation process the positioning algorithm has to determine whether the user is close to the landmark and can switch to the next instruction. Mostly, this task is much easier than continuously determining the exact position.
To introduce our approach, we describe the concepts we build our knowledge graphs on, and the algorithm we rely on to compute routes that we then split into path segments.
Our data model is based on the graph representation described in [15]. We adapted their concept for environment models in order to generate indoor naviga- tion graphs such as the one in Fig. 1. The graphs are created manually in a web tool by drawing on top of floor plans of a building. Edges represent paths users can walk on. Edges can connect multiple floors or buildings, allowing for the modeling of arbitrary building geometries. Nodes connected by edges are used to formalize decision points where users eventually have to change their direction. Landmarks can be integrated seamlessly in the graph structure in the form of special nodes that can optionally be enriched with images.
In summary, the system relies on a single data structure for routing and localiza- tion, minimizing the effort needed for map creation and maintenance.
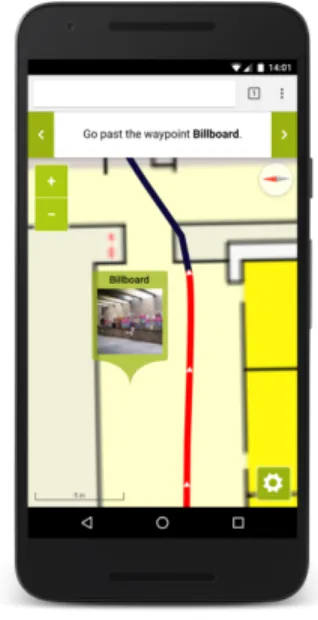
In order to transform such a graph into an indoor navigation graph, adjacent edges are combined into areas if the part of the environment captured by an area is perceivable as a unique object with salient landmarks (e.g. a corridor, a foyer, a staircase). An example can be seen in Figure 3, which shows part of a corridor as an area consisting of a several adjacent edges. In Figure 4 a typical landmark is displayed: the billboard shown on the map is also referred to in the navigation instruction.
For landmark based navigation, it is crucial to give navigation instructions at the right time in order not to confuse users and to guarantee good usability as well as reaching the destination. A navigation instruction is given at the right time if it does not refer to any landmark that is not yet visible from the user’s current position or that the user has already passed before.
4 Graph-based Localization
Consequently, in order to give the right instructions at the right time, the user’s
relative position towards landmarks referred to in navigation instructions needs to
Fig. 3: User interface of the data collection app. The cur- rent area is highlighted in light red.
Fig. 4: Example of a landmark-based navigation instruction.
be known. Our indoor positioning algorithm computes this position by mapping sensor data to areas in the indoor navigation graph.
For this mapping, we implemented a recursive stochastic filter that after each measurement assigns a probability to each area proportional to the likelihood of the user to currently walk on a certain area.
The filter is implemented as a particle filter (see Thrun et al [22]). This family of
algorithms represents a probability distribution by means of a representative sam-
ple, a set of so called particles. Around the expected position the number of particles
is high while elsewhere it is low according to the small probability mass. Using a
sampling and resampling strategy the set of particles is updated after each measure-
ment in order incorporate the new information (see Thrun et al [22] for details): Far
away from the expected position the particles diminish while new ones are generated
for positions with high probability mass. Our implementation can also incorporate
input from multiple sensors such as detected steps or WiFi signals in order to im-
plement the advocated hybrid approach for indoor positioning. Furthermore, infor-
mation contained in the indoor navigation graph stabilizes and corrects the position
estimates as many constraints for the user’s current location can be derived from
the graph structure (in particular invalid positions receive probability zero while in
standard SHS approaches the same locations are possible positions).
In order to investigate the influence of the precision of the SHS on our approach, we compared two different state of the art algorithms:
• motionDNA by Navisens
The motionDNA SDK by Navisens is a well-known commercial state-of-the- art motion tracking solution. According to the company’s website
2, it relies on inertial sensors only and does not need any external infrastructure to operate. The sensor readings are updated with a rate of 24 Hz on our test device and include a variety of information such as the user’s activity and the device orientation and position. For this study, only the position information (relative to the initial position, measured in meters in X and Y direction) is used.
• Android’s built-in sensors
On recent devices, the Android framework gives access to many sensors that can be used for motion tracking. In our case, the step detection sensor tells us when- ever a step occurs, whereas the average orientation during the step as provided by the rotation vector sensor is used as step direction. We assume that the user orients the smartphone in his walking direction and use a fixed step length.
Fig. 5 The trajectories of both motionDNA (blue) and raw step data (green) of a typical walk along the test route. Ground truth (starting top left, then clockwise) and the boundaries of the areas defined for the evaluation experiment are drawn in red.
Navisens Android Ground Truth
In Fig. 5 the data computed by each of both algorithms for a single walk on the test route is plotted into the map of the building. Many position estimates are far off the route. This observation illustrates that information about the environment is indispensable for the position estimates to be used in an indoor navigation system.
In order to map SHS estimates to the indoor navigation graph, we apply the described particle filter. Initially the probability is distributed uniformly over all edges.
Whenever a step is detected, a Gaussian naive Bayesian classifier updates the probability distribution for the edges starting in the current node. The update takes the motion model for the user (i.e. the distance and direction of the detected step) and the orientation of the considered edges into account. The probability of the user
2
http://navisens.com
to walk on an edge increases if this edge is parallel to the direction detected by the SHS. The increment for an edge not parallel to the detected direction decreases proportionally to the angle between the direction and the orientation of the edge.
Unlike other approaches, the algorithm does not immediately select the edge with the highest probability as the current position estimate. Instead, it updates the set of particles each of which represents a different hypothesis for the user’s current position. A similar approach has been successfully applied to localization in robotics (see Thrun et al [22]) and allows to
• account for noise in the SHS data, which may stem from the rotation vector sensor (or rather the underlying magnetic compass) or the way the device is held in the hand,
• account for differences in step length while a person is walking, and
• account for different step lengths of different users.
More formally, each particle’s state is defined by the vector {n
t, d
t, e
t}, where n
tdenotes the starting node at time t , d
tthe distance walked since leaving the node, and e
ta discrete probability distribution for the edges adjacent to the node. On every step, the state is updated according to
{n
t, d
t, e
t} ∼ p(n
t,d
t, e
t|n
t−1, d
t−1,e
t−1, z
θ,t, z
l,t, G), (1) where z
θ,tand z
l,tare the measured step direction and length, and G is the graph of the building. Applying the procedure detailed in [9], the update rule can be de- composed to its independent parts. The noisy step length measurement with the empirically determined variance σ
l2is modeled by
l
t∼ p(l
t|z
l,t) ∼ N (z
l,t,σ
l2), (2) leading to the updated cumulative step distance of
d
t∼ d
t−1+l
t. (3)
Similarly, the step direction is updated by
θ
t∼ p(θ
t|z
θ,t) ∼ N (z
θ,t,σ
θ2) (4) and subsequently used to determine the new edge distribution:
e
it∼ p(e
ti|e
t−1i, θ
t, G) ∼
( N (∆ θ
ti, σ
e2) ∗ e
it−1if |∆ θ
ti| ≤ 100
0 otherwise (5)
Here, e
tidenotes the probability of the user to currently walk on the i-th edge adja-
cent to the current node and ∆ θ
tithe angle difference between the step and the i-th
edge. Finally, the decision whether the user has completed an edge and moved to
the next is formalized as:
n
t∼
( no if d
t≤ length(e) ∧ e = argmax
i(e
t)
yes if d
t> length(e) ∧ e = argmax
i(e
t), (6) i. e. whenever d
texceeds the length of the currently most probable edge e. In this case the starting node has to be updated: n
tis set to the sink node of the previous edge and d
tis reset to zero. Since the walked distance usually does not align exactly with the edge length, the difference is added to the position estimate and the step bias is reinitialized to N (z
l,t, σ
l2) as the prior distribution for the new current edge e
t.
After the update step, the particle importance weights are distributed according to the non-normalized probability of the most probable of all adjacent edges:
ω
t= ω
t−1∗ p(z
l,t, z
θ,t|n
t) ∼ ω
t−1∗ max
i
(e
t) (7)
Finally, stochastic universal sampling is performed, which guarantees low vari- ance and a representation of the samples in the new particle distribution that is pro- portional to their importance weights (see [22] for further details).
In order to estimate the user’s position, the expected value of the particle distribu- tion is calculated. From there, the closest point that is located on either an edge or a node of the graph is computed as the final position estimate. This snap to the indoor navigation graph ensures that the position estimate is a location that is accessible to the user and — differently to the pure SHS algorithms — prevents the positioning algorithm to assume impossible movements, e.g. through walls.
5 Task-Oriented Evaluation
The purpose of this study is to test how well the correct area on a route can be determined by the localization system, which – as noted above – is a requirement for correct navigation instructions and for successful navigation in general. Based on those findings, it is our goal to identify patterns that point to problematic areas and to propose ways to mitigate the issue.
5.1 Experimental Setup
As detailed above, the indoor navigation graph is a simplified model of the envi-
ronment. Perfectly accurate position tracking is feasible only if the user actually
walks on the edges of the graph. In reality however, the user’s movement is not
constrained to the graph structure, and edges and nodes do not necessarily have a
perceptible counterpart that can ease the user’s orientation. As an example we con-
sider the foyers at the end of the long corridors in Fig. 1. They are modeled as a
dense sub graph in order to approximately represent different paths a user may take
through the foyer. The user however perceives the foyer as a single object that can be traversed arbitrarily instead of a discrete graph.
In order to take the user’s moving and orienteering behavior into account, we in- troduce the area match score as a performance metric that enables us to investigate the problem in a task-oriented manner. Each area corresponds to a section of the route, which in turn is comprised of multiple edges in the indoor navigation graph.
Strictly speaking, an area is matched if the position estimate is located in the same area the user is currently walking on.
However, the introduction of artificial segments inevitably leads to matching er- rors at the boundaries of two adjacent areas as the user’s position cannot estimated without error. Therefore, areas may be mismatched.
In order to account for this problem, we relax the strict definition of a match by adding the mean position error to the boundaries of each area. The final area match score for the whole route is then defined as the percentage of position updates that match the correct area according to the relaxed definition above.
To collect data for an evaluation of the implemented indoor positioning algo- rithm, we conducted an empirical study in the ground floor in an university build- ing. There, we defined a test route spanning 182 meters. The route leads through 4 corridors in a rectangular shape. Three of the corners are modeled as small foyers (see Fig. 1). The only obstacles on the route are several glass doors that had to be passed in order to reach the destination of the route.
The route was segmented into areas. Their boundaries were set at positions where semantically relevant objects — i.e. salient landmarks — are located. For deter- mining salient landmarks along the route, we followed the approach described in [10]: 19 persons rated 32 objects in the test area regarding different aspects of their salience. We selected the objects with the highest predicted overall salience as land- marks for the navigation instructions in our experiment. These landmarks included e. g. a glass cabinet, a wall painting, a bench and a sign for the department of psy- chology. Additionally, architectural features such as the aforementioned glass doors or the beginning and end of foyers were used to segment the route into areas. For each area, we formulated a navigation instruction that should explain to the test per- sons how to proceed the route. Finally, the route consisted of fourteen sections of varying size (see Fig. 5). The main factor that influences the size of the sections is the visibility of the landmark at their end: some can be referenced unambigu- ously from further away, while for others one has to be closer, thus causing smaller sections.
Acquisition of Positioning Data
Starting from a defined position, 7 different persons who were familiar with the area
and the landmarks performed a total of 15 walks along the test route. Data collection
took place over the course of several days, with an LG Nexus 5X running Android
7.1.2 as the test device. Before each test run, the compass was calibrated and its
proper functionality was verified. During the experiment, the phone was held in the
hand in front of the body, pointing in the direction the person was heading toward.
For data collection, a custom Android application was developed. It is able to capture data from various sensors of the device:
• Steps detected by the built-in Android step detection sensor.
• Orientation data from Android’s orientation vector sensor, which in turn fuses magnetometer and gyroscope readings.
• Data from Navisens’ motionDNA SDK. First and foremost, this includes the rel- ative position, but heading direction, orientation of the device, as well as detected user activity are also logged.
• The signal strength of WiFi access points in the area (not used in this study).
• A video recording of the device’s back-facing camera, capturing the test person’s feet and the area immediately in front of them.
The app’s user interface consists of a map of the test area and a single button that allows the user to start the test run. After the localization on the starting node and sensor systems were initialized, the first area to walk through was highlighted on the map and the button text changed to the first instruction. When a test person reached the landmark, he or she pressed the button in order to set the ground truth for the transition between two adjacent areas, and the interface was updated with information for the recently entered area.
Validation of the Collected Data
With this experimental setup, we collected sensor data for the test route and a ground truth labeled by experts in a single run of the experiment. We avoided to make use of other, technically very complex methods to label the logged sensor data with the correct area.
In order to verify whether the collected samples were representative for average persons walking straight ahead, several gait characteristics were calculated.
• The mean gait speed during a walk can easily be determined by the quotient of route length and the time needed to complete the route, measured by the differ- ence of timestamps between last and first step. The result is a mean speed of 1.30 m/s (SD = 0.14 m/s), which is well within the margin reported by Bohannon and Williams Andrews [2].
• In order to calculate the step length, the steps are counted manually for each walk by means of the recorded video, revealing that Android’s step detector misses about 5.8% of steps on average.
• The mean step length amounts to 0.73 m (SD = 0.077 m), which is classified as fast gait according to the study from Oberg et al [14]. This can be explained by the fact that the test persons knew the area and the route very well.
In summary, the collected data is representative for ”average” persons who currently perform a similar navigation task.
Analysis of the Collected Data
The analysis of the raw data shows – quite expectedly – that the error quickly ac-
cumulates, leading to a high mean location error of 11.5 m (Android sensors) re-
spectively 12.0 m (motionDNA). Figure 5 shows the trajectories of a typical walk.
Navisens’ motionDNA often struggles with substantial drift towards the left early on, but otherwise manages to track the overall shape quite well. The version relying on the Android step counter usually shows drifts in different directions throughout the walk due to the lack of correction. Additionally, the reported distances differ between the tracking methods: motionDNA’s paths are usually shorter (M = 174.1 m, SD = 15.37 m), Android’s longer (M = 189.4 m, SD = 16.49 m) than the ground truth of 182.0 meters.
Before the motionDNA data could be used as input to the particle filter, some preprocessing was inevitable: Since the update frequency of about 20Hz was rather high (about an order of magnitude higher than the step frequency), the data was split in batches of ten measurements that were treated as a single step. In two of the 15 recorded walks, the relative location reported by motionDNA unexpectedly was set back to the starting point of the route. Therefore, the area in which the reset occurred was eliminated from the data set.
5.2 Localization Results
Since it was not feasible to run both Navisens’ and our indoor localization imple- mentation at the same time on one device, we processed the collected data in an offline simulation of our indoor positioning algorithm.
In order to extend the data set, from each actual walk a stochastic motion model was learned and used to generate 20 additional walks proportional to the learned model. 10 of them were generated using motionDNA for simulating steps of the user and 10 others using the Android step counter.
The extended data set was used for the evaluation of the implemented algorithm.
In the remainder of this section, we present our evaluation results and discuss their impact on the appropriateness of the proposed area match score for localizing users during indoor navigation.
Accuracy Metrics for the Sensor Data
Figure 6 shows a comparison of the two motion tracking solutions regarding their positioning accuracy, i. e. the distance from estimated position to ground truth, after their raw data has been processed by the particle filter.
The mean and median error of motionDNA amount to 7.02 and 4.28 meters re- spectively, while the Android sensors lead to an accuracy of 4.39 (mean) and 2.60 (median) meters. This performance gap is likely caused by two factors:
• The drift at the beginning that motionDNA often suffers from is propagated throughout the whole walk, causing a mismatch between step directions and the graph edges.
• Open spaces at the ends of the corridors allow for some overshooting, which
benefits the approach using Android sensors and its slightly longer steps. The too
Fig. 6 Empirical cumulative distribution function showing the accuracy with the two different motion tracking methods.
0.00 0.25 0.50 0.75 1.00
0 10 20 30 40 50 60
position error [m]
CDF
Tracking method Navisens Android sensors
short distance reported by motionDNA however can often not be compensated by the particle filter.
Analysis of the Area Match Score
On average, 60.6% (motionDNA) resp. 74.7% (Android sensors) of position up- dates match their area. Figure 7 visualizes the area match score for each area on the route. Obviously, the choice of the SHS influences the overall performance of our positioning algorithm. It cannot repair arbitrary errors of the SHS as positions too far away from any edge and directions very different from the orientation of the edges nearby the user’s current position decrease the probability of the particles for these edges significantly (see Eq. 5).
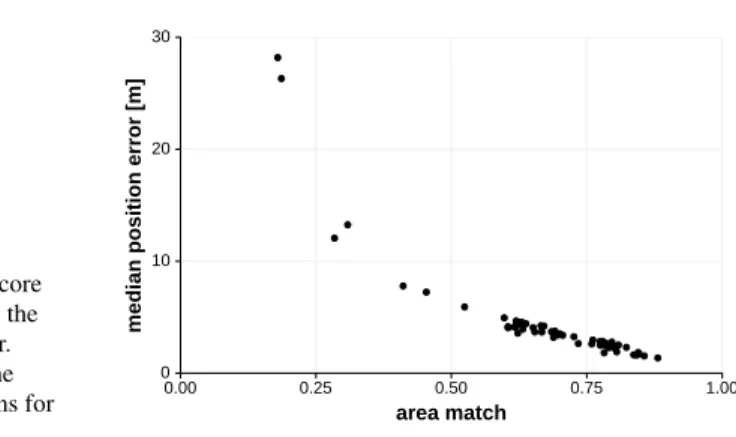
As Fig. 8 illustrates, the area match score and the positioning error are inversely correlated (r(58) = -0.87, p < 0.05). From these observations we conclude that in order to support indoor navigation effectively any indoor positioning needs to be able to reliably estimate a user’s relative movements. While in this study we only
1.00 0.21
0.75 0.39 0.51
0.75
0.72
0.80 0.30 0.29 0.58 0.21
0.59 0.68
1.00 0.68
0.89 0.77 0.82
0.79
0.74
0.95 0.44 0.56 0.78 0.13
0.70 0.80
Navisens Android sensors
0.00 0.25 0.50 0.75 area match1.00
Fig. 7: Area match scores for the two motion tracking methods.
Fig. 8 The area match score correlates inversely with the median positioning error.
Each point represents the mean of 10 simulated runs for one actual walk.
0 10 20 30
0.00 0.25 0.50 0.75 1.00
area match
median position error [m]
analyzed walking, this observation in a more general setting equally applies to other kinds of movement (e.g. climbing stairs, taking an elevator, etc.).
Influence of the Navigation Graph on the Area Match Score
While from the preceding analysis we learn the lesson that the area match score’s precision depends on the quality of the step detection, in the following we identify other sources for area match errors.
The first source is the indoor navigation graph. Its usage introduces artifacts for the actual movement of a person as it always has to be snapped on one of the edges
— sometimes a very crude discretization of the actually available degrees of free- dom how to move.
While in corridors no problems may arise, Fig. 7 illustrates that in junctions and foyers, the area match score tends to decrease. In such a situation, there is only a single correct edge that can be hypothesized as the current position. However, the particle resampling may fail when the SHS misses the user’s turn or at least recognizes it too late. In this case only few or even no particles are generated for the current edge while the majority of the particles hypothesizes the user to continue to walk straight ahead. This phenomenon is particularly obvious for the junction on the bottom left in Fig. 7.
Contrarily, the three other larger foyers are represented by a densely connected net that enables the system to track almost arbitrary paths within these areas (see Figure 1). In these areas, the area match score remains high.
This circumstance teaches us that indoor navigation graphs should not only model accessibility relations between locations in the modeled environment, but also approximate the geometry of the locations.
We tested this hypothesis by connecting the nodes adjacent to junctions with ad- ditional slanted edges as depicted in Figure 9, the benefits of which are twofold:
Firstly, it models more natural paths where the test person cuts the corner slightly;
secondly, it allows for the compensation of step length differences since now multi-
ple paths lead into the corridor that is branching off.
Fig. 9 Closeup of the part of the graph that was changed.
The edges drawn in red were added to stabilize the position estimation at this junction.
Using the new graph structure, we repeated the computation of the area match score. The result was not only an improvement in the area after the junction, but in all subsequent sections as well. In the small but critical area immediately after the junction, the area match score was improved by 38% (from 0.21 to 0.29) for motionDNA, and almost tripled (from 0.13 to 0.36) for the Android sensors. The improvement is even statistically significant for the remainder of the route after the change: a Wilcoxon rank sum test indicates that the area match score is greater for the graph model with additional edges (Mdn = 0.78) than for the original version (Mdn = 0.73), W = 33942, n
1= n
2= 300, p < 0.05.
For reference, the median position error when calculated for the whole route also decreased from 2.60 to 2.52 meters for the Android sensors, and from 4.28 to 4.11 meters for the version running with motionDNA.
We conclude that by applying a systematic methodology to design an indoor navigation graph, we can almost completely eliminate the negative influence of the discretization of the physical environment that is inevitable to construct the repre- sentation of the environment.
In the remainder of this analysis, we only discuss results obtained by applying best practices learned so far: we use the internal Android SHS on the indoor navi- gation graph with additional edges for junctions (as shown in Fig. 9).
1.00 0.21
0.74 0.37 0.50
0.76
0.74
0.82 0.30 0.29 0.56 0.29
0.66 0.72
1.00 0.68
0.89 0.78 0.83
0.79
0.75
0.95 0.45 0.55 0.77 0.36
0.78 0.84
Navisens Android sensors
0.00 0.25 0.50 0.75 area match1.00
Fig. 10: Area match scores for the two motion tracking methods (with additional
edges in the lower left corner).
Influence of Area Transitions on the Area Match Score
Dividing a route into areas as explained above introduces another artifact at the boundaries of adjacent areas. It may prove problematic that boundaries are strict while SHS is noisy. Therefore, measurements taken around boundaries may be ran- domly assigned to one of the areas and increase the area match error.
In particular, the smaller an area is, the higher the precision of the SHS has to be for the measurement to be matched to the correct area. Therefore, in order to eliminate the influence of this artifact on the area match score, it seems justified to smooth the boundaries, allowing positions up to 2.5 m (i. e. the median position error) away from the exact boundary still to count as a match.
By loosening the definition of an area match in this way, the score increases from 0.77 to 0.88 on average, almost cutting the remaining error in half. Considering only the middle part of each area, defined as those positions that are further than 2.5 m away from each of the area’s boundaries, the area match score amounts to 0.87 (strict) respectively 0.91 (approximate). On the other hand, when looking at the boundaries themselves (i.e. the interval of ±2.5 m around the boundary), the scores amount to 0.73 for the parts immediately after a segment change and 0.84 for the part at the end of each segment.
In summary, we conclude that the SHS position estimate tends to lag behind more often than it precedes the actual position.
Automatic Prediction of Locations with Low Area Match Score
Manually identifying problematic areas with a controlled experiment and known ground truth as discussed above is no solution of the productive use of indoor posi- tioning in a complex navigation system.
Instead, the goal has to be to automatically predict these areas during positioning a user. In this way, the navigation system can be empowered to avoid such situations altogether or apply situation-specific positioning strategies (e.g. mounting beacons, interacting with users, classifying raw sensors with other algorithms than SHS). In our opinion, it is a challenge for research in indoor positioning to substitute sensing the GPS signal with a hybrid approach to classify raw data into absolute or relative coordinates. One step towards this research goal is to compute confidence scores for positioning data in order to automatically predict the best approach for each area of an (indoor) environment.
We investigated the particle set continuously computed by our algorithm and tried to detect a predictor for a confidence score of the estimated current position:
During navigation, divergence monitoring can be used to identify situations where the particle distribution deviates too far from the true posterior.
The extreme case where the sum of the non-normalized particle importance
weights is close to zero is already handled by the system. This generally happens
when the step direction does not even approximately coincide with any adjacent
edge. If such a situation is detected the particle filter is re-initialized with a spread
out normal distribution around the last known location, in order to allow the position
tracking to pick up again.
Another promising way to predict erroneous situations is to find a correlation be- tween the spread of the particles and the accuracy of the positioning, the assumption being that a more scattered set of particles leads to a wrong position more often. To measure the spread of the particles, we use the root mean square error with respect to the mean of the particles. It provides meaningful values even when one dimen- sion of the coordinates is equal for all the particles. Nevertheless, interpreting the spread of the particles proved difficult since there are multiple factors at play: At the beginning, the particles are somewhat spread out due to the particle filter’s initial normal distribution. Since they are forced to move along the graph structure, vari- ance decreases whenever there is only one possible edge in the heading direction, i. e. in corridors. Meanwhile, variance increases due to the different step lengths as long as there is no turn in the route to filter out the wrong step length hypotheses.
As a result, the data can only be interpreted properly after a few turns in the route, when the influence of the particle filter initialization has decreased.
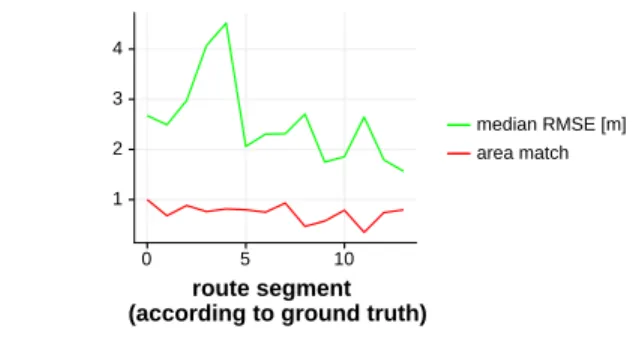
And indeed, if the test route is considered as a whole, no correlation can be found between positioning accuracy and particle dispersion. However, taking only the sec- ond half of the route into account, area match and RMSE do correlate negatively, r(10) = −0.83, p < 0.01. As can be seen from Figure 11, there are matching local
Fig. 11 Development of median particle RMSE and area match score over the course of the test route.
1 2 3 4
0 5 10
route segment (according to ground truth)
median RMSE [m]
area match