8
emissions. Gupta and Cicerone16found that in a two-dimensional model simulation where 10% of CH4, CO and NOxemissions were shifted from northern mid-latitudes to the northern tropics, the CH4steady-state lifetime decreased by 1.4%.
The main sources of CH4 to the atmosphere have been identified14, but emission rates from individual sources are not known well enough to quantify trends in sources. Despite this, evidence exists that some regional sources may be changing. In the states of the former Soviet Union, production of natural gas, oil and coal have all declined during the late 1980s and early 1990s (http://
www.bp.com/bpstats), and the fraction of gas that is vented or flared has also decreased17. This would lead to decreased emissions from the high northern latitudes. If this speculative scenario is true, emissions from the tropics must have increased to maintain a nearly constant global source strength.
Our conclusions that CH4sources have been nearly constant from 1984 to 1996 has important implications for policy. If CH4sources and [OH] remain at 1996 levels, the globally averaged CH4mole fraction will slowly increase to,1,800 nmol mol−1over the next two decades, and then stabilize. As the imbalance between CH4sources and sinks is currently very small, policies that reduce CH4emissions by a few per cent would nearly ensure a decrease of CH4levels in the atmosphere18. We point out, however, that quantifying small, long- term trends in specific CH4source strengths remains impossible, so the future atmospheric burden of CH4cannot be predicted with certainty19. A better understanding of the CH4budget, and how it is changing with time, is still needed to predict more accurately the
future role of CH4in climate change. M
Received 9 September 1997; accepted 24 March 1998.
1. Etheridge, D. M., Pearman, G. I. & Fraser, P. J. Changes in tropospheric methane between 1841 and 1978 from a high accumulation rate Antarctic ice core.Tellus44,282–294 (1992).
2. Dlugokencky, E. J., Steele, L. P., Lang, P. M. & Masarie, K. A. The growth rate and distribution of atmospheric methane.J. Geophys. Res.99,17021–17043 (1994).
3. Dlugokencky, E. J.et al. Changes in CH4and CO growth rates aftr the eruption of Mt. Pinatubo and their link with changes in tropical tropospheric UV flux.Geophys. Res. Lett.23,2761–2764 (1996).
4. Dlugokencky, E. J.et al. A dramatic decrease in the growth rate of atmospheric methane in the northern hemisphere during 1992.Geophys. Res. Lett.21,45–48 (1994).
5. Steele, L. P.et al. Slowing down of the global accumulation of atmospheric methane during the 1980’s.
Nature358,313–316 (1992).
6. Thoning, K. W., Tans, P. P. & Komhyr, W. D. Atmospheric carbon dioxide at Mauna Loa observatory, 2. Analysis of the NOAA GMCC data, 1974–1985.J. Geophys. Res.94,8549–8565 (1989).
7. Tans, P. P., Conway, T. J. & Nakazawa, T. Latitudinal distribution of the sources and sinks of atmospheric carbon dioxide derived from surface observations and an atmospheric transport model.
J. Geophys. Res.94,5151–5172 (1989).
8. Hogan, K. B. & Harriss, R. C. Comment on ‘A dramatic decrease in the growth rate of atmospheric methane in the northern hemisphere during 1992’ by E. J. Dlugokenckyet al. Geophys. Res. Lett.21, 2445–2446 (1994).
9. Bekki, S., Law, K. S. & Pyle, J. A. Effect of ozone deletion on atmospheric CH4and CO.Nature371, 595–597 (1994).
10. Lowe, D. C., Brenninkmeijer, C. A. M., Brailsford, G. W., Lassey, K. R. & Gomez, A. J. Concentration and13C records of atmospheric methane in New Zealand and Antarctica:Evidence for changes in methane sources.J. Geophys. Res.99,16913–16925 (1994).
11. Prinn, R. G.et al. Atmospheric trends and lifetime of CH3CCl3and global OH concentrations.Science 269,187–192 (1995).
12. Dlugokencky, E. J., Masarie, K. A., Tans, P. P., Conway, T. J. & Xiong, X. Is the amplitude of the CH4
seasonal cycle changing?Atmos. Environ.31,21–26 (1997).
13. Prather, M. J. Time scales in atmospheric chemistry: Theory, GWPs for CH4and CO, and runaway growth.Geophys. Res. Lett.23,2597–2600 (1996).
14. Fung, I.et al. Three-dimensional model synthesis of the global methane cycle.J. Geophys. Res.96, 13033–13065 (1991).
15. Cicerone, R. J. & Oremland, R. S. Biogeochemical aspects of atmospheric methane.Global Biogeochem. Cycles2,299–327 (1988).
16. Gupta, M. & Cicerone, R. Perturbation to global tropospheric photochemistry due to changes in latitudinal distributions of surface sources of CH4, CO, and NOx.Eos78,90 (1997).
17. Law, K. S. & Nisbet, E. G. Sensitivity of the CH4growth rate to changes in CH4emissions from natural gas and coal.J. Geophys. Res.101,14387–14397 (1996).
18. Hogan, K. B., Hoffman, J. S. & Thompson, A. M. Methane on the greenhouse agenda.Nature354, 181–182 (1991).
19. Khalil, M. A. K. & Rasmussen, R. Decreasing trend of methane: unpredictability of future concentrations.Chemosphere26,803–814 (1993).
20. Schimel, D.et al. inIntergovernmental Panel on Climate Change (IPCC), Climate Change 1995, The Science of Climate Change94 (Cambridge University Press, Cambridge, 1996).
21. Interactive Data Language Research Systems (Boulder, Colorado, 1997).
Acknowledgements.We thank all agencies that have assisted us with the cooperative air sampling network, and Blue Star Line for their continued support of our sampling efforts. We are grateful for the efforts of all network observers, and thank T. Conway and R. Cicerone for comments. This work was supported in part by the Atmospheric Chemistry Proejct of the NOAA Climate and Global Change Program and the US Environmental Protection Agency.
Correspondence and requests for materials should be addressed to E.J.D. (e-mail: edlugokencky@cmdl.
noaa.gov).
Influence of volcanic eruptions on Northern Hemisphere
summer temperature over the past 600 years
K. R. Briffa*, P. D. Jones*, F. H. Schweingruber†
& T. J. Osborn*
*Climatic Research Unit, University of East Anglia, Norwich NR4 7TJ, UK
†Swiss Federal Institute of Forest,
Snow and Landscape Research, Zu¨rcherstrasse 111, CH-8903 Birmensdorf, Switzerland
. . . .
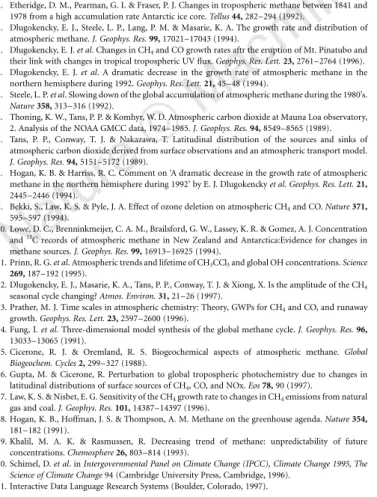
A network of temperature-sensitive tree-ring-density chrono- logies provides circum-hemisphere information on year-by-year changes in summer warmth in different regions of the northern boreal forest1. Combining these data into a single time-series provides a good summer-temperature proxy for northern high latitudes and the Northern Hemisphere as a whole2. Here we use this well dated, high-resolution composite time-series to suggest that large explosive volcanic eruptions produced different extents of Northern Hemisphere cooling during the past 600 years. The large effect of some recent eruptions is apparent, such as in 1816, 1884 and 1912, but the relative effects of other known, and perhaps some previously unknown, pre-nineteenth-century erup- tions are also evaluated. The most severe short-term Northern Hemisphere cooling event of the past 600 years occurred in 1601, suggesting that either the effect on climate of the eruption of Huaynaputina, Peru, in 1600 has previously been greatly under- estimated, or another, as yet unidentified, eruption occurred at
Table 1 Years of extreme low tree-ring density averaged around the Northern Hemisphere
NHD1* jValue† NH anom.‡ NHD2
Rank Year (8C) Rank Value
...
1 1601 −6.90 −0.81 1 −6.75
2 1816 −4.33 −0.51 7 −3.36
3 1641 −4.31 −0.50 2 −4.27
4 1453 −4.24 −0.50 3 −4.05
5 1817 −3.76 −0.44 10 −3.18
6 1695 −3.50 −0.41 4 −3.64
7 1912 −3.33 −0.39 6 −3.38
8 1675 −3.13 −0.37 92 −1.50
9 1698 −3.08 −0.36 5 −3.40
10 1643 −2.99 −0.35 22 −2.43
11 1699 −2.96 −0.35 20 −2.50
12 1666 −2.89 −0.34 11 −3.16
13 1884 −2.89 −0.34 12 −3.09
14 1978 −2.80 −0.33 14 −2.89
15 1837 −2.78 −0.32 9 −3.23
16 1669 −2.77 −0.32 67 −1.76
17 1587 −2.64 −0.31 19 −2.50
18 1740 −2.61 −0.30 76 −1.72
19 1448 −2.57 −0.30 47 −2.01
20 1992 −2.56 −0.30 52 −1.92
21 1836 −2.48 −0.29 24 −2.40
22 1818 −2.45 −0.29 8 −3.32
23 1495 −2.42 −0.28 36 −2.22
24 1968 −2.38 −0.28 29 −2.32
25 1742 −2.35 −0.27 17 −2.64
26 1783 −2.35 −0.27 18 −2.51
27 1667 −2.35 −0.27 204 −0.82
28 1642 −2.22 −0.26 13 −2.94
29 1819 −2.21 −0.26 25 −2.36
30 1446 −2.20 −0.26 117 −1.31
...
*The ranked lowest 5% of values in the series made up as the average of five large regional series (see Fig. 2). Bold values also occur in the bottom 5% of a series formed as the simple average of all sites (NHD2).
†jvalues are expressed as standardized departures from the mean forAD1881–1960.
‡ Estimated NH temperature anomaly (AD1881–1960 base). See Methods section for further details.
Nature © Macmillan Publishers Ltd 1998
8
the same time. Other strong cooling events occurred in 1453, seemingly confirming a 1452 date for the eruption of Kuwae, southwest Pacific, and in 1641/42, 1666, 1695 and 1698.
A number of published regional dendroclimatic temperature reconstructions have made passing reference to the coincidence between certain localized cold summers and the dates of various volcanic eruptions3,4, and some potential for identifying large volcanic signals has been identified in a combined set of North American and European chronologies5. Recently, the network of wood-density chronologies has expanded greatly and now encom- passes the northern boreal forest regions of Siberia so that, for the first time, it spans the entire Northern Hemisphere, currently incorporating replicated series from over 380 locations.
The tree-ring series that constitute each site chronology were detrended to remove possible bias associated with changes in the age of the sample trees, so that each chronology and the overall mean record is expected to preserve interannual and decadal timescales of temperature variability with greatest fidelity (see Methods section).
It is generally accepted that large-scale temperature variability on just these timescales is influenced by the frequency and magnitude of large volcanic eruptions6. However, the extent to which the strength of this influence can be tested beyond the confines of the twentieth century is limited by the poor availability of volcanic and climate histories which, of necessity, should be highly resolved and precisely dated7,8. We examine the evidence for volcanic forcing of Northern Hemisphere (NH) summer temperatures by comparing our average NH tree-ring-density record with previous proxies of large-scale volcanic activity and with the historical record of large eruptions over the past 600 years. We do not assume that these tree- ring data represent surface temperature perfectly, or that all low- density values are forced by volcanic eruptions5. However, we do consider that the breadth of temperature sensitivity and firm dating control in our data provide as rigorous a basis for examining the nature of a volcano/temperature link over recent centuries as any achieved to date.
Two methods of using the site density series to construct a mean NH record have been explored. In each, time-dependent changes in
site spatial coverage are accounted for by adjusting the variance, in accord with the diminishing number of sites, especially in the early data (see Methods section). The two derived records are, never- theless, highly correlated (r¼0:92, AD 1400–1990) and similar extreme values are indicated in the lowest 5% of the distribution of each of them (Table 1). The (preferred) NH density record, NHD1 (Fig. 1), formed as the average of 5 subcontinental-scale mean density series (Fig. 2), correlates with a series of instrumental summer (April–September) average temperatures9combined over the areas corresponding to the chronology sites2at r¼0:76 (AD 1881–1960;pp0:01 after correcting degrees of freedom for auto- correlation). The correlation for the same summer season with temperatures averaged over the whole Northern Hemisphere (land and marine regions) isr¼0:57. We note that after 1960, there is a reduction in the decadal-timescale correspondence between the instrumental temperature records and the density series, possibly reflecting some large-scale anthropogenic influence causing the densities to decline2.
The most representative syntheses of past large-scale volcanic activity are generally recognised as the dust veil index (DVI)10, the volcanic explosivity index (VEI)11and the ice-core volcanic index (IVI)12. Each emphasises a different aspect of eruption activity. All have some inadequacy in spatial and temporal representation and some imprecision in resolution and dating.The IVI, which quanti- fies widespread ice acidity and the DVI, should contain a significant temperature ‘signal’. The VEI, which measures only the magnitude of eruptions and takes no account of likely atmospheric aerosol production, might be expected to show the lowest correlation with temperature11. The NH summer temperature correlations with these series (DVI,−0.37; VEI, −0.35; IVI,−0.33;AD 1881–1960) are all lower than for NHD1.
The correlations between the yearly values of NHD1 (truncated above 0) and each of these series are all statistically significant (p¼0:01 or better). (DVI (1500–1990),−0.33; VEI and IVI (1400–
1990) −0.24 and −0.32, respectively; see also Supplementary Information). Correlations based on non-overlapping five-year averages (hence reducing the effect of delayed spatial responses
1400 1500 1600 1700 1800 1900
Year
–6 –4 –2 0 2
Normalized mean density anomaly (standard deviation units)
1400 1500 1600 1700 1800 1900
NHD1
1448
1453 1495
1544 1587
1601
1641/2/3 1666
16751695
1698/9 1740 1783
1816/7/8
1836/7 1884 1912
? ? ?
VEI
7 6 5
–0.8 –0.6 –0.4 –0.2 0.0 0.2
Estimated Northern Hemishere temperature anomaly (°C)
Figure 1The NHD1 average of NH tree-ring-density chronologies. Values are shown as standardized anomalies from theAD1881–1960 period (left-hand axis) and in the form of regression-based estimates of NH mean temperature anomalies (right-hand axis). The dates of a number of extreme low values are indicated (see Table 1). The curve shows bidecadal smoothed values. The main
explosive eruptions (VEI 5, 6 and 7) listed in ref.14 are indicated on the lower axis.
Question marks indicate uncertainty because dates are based on radiocarbon.
These data and those for NHD2 (see Methods section) are available from the NOAA NGDC palaeoclimate database (http://www.ngdc.noaa.gov/paleo.html).
8
and slight dating uncertainties, especially in the IVI) are all higher (−0.46,−0.33 and−0.45, respectively) and higher again if the more recent, and hence better defined, five-year averages since 1600 are compared (−0.51,−0.43 and−0.52, respectively).
The largest historically documented eruption of the modern (instrumental) era is that of Tambora, Indonesia, in April 181513. This is one of only four Holocene eruptions to have been assigned a VEI of 7 (ref. 14; see also Table 2). Instrumental, historical and various tree-ring evidence all show widespread cold conditions, especially in eastern North America and western Europe in 181613 and the various ice core data7,15–20invariably show a strong acidity signal associated with this year. Very low summer temperatures (Fig. 2) are indicated in our data in 1816 (rank second lowest;
compare Table 1) but also in 1817 (tenth) and 1818 (eighth). The decade of the 1810s is shown to be the coldest in the record, due in part to a prior, as yet still unidentified, eruption in 1809 originally indicated by ice-core evidence21and later shown in regional tree- ring data3,4. This also shows up as a low value in 1810 (15th) in our NHD2 record (it is 49th in NHD1). Evidence of other, more recent, climatically effective volcanoes, shown in NHD1 by low values in
1912 (7th), 1884 (13th), 1836/7 (21st/15th) and even 1992 (20th), can be ascribed to the eruptions of Novarupta, Krakatau, Cosiguina and Pinatubo respectively, all of which, except Cosiguina22, have VEI of 6 (see Table 2). However, the eruption of Santa Maria (1902), also with a VEI of 6, does not show up as very anomalous in our data. We note that this is true also of some of the ice-core records7,15,17,18.
The most extreme value in our record is in 1601 for which we estimate (see Methods) a NH summer anomaly of−0.88C (see Figs 1 and 2, and Table 1). This is 0.38C cooler than that estimated in 1816.
Several previous dendroclimatic reconstructions have indicated the local significance of the 1601 cold anomaly, notably in North America4,23, but it is revealed here as clearly the most important hemispheric tree-ring density event in the past 600 years. Early evidence of a contemporaneous ‘unknown’ eruption came from European historical observations of optical atmospheric phenom- ena (dim Sun and reddish haze) in 1601 and 160210. Subsequent acidity evidence from ice cores in both Greenland15,24 and Antarctica7,17indicate that the volcanic aerosol around 1601 was of global extent, and analyses of contemporaneous tephra and dust in Antarctica25and a tropical ice cap from Quelccaya, Peru26has
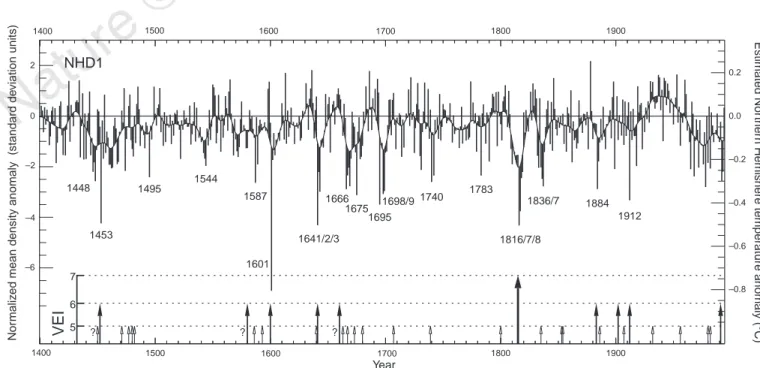
Figure 2Selected spatial patterns of tree-ring density.
Top left, changing spatial coverage of the tree-ring densitometric network over the past five centuries.
Red dots denote chronologies starting beforeAD1500;
green, 1600; blue, 1700; purple, 1800; and black, 1900.
NHD1 was constructed as the average of five mean chronologies comprising data from the regions sepa- rated by black lines. The other maps show normalized chronology density (with respect toAD1881–1960) in selected years of low overall mean density (see Fig.1).
Negative values indicate regions of reduced summer temperature.
Nature © Macmillan Publishers Ltd 1998
8
identified the source as Huaynaputina, Peru. If the Huaynaputina eruption, dated from documentary sources to 160026, was the sole cause of the cooling, it would imply a very large sulphur release, though a contemporaneous eruption elsewhere is also possible27. However, the cooling indicated in NHD1 is greater than is suggested by the degree of acidity in the various ice-core records.
The most explosive eruption of the fifteenth century is thought to have been that of Kuwae, southwest Pacific28. A date of around 1425 (,1420–75) has been proposed on the basis of radiocarbon evidence29. Diverse historical evidence suggests a 1452 date30. Large acid ‘spikes’ in Antarctic7,17–19and (though less pronounced) in Greenland15,16 ice cores suggest various dates for the eruption between about 1450 and 1460. Though based on a relatively sparse network (Fig. 2), the 1453 low value in our record (fourth lowest) is exactly coincident with one of the three most notable frost rings identified in high-elevation Californian pines31(the others being in 1601 and 1884) and provides strong support for a 1452 eruption date (allowing a one-year lag for a Southern Hemisphere eruption).
Recent data24,32indicate that the sulphur output from Kuwae may have been the same as for Tambora, giving credence to the extent of cooling indicated by our data.
There is a concentration of apparently cool summers in our record during the seventeenth century. Besides 1601, each of the individual years 1641/2/3 (rank 3/28/10); 1666/7/8/9 (12/27/40/16);
1675 (8); 1659(6) and 1698/9(9/11) have low mean density (,−2.0j:
see Table 1) and are all among the lowest 5% of values. This implies that at least six large climatically effective eruptions occurred that century, perhaps even eight, if one considers that two of these groups probably represent double events. The early 1640s seems to be such a group, with the large 1641 signal particularly prominent (Fig. 2). Multiple eruptions are suggested by some of the better dated Greenland24and Antarctic7ice cores at this time, and even though they are only datable to within62 years at best, a number
indicate a relatively large volcanic signal at about 1641/2, sometimes attributed to either or both of Komaga-Take, Japan (1640) or Awu, Indonesia (1641). While mindful of not assuming a necessary link between VEI and climate, we note that the ascribed magnitudes of these eruptions (VEI 5 and 5?)14seem too low to account for the extreme value for 1641 in NDH1 (−4.3j) and it is, therefore, interesting to note recent work that provides convincing evidence, not only of a long-standing misidentification of the Awu eruption (the volcano was in fact Mt Parker, Mindanao) but that this eruption was probably of a magnitude equivalent to the 1991 VEI 6 eruption of Pinatubo, Philippines (C. Newhall, personal commu- nication, and J. P. Witter and S. Self, manuscript in preparation). (A VEI value followed by ‘‘?’’ indicates uncertainty in the original magnitude attribution; see Table 2 legend.)
The small dating uncertainty, even in the best dated ice cores, allows us to suggest a tentative alignment between several of the other seventeenth century extremes in our record: in 1666, 1695 and 1698, with acid layers in both Greenland15,16and Antarctica7, and in 1675 with the best dated Antarctic core7. This implies that at least some of these dates may indicate global scale events. However, other than Gamkonora, Indonesia, in 1673 (VEI 5?) the only possible cause for any of these extremes, listed in Table 1, is the large eruption of Long Island, New Guinea (VEI 6). The current best estimates of its date are either in the range 1630–1670 based on radiocarbon33, and near 1690 based on Pb210 (ref. 34). Historical evidence of revegetation of the area by the end of the seventeenth century33 suggests an earlier date in this range, allowing speculation that either our 1666 (rank 12) or 1675 (8) events are possible evidence of this eruption. Either way, our data (and to a lesser extent the ice acidity data) suggest at least three significant eruptions in the late seventeenth century that remain otherwise unrecognized. Accord- ing to their frequency of occurrence in Table 1, more significant climatically effective eruptions occurred during the seventeenth
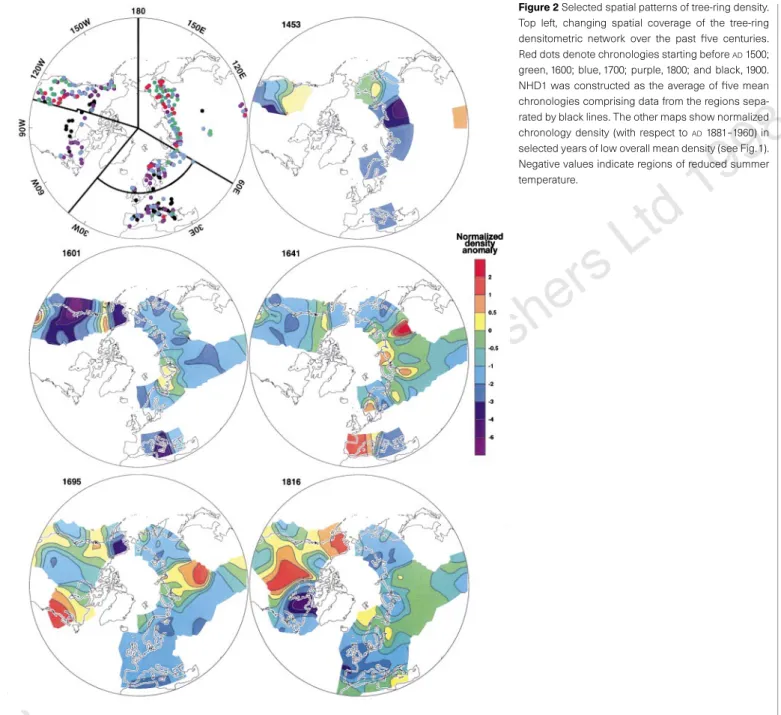
Table 2 Largest explosive volcanic eruptions sinceAD1400
Year* Season† Volcano and region Lat. (deg.) Long. (deg.) VEI‡
...
1450C – Aniakchak, Alaska 5.7N 158.1W 5(?)
1452 – Kuwae, Vanuatu, SW Pacific 16.8S 168.5E 6
1471 3yr Sakura-Jima, Japan 31.6N 130.7E 5(?)
1477 1 Bardarbunga (Veidivotn), Iceland 64.6N 17.5W 5(?)
1480D – St Helens, Washington, US 46.2N 122.2W 5(+)
1482D – St Helens, Washington, US 46.2N 122.2W 5
1580C – Billy Mitchell, Bougainville, SW Pacific 6.1S 155.2E 6
1586 – Kelut, Java 7.9S 112.3E 5(?)
1593 – Raung, Java 8.1S 114.0E 5(?)
1600 1 Huaynaputina, Peru 16.6S 70.9W 6(?)
1640 3 Komaga-Take, Japan 42.1N 140.7E 5
1641 1 Parker, Philippines§ 6.1N 124.9E 6
1660C – Long Island, New Guinea 5.4S 147.1E 6
1663 3 Usu, Japan 42.5N 140.8E 5
1667 4 Shikotsu (Tarumai), Japan 42.7N 141.3E 5
1673 2 Gamkonora, Halmahera 1.4N 127.5E 5(?)
1680 – Tongkoko, Sulawesi 1.5N 125.2E 5(?)
1707 1 Fuji, Japan 35.4N 138.7E 5
1739 3 Shikotsu (Tarumai), Japan 42.7N 141.3E 5
1800D 1 St Helens, Washington, US 46.2N 122.2W 5
1815 2 Tambora, Lesser Sunda Is 8.3S 118.0E 7
1835 1 Cosiguina, Nicaragua 13.0N 87.6W 5
1853 1 Chikurachki, Kurile Is 50.2N 155.0E 5(?)
1854 1 Sheveluch, Kamchatka 56.7N 161.4E 5
1883 3 Krakatau, west of Java 6.1S 105.4E 6
1886 3 Okataina (Tarawera), New Zealand 38.1S 176.5E 5
1902 4 Santa Maria, Guatemala 14.8N 91.6W 6(?)
1907 2 Ksudach, Kamchatka 51.8N 157.5E 5
1912 1 Novarupta (Katmai), Alaska 58.3N 155.2W 6
1932 2 Azul, Cerro (Quizapu), Chile 35.7S 70.8W 5(+)
1956 2 Bezymianny, Kamchatchka 56.0N 160.6E 5
1980 2 St Helens, US 46.2N 122.2W 5
1982 2 El Chichon, Mexico 17.4N 93.2W 5
1991 3 Pinatubo, Philippines 15.1N 120.4E 6
...
*C refers to an uncorrected radiocarbon-based estimate; D indicates a dendrochronological date.
† Where known, are indicated as follows: 1, Dec.–Feb. 2, Mar.–May, 3, Jun.–Aug., 4, Sep.–Nov.
‡ Volcanic explosive index as listed in ref.14. The scale is logarithmic and values of 6 and over are here indicated in bold. In the original ref.14, (?) indicates a problematic assignment while a (+) indicates an eruption in the upper third of the range for that designation.
§ This eruption is apparently wrongly attributed in ref. 14 to Awu (Indonesia) as the result of an incorrect second-hand report in 1860, and is here given a larger VEI (C. Newhall, personal communication).
8
century (11) than in any of the other five centuries of our record (for which frequencies ranged between 1 and 7).
The only other known large eruption in the past 600 years (VEI 6) to which we have not yet made reference is Billy Mitchell, southwest Pacific. This is listed14 with an uncorrected radiocarbon age of 1580620, which, when corrected, could give a date anywhere in the range 1480–1640, though with more likelihood of a date around 150035. There are two candidates for the corresponding signal in our record: 1495 (rank 23) and 1587 (17). Both have apparent equiva- lents in at least one Antarctic core17and 1587 is listed as an acid event in one Greenland ice core (though an earlier,1570 event is ascribed to Billy Mitchell)16.
Besides large individual eruptions, our data show how closely spaced multiple eruptions can reduce hemisphere temperatures on decadal and multi-decadal timescales, as occurred in the mid- fifteenth century, the 1640s, 1660s and 70s, 1690s and the 1810s.
The apparent cluster of possible eruptions in the seventeenth century, suggested by our data, perhaps in combination with lower solar irradiance, may have been a contributing factor in the extended hemispheric cooling that occurred at that time36. M
. . . .
Methods
Each of the 383 individual ‘site’ chronologies (Fig. 2) is the average of absolutely dated time-series of annual maximum latewood density measurements from multiple cores sampled from within different trees. Each constituent series is first transformed into dimensionless indices by taking residuals from a general- ized exponential fit through the raw data. Each site chronology was normalized so that it had zero mean and unit standard deviation overAD1901–40 (see ref. 2 for more details). All chronologies cover at least the period 1891–1973 but many are much longer (for example, there are 287 back to 1800, 159 to 1700, 75 to 1600 and 8 back to 1400).
Two hemispheric mean timeseries were constructed from these data, covering the period 1400–1994. NHD1 was formed as the average of 8 prior regional average series (the regions are shown in Fig. 2), while NHD2 is the direct average of all 383 chronologies. When averaging, the sample size (n) is time-dependent and increased variance in parts of the average series would normally arise because of a diminishing number of constituent chronologies.
The effect was corrected for in all three averaging stages (that is, to regions, to NHD1 or to NHD2) by scaling the mean series by the square root of the effective number (n9) of independent samples available (refs. 2, 37) where n9¼n=½1þ ðn21Þ¯rÿ: herer¯is the mean interseries correlation between then available samples, a measure of the common growth forcing ‘signal’.
Series NHD1 is preferred, because the two-stage averaging reduces any bias that NHD2 might have towards a region with a large number of chronologies.
Nevertheless, it would be incorrect to average the regional time-series together on an equal basis when one series is based on very few chronologies, so the regional series were first weighted by their expressed population signal, EPS (ref. 38). EPS measures the extent to which an average time-series of a finite number of sample series approximates the theoretical population average (that is, infinitely replicated) time-series (EPS¼n9¯r). If the time-dependent sample is very small, the time-dependent EPS will be low and the region will be given a lower weighting. Both NHD1 and NHD2 were then normalized with respect to their means and standard deviations over the 1881–1960 period.
To derive the correlations between the density series and large-scale temperature averages cited in the text, we compared the NHD1 series with two instrumental temperature time-series, both the average of summer monthly means for April–September (ref. 9) over the period 1881–1960. We note that the period after 1960 was not used, as stated in the main text, because of concern over a recent possibly anthropogenic decline in hemispheric-average tree-ring density (ref. 2). One of the temperature series was the average only of NH grid-box series corresponding to the locations of the chronologies (NHCT), again variance corrected for reduced data in the early record. The other temperature series is the published average of all available data (land and marine) in the NH (NHLMT)9.
To assess the likely strength of temperature response in the earlier sections of our density series, where the sample of chronologies is considerably smaller, we rebuilt NHD1 and NHD2 but using a number of ‘fixed grids’ based on the
specific samples available back to certain years. The NHD2 series, constructed using just the 287 chronologies that extend back to 1800, correlates with NHCT (over 1881–1960) at 0.73 and with NHLMT at 0.55. Using the reduced samples extending back to at least 1700, 1600 and 1400 yields correlations of 0.63, 0.44 and 0.42 against NHCT, and 0.46, 0.35 and 0.32 with NHLMT. Correlations for NHD1 are as good or better and we expect that the relationships for extreme values would be stronger.
We have produced approximate estimates of NH mean summer temperature anomalies (Table 1 and Fig. 1) based on our NHD1 series by regressing it against NHLMT (adjusted to be anomalies from the 1881–1960 mean). This provides temperature anomalies with 95% confidence limits of,60.38C.
Received 13 October 1997; accepted 31 March 1998.
1. Schweingruber, F. H. & Briffa, K. R. inClimate Variations and Forcing Mechanisms of the Last 2000 Years(eds Jones, P. D., Bradley, R. S. & Jouzel, J.) 43–66 (Springer, Berlin, 1996).
2. Briffa, K. R.et al. Reduced sensitivity of recent tree-growth to temperature at high northern latitudes.
Nature391,678–682 (1998).
3. Briffa, K. R., Jones, P. D. & Schweingruber, F. H. Summer temperatures across northern North America: regional reconstructions from 1760 using tree-ring densities.J. Geophys. Res.99(D12), 25835–25844 (1994).
4. Briffa, K. R., Jones, P. D. & Schweingruber, F. H. Tree-ring reconstructions of summer temperature patterns across western North America since 1600.J. Clim.5,735–754 (1992).
5. Jones, P. D., Briffa, K. R. & Schweingruber, F. H. Tree-ring evidence of the widespread effects of explosive volcanic eruptions.Geophys. Res. Lett.22,1333–1336 (1995).
6. Bradley, R. S. & Jones, P. D. inClimate Since A.D. 1500(eds Bradley, R. S. & Jones, P. D.) 606–622 (Routledge, London, 1992).
7. Cole-Dai, J., Mosley-Thompson, E. & Thompson, L. G. Annually resolved southern hemisphere volcanic history from two Antarctic ice cores.J. Geophys. Res.102,16761–16771 (1997).
8. Crowley, T. J., Criste, T. A. & Smith, N. R. Reassessment of Crete (Greenland) ice core acidity/
volcanism link to climate change.Geophys. Res. Lett.20,209–212 (1993).
9. Jones, P. D. & Briffa, K. R. Global surface air temperature variations during the twentieth century: Part 1, spatial, temporal and seasonal details.Holocene2,165–179 (1992).
10. Lamb, H. H. Volcanic dust in the atmosphere; with a chronology and assessment of its meteorological significance.Phil. Trans. R. Soc. Lond. A266,425–553 (1970).
11. Newhall, G. C. & Self, S. The Volcanic Explosivity Index (VEI): an estimate of explosive magnitude for historical volcanism.J. Geophys. Res.87,1231–1238 (1982).
12. Robock, A. & Free, M. P. inClimatic Variations and Forcing Mechanisms of the Last 2000 Years(eds Jones, P. D., Bradley, R. S. & Jouzel, J.) 533–546 (Springer, Berlin, 1996).
13. Harington, C. R. (ed.)The Year Without a Summer?(Canadian Museum of Nature, Ottawa, 1992).
14. Simkin, T. & Siebert, L.Volcanoes of the World2nd edn (Geoscience, Tucson, 1994).
15. Hammer, C. U., Clausen, H. B. & Dansgaard, W. Greenland ice sheet evidence of post-glacial volcanism and its climatic impact.Nature288,230–235 (1980).
16. Zielinski, G. A.et al. Record of volcanism since 7000 B.C. from the GISP2 Greenland ice core and implications for the volcano-climate system.Science264,948–952 (1994).
17. Moore, J. C., Narita, H. & Maeno, N. A continuous 770-year record of volcanic activity from East Antarctica.J. Geophys. Res.96,17353–17359 (1991).
18. Delmas, R. J., Kirchner, S., Palais, J. M. & Petit, J. R. 1000 years of explosive volcanism recorded at the South Pole.Tellus B44,335–350 (1992).
19. Langway, C. C. Jr, Osada, K., Clausen, H. B., Hammer, C. U. & Shoji, H. A 10-century comparison of prominent volcanic events in ice cores.J. Geophys. Res.100,16241–16247 (1995).
20. Morgan, V. I.et al. Site information and initial results from deep ice drilling on Law Dome, Antarctica.
J. Glaciol.43,3–10 (1997).
21. Dai, J. E., Mosley-Thompson, E. & Thompson, L. G. Ice core evidence for an explosive tropical eruption 6 years preceding Tambora.J. Geophys. Res.96,17361–17366 (1991).
22. Self, S., Rampino, M. R. & Carr, M. J. A reappraisal of the 1835 eruption of Cosigu¨ina and its atmospheric impact.Bull. Volcanol.52,57–65 (1989).
23. Scuderi, L. C. Tree-ring evidence for climatically effective volcanic eruptions.Quat. Res.34,67–85 (1990).
24. Zielinski, G. A. Stratospheric loading and optical depth estimates of explosive volcanism over the last 2100 years derived from the Greenland ice sheet Project 2 ice core.J. Geophys. Res.100,20937–20955 (1995).
25. Palais, J. M., Kirchner, S. & Delmas, R. J. Identification of some global volcanic horizons by major elemental analysis of fine ash in Antarctic ice.Ann. Glaciol.14,216–220 (1990).
26. Thompson, L. G., Mosley-Thompson, E., Dansgaard, W. & Grootes, P. M. The Little Ice Age as recorded in the stratigraphy of the tropical Quelccaya Ice Cap.Science234,361–364 (1986).
27. de Silva, S. L. & Zielinski, G. A. Global influence of theAD1600 eruption of Huaynaputina, Peru.
Nature393,455–458 (1998).
28. Robin, C., Monzier, M. & Eissen, J.-P. Formation of the mid-fifteenth century Kuwae caldera (Vanuatu) by an initial hydroelastic and subsequent ignimbritic eruption.Bull. Volcanol.56,170–
183 (1994).
29. Monzier, M., Robin, C. & Eissen, J.-P. Kuwae (1425AD): the forgotten caldera.J. Volcanol. Geotherm.
Res.59,207–218 (1993).
30. Pang, K. D. Climate impact of the mid-fifteenth century Kuwae caldera formation, as reconstructed from historical and proxy data.Eos(Fall Suppl.)74(43),106 (1993).
31. LaMarche, V. C. & Hirschboeck, K. K. Frost rings in trees as records of major volcanic eruptions.
Nature307,121–126 (1984).
32. Delfin, F. G. Jret al. Geological,14C, and historical evidence for a 17th century eruption of Parker volcano, Mindanao, Philippines.J. Geol. Soc. Philippines52,25–42 (1997).
33. Blong, R. J.The Time of Darkness(Australian Nat. Univ. Press, Canberra, 1982).
34. Oldfield, F., Appleby, P. G. & Thompson, R. Palaeoecological studies of lakes in the highlands of Papua New Guinea. I. The chronology of sedimentation.J. Ecol.68,457–477 (1980).
35. Stuiver, M. & Becker, B. High-precision decadal calibration of the radiocarbon time scale, A.D. 1950–
6000 B.C.Radiocarbon35,35–65 (1993).
36. Lean, J., Beer, J. & Bradley, R. Reconstruction of solar irradiance since 1610: Implications for climatic change.Geophys. Res. Lett.22,3195–3198 (1995).
37. Osborn, T. J., Briffa, K. R. & Jones, P. D. Adjusting variance for sample-size in tree-ring chronologies and other regional-mean timeseries.Dendrochronologia15,(in the press).
38. Briffa, K. R. inAnalysis of Climatic Variability: Applications of Statistical Techniques(eds von Storch, H.
& Navarra, A.) 77–94 (Springer, Berlin, 1995).
Nature © Macmillan Publishers Ltd 1998
8
Supplementary Informationis available onNature’s World-Wide Web site (http://www.nature.com) or as paper copy from the London editorial office ofNature.
Acknowledgements.The current development of the Northern Hemisphere densitometric network is funded by the Swiss National Science Foundation (F.H.S.) and the European Community under ADVANCE-10K (K.R.B.). P.D.J. is supported by the US Department of Energy, and T.J.O. by NERC.
We thank E. Cook, T. Crowley, M. Free, V. Morgan, E. Mosley-Thompson, C. Newhall, F. Oldfield, A.
Robock and S. Self for advice and data.
Correspondence and requests for materials should be addressed to K.R.B. (e-mail: k.briffa@uea.ac.uk).
Global influence of theAD1600 eruptionofHuaynaputina,Peru
Shanaka L. de Silva*& Gregory A. Zielinski†
*Department of Geography, Geology, and Anthropology, Indiana State University, Terre Haute, Indiana 47809, USA
†Climate Change Research Center, University of New Hampshire, Durham, New Hampshire 03824-3525, USA
. . . .
It has long been estabished that gas and fine ash from large equatorial explosive eruptions can spread globally, and that the sulphuric acid that is consequently produced in the stratosphere can cause a small, but statistically significant, cooling of global temperatures1,2. Central to revealing the ancient volcano–climate connection have been studies linking single eruptions to features of climate-proxy records such as found in ice-core3–5and tree- ring6–8 chronologies. Such records also suggest that the known inventory of eruptions is incomplete, and that the climatic significance of unreported or poorly understood eruptions remains to be revealed. The AD1600 eruption of Huaynaputina, in southern Peru, has been speculated to be one of the largest eruptions of the past 500 years; acidity spikes from Greenland and Antarctica ice3–5, tree-ring chronologies6–8, along with records of atmospheric perturbations in early seventeenth-century Europe and China9,10, implicate an eruption of similar or greater magni- tude than that of Krakatau in 1883. Here we use tephra deposits to estimate the volume of the AD1600 Huaynaputina eruption, revealing that it was indeed one of the largest eruptions in historic times. The chemical characteristics of the glass from juvenile tephra allow a firm cause–effect link to be established with glass from the Antarctic ice, and thus improve on estimates of the stratospheric loading of the eruption.
Volcan Huaynaputina, located at 168359S, 708529W in the Moquegua region of southern Peru (Fig. 1), consists of three craters situated at 4,500 m within the amphitheatre of an ancient strato- volcano. A compilation of historical and parochial literature11 reveals that the volcano formed during an eruption that began on 19 February 1600 and continued until 5 March. The fall deposit covered an area of at least 300,000 km2in southern and west central Peru, western Bolivia and north Chile (Fig. 1). Ashfall was reported on the major cities of Lima, La Paz (Bolivia) and Arica (Chile) as well as on a ship 1,000 km to the west11. The fall seems to have been
distributed predominantly to the west and north. Local proximal pyroclastic flows and secondary mass flows were insignificant in volume. This large plinian eruption destroyed local communities with a loss of over 1,000 lives and caused considerable damage to the major cities of Arequipa and Moquegua. The loss of farmland, crops, livestock, vineyards, and water resources compounded the significant economic burden on this region. The whole socio- economic infrastructure of a large part of Peru, and maybe that of
1
5
1020 50 Arequipa 100
Huaynaputina
Arica Lake Titicaca
Moquegua
Pacific Ocean 15°S
16°
17°
18°
74° 73° 72° 71° 70° 69°W
Misti Ubinas Sabancaya
Ticsani
Known distribution of ashfall from historic accounts
o 100km
1 10 100 1000 10000
0 200 400 600 800
√A (km)
T (cm)
4.32 km
14.6 km 0.23 km3
3
3
Lima
Chile Bolivia Peru
Enlarged area
La Paz
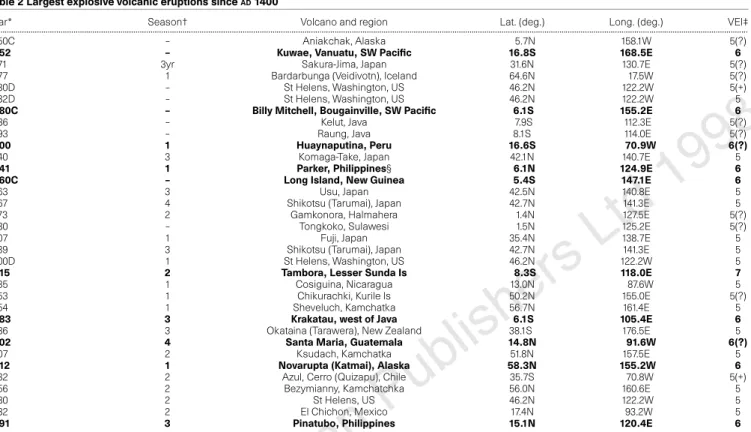
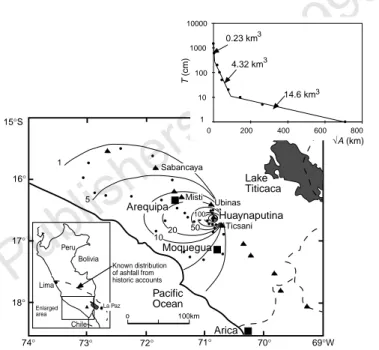
Figure 1Isopach map of Huaynaputina tephra deposit showing the strong westerly distribution of the deposit. Black triangles are volcanoes of the modern volcanic arc and the most recently active are labelled; small dots are data points.
Volcan Ticsani, the site of a similar but smaller eruption to Huaynaputina, is also shown. Values associated with contours are in centimetres; two innermost contours not labelled are 200 and 600 cm respectively, and the 1,500 cm contour is covered by the symbol for the volcano. The graph in the upper right corner shows a plot of thickness (T) on a logarithmic scale against the square root of isopach area31,32. The thickness data are described by three line segments that define a typical exponential profile. Integration beneath the line segments with respect to area, following the method of Fierstein and Nathenson32, and removing the volume achieved by extrapolating the data to zero thickness31, yields the volumes noted for each segment and the minimum volume of tephra of 19.2 km3. Negative error in this estimate is limited to measurement and area estimation errors and is ,10% for this data set. Positive errors far outweigh this, as discussed in the text.
Inset (bottom left) shows the known distribution of the fall from theAD1600 eruption (broken line) based on a compilation of parochial and historical accounts11. The box in the inset shows the area covered in the larger map. Note that our data cover only a small portion of the known distribution of theAD1600 tephra fall, albeit along the main axis. As most of the distal tephra has been lost, a considerable volume of distal tephra cannot be measured.
Table 1 Main oxide composition of individual juvenile clasts and volcanic glass from the Huaynaputina eruption compared with tephra from the early 1600s of the Antarctica and Greenland ice cores
Huaynaputina bulk rock*
(21 samples)
Huaynaputina glass*
(n¼103; 6 samples)
Huaynaputina glass†
(n¼7)
South Pole glass†
(n¼16)
GISP2 glass*
(n¼16) ...
SiO2 65:1660:70 72:8260:68 75:7660:53 72:9262:04 62:164:7
TiO2 0:5860:03 0:2660:20 0:2760:06 0:3460:20 1:160:5
Al2O3 16:6860:40 15:2061:21 13:8560:15 13:9860:91 16:262:5
FeO 3:9760:17 1:3160:25 1:1060:14 1:3760:28 8:263:5
MgO 1:7860:12 0:3060:13 0:2760:14 0:4460:20 1:961:0
CaO 3:8860:17 1:6160:32 1:2260:07 1:4160:35 3:961:7
Na2O 4:5760:09 4:5360:34 3:4360:24 4:1260:73 4:061:1
K2O 2:7960:15 3:8260:18 3:8960:15 3:7660:28 2:560:9
...
Errors are 1j. n= number of individual analyses. Bulk rock analyses are of juvenile clasts from proximal and medial locations.
*This study.
†From ref. 16.