eas and academic debate. orking Papers series does not constitute publication and should not limit publication in any other venue. Copyright remains with the authors.
GIGA Research Programme:
Violence and Security
___________________________
The Impact of Fuel Ownership on Intrastate Violence
Tim Wegenast
No 225 May 2013
Edited by the
GIGA German Institute of Global and Area Studies Leibniz‐Institut für Globale und Regionale Studien
The GIGA Working Papers series serves to disseminate the research results of work in progress prior to publication in order to encourage the exchange of ideas and academic debate. An objective of the series is to get the findings out quickly, even if the presenta‐
tions are less than fully polished. Inclusion of a paper in the GIGA Working Papers series does not constitute publication and should not limit publication in any other venue. Copy‐
right remains with the authors. When working papers are eventually accepted by or pub‐
lished in a journal or book, the correct citation reference and, if possible, the corresponding link will then be included on the GIGA Working Papers website at
<www.giga‐hamburg.de/workingpapers>.
GIGA Research Programme “Violence and Security”
Copyright for this issue: © Tim Wegenast
WP Coordination and English‐language Copy Editing: Errol Bailey Editorial Assistance and Production: Silvia Bücke
All GIGA Working Papers are available online and free of charge on the website
<www.giga‐hamburg.de/workingpapers>.
For any requests please contact:
E‐mail: <workingpapers@giga‐hamburg.de>
The GIGA German Institute of Global and Area Studies cannot be held responsible for errors or any consequences arising from the use of information contained in this Working Paper; the views and opinions expressed are solely those of the author or authors and do not necessarily reflect those of the Institute.
GIGA German Institute of Global and Area Studies Leibniz‐Institut für Globale und Regionale Studien Neuer Jungfernstieg 21
20354 Hamburg Germany
E‐mail: <info@giga‐hamburg.de>
Website: <www.giga‐hamburg.de>
Abstract
The impact of natural resources on intrastate violence has been increasingly analyzed in the peace and conflict literature. Surprisingly, little quantitative evidence has been gath‐
ered on the effects of the resource‐ownership structure on internal violence. This paper uses a novel dataset on oil and natural gas property rights covering 40 countries during the pe‐
riod 1989–2010. The results of regression analyses employing logit models reveal that the curvilinear effect between hydrocarbon production and civil conflict onset – often found in previous studies – only applies to countries in which oil and gas production is mainly state controlled. The findings suggest that only state‐owned hydrocarbons may entail peace‐
buying mechanisms such as specific clientelistic practices, patronage networks, welfare poli‐
cies, and/or coercion. At the same time, it seems that greed and grievance are more pro‐
nounced whenever resources lie in the hands of the state. Exploring the within‐country vari‐
ation, further analyses reveal that divergent welfare spending patterns are likely to be one causal channel driving the relationship between resource ownership and internal violence.
Keywords: Natural resources, intrastate conflict, minor civil war, oil, gas, ownership struc‐
ture, national oil companies.
This paper was developed in the context of the research project “Governing the Resource‐
Violence Nexus (GRVN): Commodity Management and Internal Violence” funded by the German Research Foundation.
Dr. Tim Wegenast
is a postdoctoral fellow at the Department of Politics and Public Administration at the University of Konstanz and a research associate at the GIGA German Institute of Global and Area Studies.
Contact: <tim.wegenast@giga‐hamburg.de>
Website: <http://staff.en.giga‐hamburg.de/wegenast>
Tim Wegenast
Article Outline 1 Introduction
2 Review of the Research on Natural Resources, Domestic Stability, and Civil Wars 3 Bringing Ownership into the Debate
4 Empirical Analysis 5 Empirical Findings 6 Conclusions References
1 Introduction
In recent years, the peace and conflict literature has increasingly concentrated on natural re‐
sources as a potential source for intrastate conflict.1 The juxtaposition of “greed” and “griev‐
ance” in Collier and Hoeffler’s (2004) seminal work, for example, suggests that a resource‐
related opportunity structure and group‐related grievances may explain the onset of internal violence. Territorial, separatist civil wars in Indonesia, Nigeria, and Sudan as well as gov‐
ernmental conflicts in Angola, Republic of Congo, and Sierra Leone seem to confirm the de‐
1 I would like to thank Matthias Basedau for his insightful comments on earlier drafts of this manuscript as well as Constantin Ruhe, Laura Albarracin and Maik Maerten for their excellent research assistance.
stabilizing effect of specific natural resources. Oil, gas, and diamonds, in particular, have been found to promote intrastate conflict in various analyses (see Fearon and Laitin 2003;
Hegre and Sambanis 2006; Ross 2006; Dixon 2009; Lujala 2010).
While several resource‐rich countries have indeed experienced deadly conflicts, the role of commodities as a promoter of violence is still contested. Le Billon (2010), for example, finds that oil‐producing states in Africa have not been more susceptible to civil wars than non‐oil‐producing states. Some studies maintain that previous findings linking resources to domestic conflict may be a product of spurious correlation. Brunnschweiler and Bulte (2008) and Thies (2010), for example, find no direct link between these two variables. Other authors claim that oil may even be associated with domestic stability and lower levels of violence (Smith 2004; Basedau and Lay 2009; Brunnschweiler and Bulte 2009).
As evidenced, the relationship between certain natural resources and conflict is still am‐
biguous and ill understood. Given the range of alternative of findings, studies have started to focus more intensely on the specific risks leading to violence within a resource‐rich environ‐
ment (e.g. Le Billon 2010; Basedau and Richter 2011). One important explanatory variable, however, has been largely ignored by the present quantitative literature: resource ownership.
Although many of the explanations for the resource‐conflict nexus rely on ownership pat‐
terns, distributional conflicts, and/or rentier‐state mechanisms, empirical analyses have drawn exclusively on rough measures of resource abundance or resource dependence with‐
out actually accounting for ownership.
Utilizing a novel dataset on oil and gas ownership, this paper argues that information on who owns the commodities within a country may advance our understanding on the re‐
source‐violence link. It seems plausible to assume that only state‐owned hydrocarbons may entail peace‐buying mechanisms by filling governments’ coffers, giving way to clientelistic practices, granting more fiscal autonomy, and reducing the legitimation pressure faced by the state. Through public oil companies, governments may also spend more on coercion or large‐scale redistribution policies. At the same time, public oil money may exacerbate politi‐
cal competition for access to the key bodies responsible for managing resource‐revenue dis‐
tribution. By offering selective incentives in the form of future material rewards, it may facili‐
tate the mobilization of insurgents and promote violence.
This paper tests whether ownership patterns of hydrocarbons – namely, whether oil and gas are state or privately owned – affect the potential for conflict within countries by employ‐
ing logit estimations on pooled time‐series, cross‐sectional data. The regression analyses re‐
veal that the curvilinear effect between per capita hydrocarbon production and civil war on‐
set – often found in previous studies – only applies to countries in which oil and gas produc‐
tion is mainly state controlled. A further statistical analysis finds that within‐country differ‐
ences in patterns of welfare spending may partly explain why only state‐owned hydrocar‐
bons are associated with an increased – or decreased – conflict potential.
The rest of this paper proceeds as follows: The next section reviews the existing literature on the impact of natural resources on domestic stability and internal violence. The paper’s main argument is presented in the third section, shedding light on how the resource‐owner‐
ship structure influences the risk of civil war onset. The quantitative research design em‐
ployed for this study is described in the fourth section, which is followed by the paper’s quantitative findings in the fifth section. The sixth and final section presents the conclusion and highlights areas that require further research.
2 Review of the Research on Natural Resources, Domestic Stability, and Civil Wars
Influenced by the research of Paul Collier and Anke Hoeffler, a growing body of literature has advanced our knowledge on the relationship between natural resource abundance and conflict propensity. According to many authors, primary commodities often increase the risk of civil war by providing insurgents with the opportunity to finance large‐scale violence and making warfare militarily feasible (Le Billon 2001; Collier and Hoeffler 2004). Resources may also provide the motive to take up arms due to resource‐related grievances such as forced migration, ecological distress, environmental damage, and the withholding of resource reve‐
nue. Costs and benefits related to resource extraction may be the driving forces of conflict (see e.g. de Soysa 2002; Ross 2003; Collier and Hoeffler 2004). In fact, Lujala (2010) shows that resources may provide an important incentive and opportunity structure for rebel groups.
Other authors claim that resources have a more indirect impact on conflict. First, re‐
sources may instigate predatory rent‐seeking behavior, which simultaneously reduces the quality of institutions’ and states’ counterinsurgency capacities (see e.g. Fearon and Laitin 2003; Fearon 2005; Humphreys 2005). Second, resource production may create economic and social grievances resulting from resource‐related–terms‐of‐trade shocks, currency apprecia‐
tions, and increasing inequalities (Ross 2003, 2004, 2012).2
In recent years, the resource‐conflict link has increasingly been questioned. Authors stress the need to examine the precise conditions under which primary commodities act as a catalyst for violence (e.g. Collier and Hoeffler 2005; Humphreys 2005; Basedau and Wegenast 2009). Contextual conditions identified in the literature include the characteristics of the available resource (Ross 2003; Dunning 2005; Snyder and Bhavnani 2005), the mode of ex‐
traction of the commodities in question (Lujala et al. 2005), and the point in time in which revenues arrive (Humphreys 2005). Le Billon (2001, 2008) stresses the lootability of resources, noting that the exploitation of “diffuse” and “distant” resources like alluvial diamonds, allu‐
vial gold, or drugs cannot be controlled by central governments – thus, they are more loot‐
able for rebels. Lujala (2010) finds that oil only increases the likelihood of conflict onset when it is produced in a more lootable manner – that is, onshore instead of offshore.
2 For an overview of the possible mechanisms driving the relationship between natural resources and civil war onset, see Humphreys (2005), Ross (2004, 2006), and Le Billon (2008).
Other authors point to the fact that a country’s resource abundance and dependence are not identical and have different implications for the risk of civil war (Ross 2006; Basedau and Lay 2009). The sociopolitical environment within resource‐abundant states might also pose specific risks. As shown by some authors, relations between identity groups (Sorens 2011;
Wegenast and Basedau 2012) and the institutional framework – such as the electoral system (Wegenast 2013) – may interact with natural resources and influence the likelihood of conflict.
The rentier state theory (Luciani 1987) – often omitted in the debate over the resource‐
conflict link – provides an important theoretical framework to assess countries’ potential for civil violence. Oil‐rich countries are often perceived as distributive states, where govern‐
ments are mainly concerned with the internal distribution of rents (see Karl 1997). High in‐
comes from resources such as oil and gas may allow states to employ peace‐buying mecha‐
nisms such as repression, redistribution policies, low taxation, social benefits, political cor‐
ruption, and/or patronage.
Political corruption can foster domestic peace within oil‐wealthy countries, where private privilege is offered in exchange for political loyalty and to accommodate the opposition (Fjelde 2009). Arezki and Brückner (2009) argue that in countries with a high share of state participation in oil production, oil rents have a significant effect on corruption, and there is no threat to state stability. In addition to the possibility of buying the consent of key seg‐
ments of society, large oil rents are often used to increase states’ military and counterinsur‐
gency capacities. These rents may provide a readily available pool of funding for military equipment and personnel (Karl 2004).
Governments of resource‐abundant countries are also not heavily dependent on taxes as a source of state income, meaning citizens may face a lower tax burden (Humphreys 2005).
Morrison (2008) finds that nontax revenue such as oil is associated with lower taxation of the elite in democracies, higher social spending in dictatorships, and more regime stability over‐
all (see also de Mesquita and Smith 2010). Furthermore, resource rents may be employed to finance social programs and projects, assuring regime legitimacy and citizens’ support. Of‐
ten, resource income is used to distribute material benefits throughout society (see, e.g., Heydemann 2004). According to Herb (2005: 297), rich rentier states often use oil rents to cre‐
ate a larger middle class or pay for schoolteachers. Gary and Karl (2003) emphasize that un‐
der fair, accountable, and transparent conditions, oil revenues become a blessing that facili‐
tates socioeconomic development rather than a curse.
Some authors have emphasized that the impact of resources on intrastate conflict onset may be contingent on the degree of resource dependence or abundance. Collier and Hoeffler (1998), for example, find that resource dependence (as measured by the ratio of primary ex‐
ports to GDP) has a curvilinear effect on the onset of civil war. This finding has been corrob‐
orated by Basedau and Lay (2009),3 who also show that high levels of oil abundance (as
3 This finding is contested by Brunnschweiler and Bulte (2009: 655), who find that resource dependence is “an endogenous variable in conflict regressions, and that properly accounting for this endogeneity removes the
measured by total per capita oil production) reduce the risk of internal violence (see also Brunnschweiler and Bulte 2009). The authors rely on the concept of the rentier state to ex‐
plain their findings.
Drawing on the studies cited above, this paper shows that the effect of oil abun‐
dance/dependence on civil war onset is largely dependent on oil ownership patterns. For several reasons, which are outlined in the next section, the curvilinear effects found in previ‐
ous research only apply to countries in which hydrocarbon production lies mainly in the hands of the state. By shedding light on the conditions under which resources may promote or prevent internal violence, this paper provides more clarity to an ill‐understood research field characterized by contradictory findings.
3 Bringing Ownership into the Debate
As is evident from the literature review above, authors frequently refer to state‐owned re‐
sources when trying to assess a country’s risk of facing internal instability. Various explana‐
tions of the resource‐conflict nexus – such as the deterioration of political institutions and state capacity, the ability to repress, the provision of social benefits and redistributive poli‐
cies, the motive mechanism, and the enforcement of clientelist rule – assume that large oil re‐
serves serve to fill state coffers.
In spite of the apparent pivotal role of resource ownership for internal violence onset, it is rather surprising that – most likely due to the lack of appropriate data – studies have failed to include ownership patterns when operationalizing and testing their advocated mechanisms.
Authors have largely relied on rough measures of abundance such as per capita resource pro‐
duction or rents4 and resource dependence (e.g., the share of natural resources in total exports).
However, countries vary in terms of the ownership patterns of their main resources (see e.g, Luong and Weinthal 2006; 2010). Although states such as Angola, Bahrain, China, Canada, Iran, Mexico, Nigeria, Saudi Arabia, Australia, and Russia all exhibit a high level of hydro‐
carbon production, government ownership rights over these resources differ greatly between these countries.5 The empirical reality shows that ownership structures vary greatly both within and across mineral‐rich states over time (see Luong and Weinthal 2010). It seems rea‐
sonable to assume that the conflict‐enhancing or stabilizing effects of natural resources partly depend on the extent to which governments effectively own the extracted commodities.
positive statistical association between dependence and conflict onset.” The authors stress that conflict in‐
creases dependence on resource extraction.
4 Resource rents are commonly measured by the price minus average extraction costs times the amount of re‐
sources extracted (see e.g. De Soysa and Neumayer 2007).
5 While Canadian and Australian oil and gas production is nearly entirely privately owned, governments in Bahrain, Iran, Mexico, and Saudi Arabia retain 100 percent ownership over these resources. The ownership pattern in the four remaining countries is mixed.
This paper maintains that only oil and gas production lying in the hands of the state – as opposed to privatized hydrocarbon production – has a direct impact on a country’s internal conflict potential. At least two fundamental differences exist between nationalized and pri‐
vatized resource sectors that may explain a country’s risk of experiencing the onset of civil war: the quantity of steady, nontax government revenue provided by state‐owned compa‐
nies and the varying degree of transparency and accountability that exist between public and private hydrocarbon sectors.
Compared to private oil and gas firms, national companies may provide a higher amount of nontax income to governments. For example, Guriev et al. (2011) show that nationaliza‐
tions of the hydrocarbon sector occur primarily when oil and gas prices are high, since gov‐
ernments expect higher state revenues (see also Friedman 2006). Mahdavy (2011: 5) also ar‐
gues that governments in oil‐producing countries may “seek access to more petroleum reve‐
nues and nationalization is perceived as a great step forward from having to tax foreign oil companies.” However, unlike Guriev et al. (2011), Mahdavy (2011) demonstrates that nation‐
alizations are rather a cause and not a consequence of price spikes. This finding is confirmed by Ludwig (2012: 1), who shows that “the shift from private towards state‐owned oil domi‐
nance in the 1970s gave rise to a delayed increasing oil price path.”
According to Kennedy and Tiede (2011), many oil nationalizations were justified by what countries believed were unstable or low oil prices. The authors argue that strategic control over oil and linkage to the domestic economy is more important in explaining nationaliza‐
tion. Mexico, for example, blamed the international oil companies (IOCs) for low oil prices before nationalizing its oil industry (Yergin 2008: 255). Andersen and Ross (2012) note that most oil‐producing autocracies nationalized in the 1970s and started to collect the rents that previously went to the IOCs.6 As a consequence, the size of government revenues grew con‐
siderably (see also Ross 2012). According to Mommer (2002), nationalizations raised gov‐
ernments’ shares of oil profits from 50 percent in the early 1960s to 98 percent by 1974.
Besides possibly generating more direct income for the state, national oil companies (NOCs) are believed to be less transparent and accountable than private oil firms. Quinn (2008:84), for example, finds that “majority state ownership of the most important economic sectors of a country results in higher levels of corruption.” This finding is corroborated by Arezki and Quintyn (2009), who show that oil rents have a positive effect on corruption only in countries with a high share of state participation in oil production. Stevens (2008) reports on the lack of transparency that characterizes most of the NOCs. Al‐Mazeedi (1992: 988) notes that in the Middle Eastern NOCs, recruitment policies are influenced ‘‘to a great extent by tribal and religious considerations rather than qualifications, performance or personal attributes.”
NOCs are often used to accommodate the political opposition (e.g., through job patron‐
age) and buy political legitimacy. This lack of transparency allows rulers to use oil rents as a
6 Levy (1982) shows that, prior to this nationalization wave, the IOCs controlled almost all of the world’s petro‐
leum and used favourable contracts and transfer pricing to retain the biggest share of the rents for themselves.
tool for gaining greater control over the distribution of patronage (Ross 2012). State leaders have direct access to the revenues generated by the NOCs and may conceal the actual figures on oil revenue and spending from the public – for example, the budget of the Iraq National Oil Company was confidential. In countries such as Azerbaijan and Iraq, more than half of the governments’ budgets were funneled through their respective NOCs. Under private ownership arrangements, non–state actors are the direct claimants of the revenues generated from hydrocarbon productions. The primary interest of private actors is to maximize the profits on their investments in the oil sector. Generally speaking, private oil firms are more likely to be characterized by well‐defined managerial structures, objective criteria to measure company performance, and more transparency (Luong and Weinthal 2010: 56).
These two divergent characteristics (i.e., the size of government revenues and the degree of transparency and accountability) have implications for the peace‐buying and conflict‐
enhancing mechanisms inherent to resource production. Large nontax revenues over which governments have direct access as well as its nontransparent management may further the competition for control over the key bodies responsible for managing hydrocarbon revenues among state actors, thus increasing the risk for conflict.7 The prospect of capturing future oil or gas income may thereby act as a selective incentive that motivates individuals to partici‐
pate in political or armed conflict.8 The nontransparent management of revenues by NOCs may further motivate violence. As shown by Ross (2008), rebel groups often make exaggerat‐
ed claims about the amount of state‐owned oil rents. According to the author, more trans‐
parency could “reduce these misperceptions and undercut support for rebellion” (ibid: 206).9 Hydrocarbon production lying in the hands of private firms may certainly also bring about greedy intentions among different state actors. However, the prospect of amassing individual benefits through corruption or patronage is smaller. Also, if private actors dominate the oil and gas sector, communities are likely to be better informed about the real costs and benefits of mineral projects. Finally, the option of expropriating private hydrocarbon corporations usually comes at a high cost and entails risks (Guriev et al. 2011), while some countries may simply lack the know‐how to exploit hydrocarbons.
While the direct control over resource revenue and the lack of transparency associated with state ownership may further intrastate conflict, it may at the same time promote inter‐
nal stability. Large off‐budget petroleum revenues in the hands of the state are often em‐
7 Competition over state oil wealth has for example fueled violence between various ethnic groups in Nigeria.
According to Obi (2001: 173), the Nigerian state is “a site of constant struggles for access to power and re‐
sources, in which those in power defend themselves at any cost, and those outside seek entry at any cost and through any means.” Lewis (1994) goes as far as to characterize Nigerian politics simply as a process of com‐
petition for access to oil revenue.
8 Ross (2004) highlights the role of so‐called booty futures in order to finance rebellion in countries such as Li‐
beria, Sierra Leone, and the Republic of Congo.
9 Initiatives such as the Extractive Industries Transparency Initiative may be a helpful instrument to achieve more fiscal and budgetary transparency (see Ross 2008).
ployed to increase both patronage and pork‐barrel spending (e.g. Mahdavy1970; Luciani 1987). According to Andersen and Ross (2012: 12), many rulers “used their national oil com‐
panies to gain greater control over the distribution of patronage, and to cloak these transac‐
tions in secrecy.” Fjelde (2009) convincingly demonstrates that rulers of oil‐abundant states use corruption in order to offer private privilege in exchange for political loyalty and to ac‐
commodate the opposition, thereby ensuring domestic peace. Rents from oil or gas may also be employed to lower taxes and win “popular acquiescence through distribution” (Andersen 1987: 10).10
Finally, the unlimited and direct control over the resource sector may allow governments to invest in a large repressive apparatus and/or welfare policies. Indeed, some authors show that natural resources such as oil may increase social spending and internal stability (Morri‐
son 2009).11 Welfare spending is found to reduce the probability of civil war onset (Taydas and Peksen 2012), and NOCs, in particular, are believed to support the building of strong welfare states (Marcel and Mitchell 2006). Furthermore, hydrocarbons are often employed when building up a large military apparatus and deploying coercion (Karl 2004: 668;
Basedau and Lay 2009).12 Andersen and Ross (2012) demonstrate that the peace‐buying mechanisms reported above are more likely to produce regime stability when a country’s pe‐
troleum sector is state owned. The authors show that oil rents only foster autocratic stability when large waves of nationalization are taken into account in quantitative analyses.
As outlined above, the prevalence and applicability of the conflict‐promoting or peace‐
buying mechanisms inherent to rentier states may depend largely on the resource‐ownership structure. In accordance with some of the reviewed studies (Collier and Hoeffler 1998;
Basedau and Lay 2009; Brunnschweiler and Bulte 2009), this paper assumes that the quantity of resource revenue determines which of the two mechanisms will prevail. Intermediate lev‐
els of state‐owned oil and gas production are expected to increase the risk of civil war onset, while the impact of privately owned hydrocarbons on internal conflict is expected to be only marginal or nonexistent. High levels of state‐owned hydrocarbons, in contrast, are expected to reduce a country’s internal violence potential, whereas this conflict‐reducing effect is not expected where oil and gas are privately owned. By employing a novel and unique dataset on hydrocarbon ownership, the next section empirically tests these two hypotheses.
10 This is expressed in the phrase “no representation without taxation” commonly found in the rentier state lit‐
erature (e.g. Herb 2005).
11 Several studies find that oil rents are associated with regime stability of autocracies (e.g. Smith 2004; Ulfelder 2007; Andersen and Aslaksen 2013).
12 Fjelde and De Soysa (2009) find that high levels of government spending are more significant predictors of civil peace than are states’ coercive capacities.
4 Empirical Analysis
This empirical analysis employs time‐series, cross‐sectional data in order to find quantitative evidence for the two hypotheses presented above. The dependent variable is minor civil war onset as defined by the UCDP/PRIO Armed Conflict Dataset (Version 4‒2012) (see Gleditsch et al. 2002). The variable civil war onset takes the value of “1” if the threshold of 25 battle‐
related deaths has been crossed for the first time and “0” if no internal civil war has started in the year under consideration. In order to measure the key independent variable, this paper relies on our new Oil and Gas Ownership Structure (OGOS) dataset (see Wegenast et al.
2013). Until recently, the only existing cross‐national dataset on states’ property rights over hydrocarbon production was that developed by Luong and Weinthal (2010). Their work has considerably advanced our understanding of the importance of ownership patterns within the resource‐curse debate. They coded the ownership structure of 50 oil‐abundant develop‐
ing countries based on these countries’ “constitutions, official laws and regulations govern‐
ing the mineral sector, and (where available) mineral contracts” (ibid: 311). Four discrete cat‐
egories were drawn up: state ownership with control, state ownership without control, pri‐
vate domestic ownership, and private foreign ownership.
Our assessment of countries’ ownership structures differs from the one developed by Luong and Weinthal (2010) in several ways. Our data includes a wider range of countries from the developed and the developing world, focusing both on hydrocarbon abundance and dependence. In addition, our dataset also covers oil and gas production, instead of con‐
sidering only petroleum. The most important difference, however, is that we draw on actual hydrocarbon output figures to measure states’ ownership structures, whereas Luong and Weinthal (2010) rely exclusively on countries’ legislation. Our focus on output figures allows for a more precise and valid operationalization of ownership within the hydrocarbon sector.
Coding that relies exclusively on country legislation is more likely to measure the adoption of a certain ownership structure as opposed to its actual implementation. As suggested by Luong and Weinthal (2010: 9) themselves, a change in legislation signals the intent to alter the ownership structure but says little about whether such a change was successfully imple‐
mented. A final, and rather obvious, advantage of our data is that it provides numerical in‐
stead of categorical variables. Compared to Luong and Weinthal’s rather static dummy vari‐
ables, our data is capable of identifying smaller changes within countries’ ownership struc‐
tures over time.
In order to select our sample, we first included all countries that, taken together, account‐
ed for 99 percent of the world’s total oil and gas production during the period 1989–2010.13 In a second step, we selected those countries whose oil and gas exports made up at least 10 per‐
cent of their total exports on average for the given period. This procedure provided us with
13 Data on oil and gas production comes from Evaluate Energy, online: <www.evaluateenergy.com/>.
40 hydrocarbon‐abundant and/or hydrocarbon‐dependent states.14 Subsequently, we gath‐
ered information on the total production output of all oil and gas production firms within each country for the period under analysis. The main source for this information was Evalu‐
ate Energy, a service that provides information on the reported production volume for the majority of publicly quoted oil and gas companies within each state. While this database con‐
tains precise output figures for all‐important privately owned firms, it lacks information on NOCs’ hydrocarbon production within some countries for certain time periods.15 Thus, we further drew on the information provided by the country reports of the US Geological Sur‐
vey (USGS) to assess the importance of NOCs – vis‐à‐vis privately owned firms – within each country and year.16 As USGS reports contain estimates over the total market share of many NOCs, we were able to obtain the majority of missing values.17 In isolated cases, such as Rus‐
sia, we further relied on country‐specific studies.
Remaining deviations between a country’s total reported output and the sum of the pro‐
duction of its individual oil and gas firms has three main causes: nonreporting or underre‐
porting by NOCs, a lack of information on some very small privately owned firms, and the lack of exact participation shares of NOCs within joint ventures or production sharing agreements.18 Although these differences are marginal for most of the countries covered by our dataset, eight states lack reliable information on the companies operating within the hy‐
drocarbon sectors for several years: Azerbaijan, Bolivia, Equatorial Guinea, Indonesia, Ka‐
zakhstan, Libya, Syria, and Vietnam.19 For these countries, missing observations for various consecutive years could not be replaced by the information from the USGS.
As a final step, we integrated information about each firm’s property‐rights structure, which was taken from Energy Intelligence’s Petroleum Intelligence Weekly (PIW).20 PIW pub‐
lishes a compilation of the top one hundred hydrocarbon production firms (top fifty for the period 1989–1993) in an annual supplement to its publication. These one hundred firms make up the bulk of the world’s oil and gas supply and had a market share of about 75 per‐
cent during the sample period. The dataset provides information on the exact share of state
14 A list of all countries as well as the respective mean values of their ownership variables is presented in Ta‐
ble A1 in the Appendix.
15 This is mostly owed to the fact that some NOCs do not publicly disclose their exact production figures.
16 See online: <www.usgs.gov/>.
17 As an example, approximately 60 percent of Nigeria’s total oil and gas output was of unknown provenance prior to 2004. (Up to 2003, Evaluate Energy only provides production figures of privately owned companies operating within this country.) According to the single reports of the US Geological Survey, the market share of Nigeria’s NOCs was around 60 percent during the given period. Thus, we could attribute the missing pro‐
duction to the state.
18 NOCs participation shares within certain joint ventures or production sharing agreements in Sudan, Azerbaijan, Kazakhstan, and Vietnam were not clearly identifiable.
19 While missing observations are limited to single years in Azerbaijan, Equatorial Guinea, and Libya, the re‐
maining five mentioned countries are marked by missing information for longer time periods.
20 See online: <www.energyintel.com/Pages/EIG_GroupHome.aspx>.
ownership for each listed firm as well as the respective country of origin. We then matched this information on firms’ ownership structures, and respective country of origin, with the previously gathered data on firms’ output. As PIW includes only the top one hundred com‐
panies for each year in its publications, we coded the remaining noncovered companies by accessing their respective websites. This allowed us to gather four variables that measure the total amount of hydrocarbons produced by:
1) state‐owned, 2) privately owned, 3) foreign, and
4) domestic companies.
Our final dataset covers 40 countries throughout the period 1989–2010. Overall, the data is in line with Luong and Weinthal’s dataset. However, important differences are observable in deviant cases like Algeria, Angola, and Brunei. During the period 2005–2010, Luong and Weinthal classify Algeria’s oil industry as “private foreign ownership.” Our real production figures, however, reveal that nearly 90 percent of total hydrocarbons are produced by state companies. Angola and Brunei are characterized by a public‐private ownership structure.
Our data indicates that between 1999 and 2010, private firms were responsible for a higher production share than public companies in both countries. However, Luong and Weinthal classify their oil sectors as “state ownership without control” throughout this period. Similar differences can be found for other countries.
In order to test both hypotheses outlined in the previous section, the regression analysis relies on the total amount of hydrocarbons (in thousand barrels of oil equivalent per day)21 produced by state‐owned (state hydrocarbons) or privately owned firms (private hydrocarbons) both in per capita terms and as a share of country GDP. The control variables were chosen in accordance with a sensitivity analysis done by Hegre and Sambanis (2006), who performed specification tests to check the robustness of 88 variables frequently used in the literature to explain civil war. However, a “kitchen sink” model that considers any control variable that is expected to have an impact on the dependent variable should be avoided. As outlined by Ray (2003) or Aachen (2005), a control variable should be included in the analysis only if it is likely to influence the relationship between the key explanatory variables and the dependent variable. According to the authors, control variables showing an impact on the dependent variable that is complementary to that of the key explanatory factor should not be considered by the analysis. Therefore, the following control variables have been included in the regres‐
sion models: log of population size, per capita GDP, economic growth, recent political insta‐
bility, inconsistent democratic institutions, and ethnic fractionalization.22 All independent variables were lagged by one year in order to counter possible reverse causality.
21 When calculating the unit “barrels of oil equivalent” (boe), the output of natural gas is standardized according to the energy content of one oil barrel.
22 See Table A2 in the Appendix for further information on the definitions and sources for all the variables em‐
ployed. Table A3 provides a summary of the variables’ descriptive statistics.
The risk of internal conflict onset is estimated using logit models for 40 countries throughout the period 1989–2010.23 Including only hydrocarbon‐abundant (or hydrocarbon‐
dependent) states in the sample has the advantage of reducing the risk of structural instabil‐
ity and omitted variable bias.24 To minimize the problems of temporal dependence on a his‐
tory of conflict, a variable reflecting the duration of time since the last event/onset (peace) as well as three natural cubic splines were included in all models, following the recommenda‐
tion made by Beck et al. (1998). Additionally, rare‐event logit models, as suggested by King and Zeng (2001), were estimated. These authors demonstrate that when binary dependent variables measure the occurrence of rare events, standard logit or probit estimations may produce biased coefficients.
5 Empirical Findings
The first performed regression analysis tried to replicate the findings of Collier and Hoeffler (1998) and Basedau and Lay (2009) by using the outlined sample of 40 hydrocarbon‐
producing states.25 It did not differentiate between ownership types, but rather assessed the impact of total oil and gas production (both in per capita terms and as a share of total ex‐
ports) on civil war onset. To test for the possibility of a curvilinear effect, a squared term was introduced in the models.
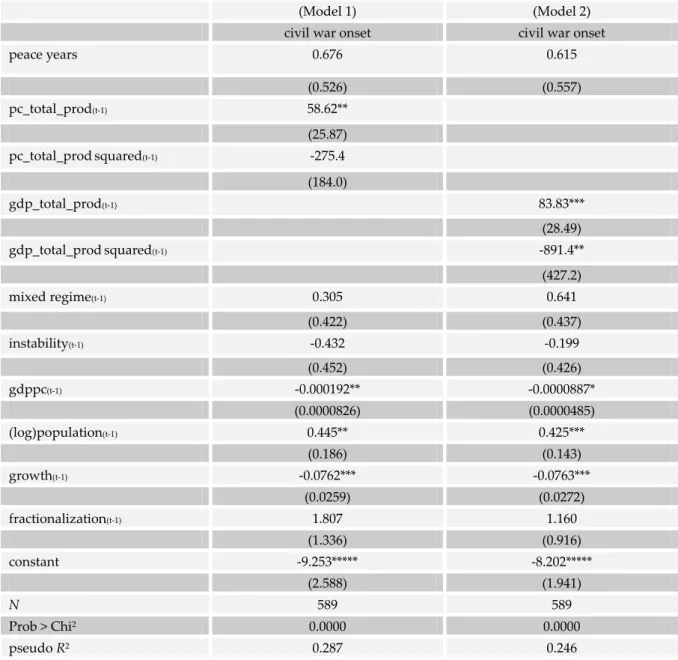
Table 1 below shows that the results are largely in line with those reported in previous studies. Hydrocarbon dependence (measured by total oil and gas production divided by the GDP) increases the risk of violence onset at intermediate levels while reducing the risk after a certain production output has been reached (see Model 2). However as previously noted, these results might suffer from reversed causality bias (see Brunnschweiler and Bulte 2009) and should therefore be interpreted with care. Concerning the impact of hydrocarbon wealth (measured by total per capita oil and gas output) on civil war onset, the analysis also indi‐
cates an inverted U‐shaped relationship – although high levels of hydrocarbon wealth (as captured by the squared term) are only statistically significant at the 11 percent level (see Model 1). All control variables exhibit the expected signs, with three of them reaching statis‐
tical significance at conventional levels: per capita GDP and growth reduce the likelihood of civil wars, while population size is associated with an increased risk of internal violence onset.
23 This period of analysis reflects the availability of the Evaluate Energy data on companies’ oil and gas production.
24 Resource‐wealthy countries share common characteristics that might be relevant for explaining internal vio‐
lence onset but often remain unobserved, thus creating spurious relationships.
25 Only country‐years in which the sum of state‐owned and privately owned oil and gas figures made up more than 65 percent of the officially reported total hydrocarbon production were considered.
Table 1: Total Hydrocarbon Production and Civil War Onset
(Model 1) (Model 2)
civil war onset civil war onset
peace years 0.676 0.615
(0.526) (0.557)
pc_total_prod(t‐1) 58.62**
(25.87)
pc_total_prod squared(t‐1) ‐275.4
(184.0)
gdp_total_prod(t‐1) 83.83***
(28.49)
gdp_total_prod squared(t‐1) ‐891.4**
(427.2)
mixed regime(t‐1) 0.305 0.641
(0.422) (0.437)
instability(t‐1) ‐0.432 ‐0.199
(0.452) (0.426)
gdppc(t‐1) ‐0.000192** ‐0.0000887*
(0.0000826) (0.0000485)
(log)population(t‐1) 0.445** 0.425***
(0.186) (0.143)
growth(t‐1) ‐0.0762*** ‐0.0763***
(0.0259) (0.0272)
fractionalization(t‐1) 1.807 1.160
(1.336) (0.916)
constant ‐9.253***** ‐8.202*****
(2.588) (1.941)
N 589 589
Prob > Chi2 0.0000 0.0000
pseudo R2 0.287 0.246
NOTE: Logit models using robust standard errors (shown in parentheses) with onset of minor civil wars as de‐
pendent variable. We account for duration dependence using peace‐years correction and three natural cubic splines calculated with the program BTSCS Data Analysis Utility Version 4.0.4.
* p<0.10, ** p<0.05, *** p<0.01, ***** p<0.001 Source: Authorʹs own compilation.
After partially corroborating the findings of previous studies, the following regression anal‐
yses assessed the importance of hydrocarbon ownership structures as a determinant of intra‐
state violence. Table 2 summarizes the effects of state and privately owned hydrocarbon wealth on civil war onset. As evident from Models 1 and 2, per capita private ownership los‐
es statistical significance after the control variables are introduced. In contrast, per capita state ownership affects internal violence as hypothesized: intermediate levels of state‐
controlled oil and gas increase the potential for conflict, while high levels have a peace‐
buying effect (see Models 3 and 4). Standardized regression coefficients show that the effect size of state‐owned hydrocarbons on civil war onset is substantive: the coefficient size for per
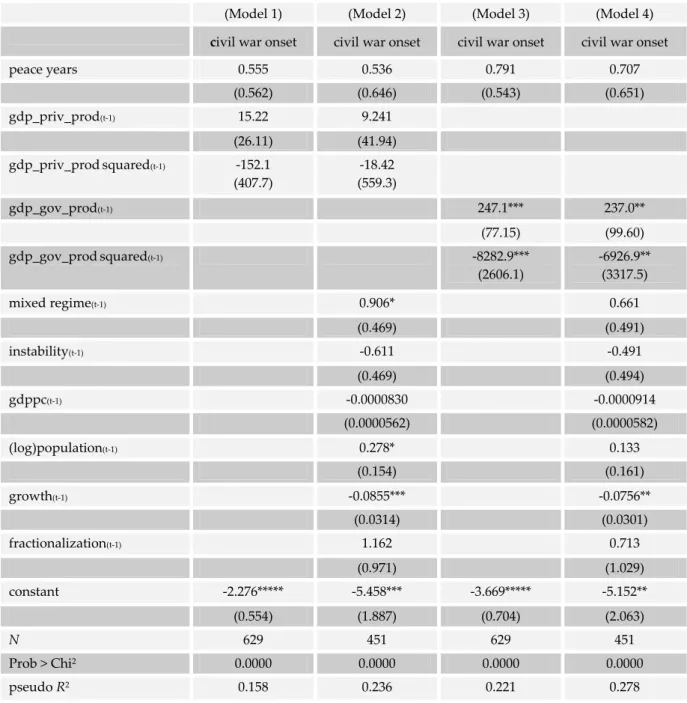
capita state hydrocarbons is the largest within the whole model, while the effect size of its squared term is considerably smaller. Finally, Table 3 reveals that results are very similar when hydrocarbon wealth is replaced by hydrocarbon dependence. As evident, state hydro‐
carbons as a share of GDP exert a curvilinear effect (see Models 3 and 4) while private hydro‐
carbons have no impact on the outbreak of civil wars.
Table 2: Per Capita State and Private Hydrocarbon Production and Civil War Onset
(Model 1) (Model 2) (Model 3) (Model 4)
civil war onset civil war onset civil war onset civil war onset
peace years 0.722 0.562 0.919* 0.771
(0.528) (0.631) (0.514) (0.611)
pc_priv_prod(t‐1) 15.48 6.563
(10.49) (12.54)
pc_priv_prod squared(t‐1) ‐140.6**
(67.92)
‐65.76 (56.19)
pc_gov_prod(t‐1) 40.56*** 66.56***
(12.33) (21.75)
pc_gov_prod squared(t‐1) ‐258.3***
(87.90)
‐401.0**
(171.5)
mixed regime(t‐1) 0.899* 0.817*
(0.471) (0.455)
instability(t‐1) ‐0.531 ‐0.833
(0.469) (0.517)
gdppc(t‐1) ‐0.0000671 ‐0.000234**
(0.0000549) (0.0000932)
(log)population(t‐1) 0.193 0.189
(0.152) (0.167)
growth(t‐1) ‐0.0830*** ‐0.0770***
(0.0313) (0.0280)
fractionalization(t‐1) 1.294 1.188
(0.951) (1.071)
constant ‐2.306***** ‐4.739*** ‐3.273***** ‐5.692***
(0.535) (1.804) (0.543) (2.145)
N 635 451 635 451
Prob > Chi2 0.0000 0.0000 0.0000 0.0000
pseudo R2 0.188 0.239 0.253 0.299
NOTE: Logit models using robust standard errors (shown in parentheses) with onset of minor civil wars as de‐
pendent variable. We account for duration dependence using peace‐years correction and three natural cubic splines calculated with the program BTSCS Data Analysis Utility Version 4.0.4.
* p<0.10, ** p<0.05, *** p<0.01, ***** p<0.001 Source: Authorʹs own compilation.
Table 3: State and Private Hydrocarbon Production (as Share of GDP) and Civil War Onset
(Model 1) (Model 2) (Model 3) (Model 4)
civil war onset civil war onset civil war onset civil war onset
peace years 0.555 0.536 0.791 0.707
(0.562) (0.646) (0.543) (0.651)
gdp_priv_prod(t‐1) 15.22 9.241
(26.11) (41.94)
gdp_priv_prod squared(t‐1) ‐152.1 (407.7)
‐18.42 (559.3)
gdp_gov_prod(t‐1) 247.1*** 237.0**
(77.15) (99.60)
gdp_gov_prod squared(t‐1) ‐8282.9***
(2606.1)
‐6926.9**
(3317.5)
mixed regime(t‐1) 0.906* 0.661
(0.469) (0.491)
instability(t‐1) ‐0.611 ‐0.491
(0.469) (0.494)
gdppc(t‐1) ‐0.0000830 ‐0.0000914
(0.0000562) (0.0000582)
(log)population(t‐1) 0.278* 0.133
(0.154) (0.161)
growth(t‐1) ‐0.0855*** ‐0.0756**
(0.0314) (0.0301)
fractionalization(t‐1) 1.162 0.713
(0.971) (1.029)
constant ‐2.276***** ‐5.458*** ‐3.669***** ‐5.152**
(0.554) (1.887) (0.704) (2.063)
N 629 451 629 451
Prob > Chi2 0.0000 0.0000 0.0000 0.0000
pseudo R2 0.158 0.236 0.221 0.278
NOTE: Logit models using robust standard errors (shown in parentheses) with onset of minor civil wars as de‐
pendent variable. We account for duration dependence using peace‐years correction and three natural cubic splines calculated with the program BTSCS Data Analysis Utility Version 4.0.4.
* p<0.10, ** p<0.05, *** p<0.01, ***** p<0.001 Source: Authorʹs own compilation.
Several robustness checks were performed. All presented models were reestimated using ra‐
re‐event logit methods, and the results were nearly identical.26 The reported findings also proved to be robust to the inclusion or exclusion of different sets of independent variables.
All models were reestimated including additional institutional indicators such as regime type or the level of democracy (as measured by Freedom House or Polity2) in order to ad‐
dress possible omitted‐variable bias; the results did not change considerably. Likelihood ra‐
26 The results are available upon request.
tio tests of the reported specification against several different nested models revealed that the applied full model had a proper specification. In addition, a stepwise inclusion of all inde‐
pendent variables indicated that the reported findings were unlikely to have been driven by multicollinearity. This was confirmed by an analysis of the predictors’ variance inflation factor.
The present empirical analysis provides positive evidence for the hypothesized relation‐
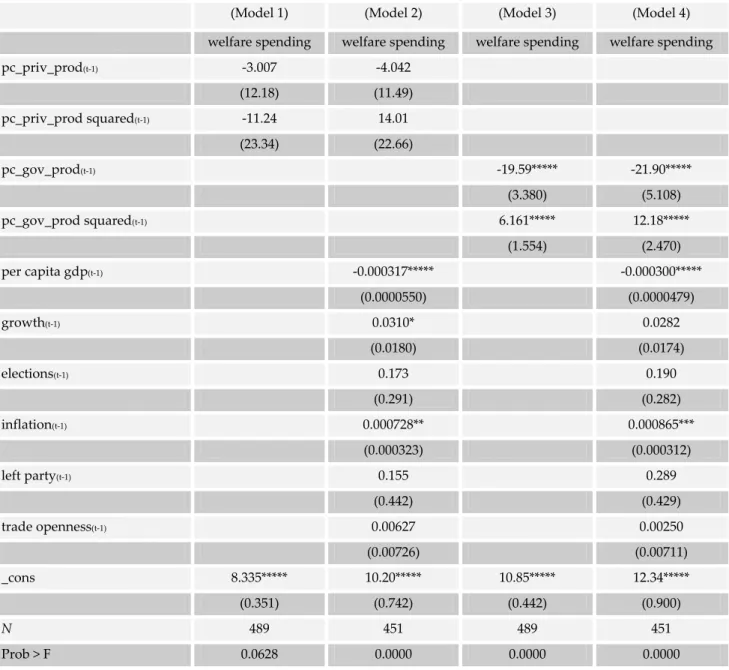
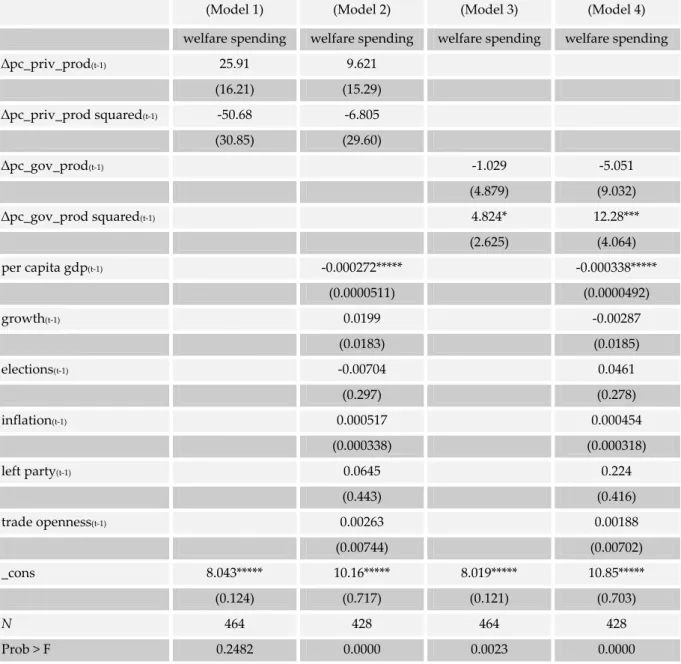
ship between hydrocarbon’s ownership structure and internal conflict onset. Unfortunately, a more detailed empirical test of each of the presented causal mechanisms lies beyond the scope of this paper and should be addressed by future research. However, given the strong findings linking resource production with social spending (e.g. Morrison 2008) as well as welfare spending and intrastate conflict onset (e.g. Taydas and Peksen 2012), it seems worthwhile to analyze whether differences in welfare spending patterns between diverging ownership structures may partially explain the findings reported above.
The next analysis explored whether the percentage of total hydrocarbons produced by ei‐
ther public or private companies is associated with changing levels of welfare spending. For this purpose, welfare spending (accounting for the three key areas of education, health, and social security) as a percentage of GDP was used as the dependent variable.27 Again, the main independent variables of interest were the total amount of hydrocarbons produced by either state‐owned or privately owned firms in per capita terms.
Several control variables that are commonly found in the literature (see e.g. Rudra and Haggard 2005; Ha 2008; Nooruddin and Simmons 2010) and are expected to affect the rela‐
tionship between the key explanatory factor and the dependent variable were considered. To account for income effects and Wagner’s Law, GDP per capita (purchasing power parity converted from the Penn World Table) was included in the models. Since economic growth may have a counter‐cyclical effect on spending (e.g. Burgoon 2001) and, at the same time, may raise the revenue base of the welfare state, this variable was also included.28 Trade openness (measured by the sum of total exports and imports divided by the GDP in constant prices) was considered in order to address previous findings of the so‐called compensation theory (see e.g. Rodrik 1997).29 Furthermore, I controlled for election years with a dummy that is coded as “1” when there has been a legislative or executive election in the given year and “0” when otherwise.30 To control for the potential effect of partisan politics on welfare spending, a dummy variable indicating when a left‐wing party was the largest government party was included.31 Finally, since government leaders may overcompensate for inflation under sociopolitical pressure (see Ha 2008: 795), the total inflation rate (taken from the World Development Indicators) was equally considered as a control variable.
27 This data was taken from Taydas and Peksen (2012).
28 Growth is measured by the annual growth of GDP taken from World Development Indicators.
29 Source: Penn World Tables (Heston et al. 2009).
30 Source: Database of Political Institutions (DPI).
31 Source: Database of Political Institutions (DPI).