THE PRESENT STATUS OF ELECTRON PROBE MICROANAL YSIS
HANNS MALISSA
Institutfür Analytische Chemie und Mikrochemie der Technischen Hochschule, Wien,Austria
ABSTRACT
Few other analytical methods have expanded so rapidly as electron probe microanalysis during the past 10 years. The number of elements that can be determined or detected extends from beryllium to uranium and concentrations in the range 0·1-100 per cent can be dealt with. This has been made possible by the introduction of new analysing crystals and counting systems. The application of computer programming in conjunction with the various micro- probe signals has allowed the development of valuable new methods for structural analysis. Even in commercial instruments, the electron beam can now be focused down to a diameter of 0-15 lJ,m, hence the resolution of back- scauered or secondary electron images is excellent and a !arge amount of information can be gained on the topography and morphology of solid sub- stances. When integrators with proper discrimination are used, new informa- tion on diffusion systems, etc., in solid materials can be obtained. With all these possibilities, the position of electron microprobe analysis is now very strong. In addition to the use of x-rays for quantitative work, many other signals arising from the interaction of electrons with the target can be utilized.
INTRODUCTION
Electron probes have found a very wide spectrum of applications in science and technology, as weil as for analytical purposes; however, presently avail- able techniques by no means represent the final Iimits of development of this relatively new method. In the United Kingdom, many distinguished scientists are working on the development of electron probes. A survey of electron probe microanalysis from the Standpoint of analytical chemistry rather than physics or physical chemistry may provide further impetus to still broader analytical applications of this elegant technique.
A backward glance over the past 60 years shows the tremendous progress that has been made in the field of analytical chemistry with regard to the reduction of Iimits of detection. In 1910, the Iimits of detection were generally of the order of 10-2 per cent and sample weights were generally in the range of 1-10 g. Today, sample weights of 1-10 mg are used wherever the homogeneity of the sample allows; the gradual decrease in general sample weights is shown in Figure 1. This decrease has, of course, been made possible by the improving Iimits of detection of new analytical methods; typical detection Iimits for a variety of currently used techniques are shown in Table 1. It can be seen that
10~8~---~
10-12 -
Limits of detection ~
~
1920 1930 1940
Years
11950 1960
/ /
1970
Figure 1. The historical development of sample weights in analytical chemistry
Table 1. Limits of detection of different techniques
Method (Mass of an electron (Sex attraction of the bee
Olfactory sense Electron microprobe Fluorescence microscopy Mass spectroscopy Emission spectroscopy Ring oven
Absorption spectroscopy Spottests
Electrochemical micromethods X -ray fluotescence
Limit of detection (g) 9 X lQ-28 )
IQ-20) IQ-18 IQ-16 IQ-14 IQ-13
10-12 10-12
IQ-10 IQ-7_1Q-10 IQ-7
w-9
the electron microprobe offers the greatest sensitivity of any instrumental technique.
In recent years, the use of electrons as analytical reagents has increased to a very great extent. In fact, it appears that the current development in this field is similar to the upsurge of interest in electrochemical methods some 50 years ago, when these procedures were added to the conventional gravimetric and volumetric methods which were then the major tools of analytical chemistry.
It may be useful briefiy to define electron beam analysis and electron probe microanalysis. Electron beam analysis involves the use of the signals obtained from the interaction of an electron bombardment with the surface of a sample.
Electron probe microanalysis is basically the same, but the electron beam is very finely focused and impinges on the particular point at the surface of the sample whose chemical composition is to be determined. Essentially, the electron beam is nothing more than a reagent-a relatively expensive reagent, but one which possesses many advantages. From the analytical point ofview,
480
THE PRESENT STATUS OF ELECTRON PROBE MICROANALYSIS one might say that the acceleration voltage and the beam current represent the 'concentration of the reagent', and the focusing of the beam its 'purity'.
The price of an electron probe analyser is now not excessive; if it is considered that such equipment has a usefullife of 10 years, the cost per hour of normal usage is in the region of $5-8.
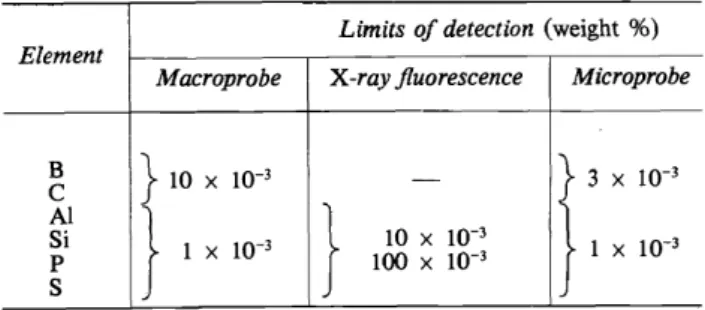
Table 2. Comparison of the limits of detection for elements with atomic number 5-16 Limits of detection (weight %)
Element
Macraprobe X -ray jluorescence Microprobe
B }wx
w-3
-r
X 10-3c
Al} }
Si 1 X
w-3
lOxw-3
1 x
w-3
p 100 X
w-3
s
In electron beam or electron probe analysis, the main concern is with primary x-rays. Both methods have the great.advantage compared with x-ray ftuorescence analysis, where secondary x-rays are measured, that the limits of detection for light elements are much better1 (Table 2). The main difference between microprobe and macroprobe analysis lies in the diameter of the electron beam and thus in the current load of the sample. The ratio of the beam area to sample area is 1: 108 for the electron microprobe and 1: 10 for the electron macroprobe, hence the thermal Ioad in the former method is much higher1• A comparison of the 'current Ioad' far the two different techniques is shown in Table 3. Provided that the samples being analysed possess good electrical conductance properties, the difference in current load is of no importance, but non-conducting materials may be difficult to analyse because of changes in composition caused by the irradiation.
Table 3. Comparison ofthe 'current load' in microprobe and macroprobe analysis.
Specimen area Beam diameter
Area of the electron probe Specimen current Specimen current/ J.lm2 Area of the electron probe/
specimen area
Microprobe 3 X 10⁸ J.lffi2
2J.lm 3 J.lffi2 5 X
w-s
A 5 Xw-s
Aw-8
Macraprobe 3 X 10⁸ J.lffi2 4000 J.lffi 1 X 10⁷ J.lffi2
2 X 10⁻⁵ A 2 X 10-12 A
3 x
w-z
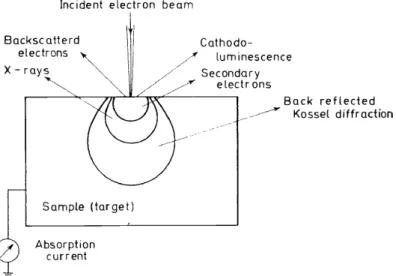
SIGNALS OBTAINED BY ELECTRON BOMBARDMENT The interaction of a finely focused electron beam of high energy with a sample vields a variety of signals. The principal signals which are used in microprobe analysis are shown in Figure 2. In addition to these signals, there is
Incident electron beam
Backsc atterd electrons ' X- ray;_ "~,
Cathodo-
~/"'/ luminescence
/
/ - Secondary / / / electrons
Sample (target)
Absorption current
Back reflected -~ Kossel diffraction
Figure 2. The principal signals utilized in electron probe microanalysis Table 4. A summary of the information available from the
different signals
Signal X-rays
Absorbed electrons Backscattered electrons Secondary electrons
Transmitted electrons
Information Kind and concentration of an element
Average atomic number (a) Average atomic number (b) Relief of the surface (a) Relief via low energy
electron collectors (b) Eiemental analysis via
Auger electrons Internat structure
the possibility of production of Auger electrons by x-rays already generated in the sample; and if the sample isthin enough, valuable modifications such as microradiography, transmission electron microscopy, etc., become available.
Table 4 summarizes the nature ofthe information that can be acquired from the different types of signals produced.
TUE HISTORICAL DEVELOPMENT OF ELECTRON PROBE ANALYSIS
There is no doubt that it was Moseley2 who first made a miereprobe analyser by using a simple electron gun in a vacuum tube (Figure 3), and that he fully realized the great value of this discovery to analytical chemistry. But for Moseley's tragically early death, electron probe analysis might have arrived much earlier on the analytical scene. It is worthwhile to quote his statement made in 1913:
THE PRESENT STATUS OF ELECTRON PROBE MICROANALYSIS 'The prevalence oflines due to impurities suggests that this (irradiation) may prove a powerful method of chemical analysis. Its advantages over ordinary spectroscopical methods lie in the simplicity of the spectra and the impossibility of one substance masking the radiation from another. It may lead to the discovery ofmissing elements and it will be possible to predict their characteristic lines.'
In Moseley's method, a trolley carrying various samples as targets was drawn under the electron beam and the characteristic x-rays resulting from the irradiation were measured photographically. About 25 years later, von Ardenne3 used a finely focused electron beam for the excitation of primary x- rays and measured the backscattered electrons, and rather later, Möllenstedt worked on similar principles. According to Birks4, Hillier in the United States was the first to receive a patent for the use of such an electron beam for chemical analysis in 1947, but he does not appear to have pursued the subject further. In any case, the first paper on this subject was presented in Delft in 1949 by Castaing and Guinier5• The original apparatus of Castaing, which he called 'microsonde electronique', was based on a French electron microscope,
Pump Sample
"
Electron
\1'<11 source
Sample Castaing
Magnetic Lens
Magnetic lens
X-ray spectrometer
Aperture dia'phragm
Recording diaphragm
Cathode Anode diaphragm
Coil Deviation
field
Level Recording
Level Von Ardenne
Deviation field Sample Take off
angle
Electron source
Spectrometer Shirai and Onoguchi Figure 3. Development of instrumentation for electron probe analysis
and some six years later, an improved instrument for electron probe microan- alysis became commercially available. In their first paperS, Castaing and Guinier not only outlined the principles ofthe construction of an electron probe microanalyser, but also laid the foundations for quantitative analysis. The instruments that are now commercially available have achieved a very high degree of sophistication.
Basically an electron microprobe analyser consists of: (i) an electron optical system for the formation of a fine electron beam of high intensity; (ii) a visual optical system for observation ofthe sample surface and cathodoluminescence;
and, most important, (iii) a system for the performance of x-ray analysis, and, preferably, also for the detection of other signals.
There are so many possible different arrangements ofthe basic units that it is impossible to give more than abrief coverage. Considering only the take-ofT angle which varies6 between 6° and 90°, it seems in the first instance that a 90°
take-off angle would bebest from the point ofview ofx-ray absorption, because the characteristic x-rays excited by the electron bombardment in the sample have then the shortest ro1,1te for emergence and thus undergo minimal absorp- tion in the sample. Shirai and Onoguchi 7 constructed an instrument which
allows the use of such a high take-ofT angle; a high signal-output could be obtained and the signal was not highly dependent on the production of a very finely polished surface (Figure 3). The larger the take-off angle, the smaller the absorption corrections, but the larger is the fluorescence correction. The variety oftake-off angles in the instruments available.can be explained accord- ing to whether an excessive absorption correction or fluorescence correction is deemed the more important.
Analysing crystals
The development of analysing crystals is also of great importance. The difficulties encountered in the analysis of the light elements lie in the discri- mination and measurement of radiation of long wavelength. V ery high demands must be met with regard to the sensitivity of the dispersion and detector systems, so that the excitation potential can be kept small (8 kV or less) and so that th€ optimal resolution can be achieved with the minimal contribution from background radiation. Although non-dispersive systems have been used, dispersive systems currently find greater applicability.
Since 1950, the range of detectable elements has steadily increased:
1950 Na~ U 1960 C ~ U 1965 B ~ U
1967 Be ~ U 1968 Li~ U
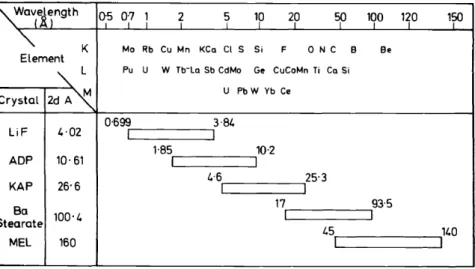
An idea ofthe performance of different crystals can be gained from Figure 4.
It can be seen that with only 5 different crystals, more than 90 per cent of the known elements can be covered. Today nearly every instrument has 2-3 spectrometer units with a range of 6-8 crystals. In analyses for Iithium, gratings rather than crystals are at present being investigated.
Limits of detection
The question of the lowest amount of a particular element which can be detected or determined cannot be answered in a general way, since the matrix,
THE PRESENT STATUS OF ELECTRON PROBE MICROANAL YSIS
""Wavelength
~5
0} 1
~ 51fl 2fl sp
190 1~0110
~.a 1 I
""
K Mo Rb Cu Mn KCa Cl S Si F 0 N C B BeElement
"
L Pu U W Tb-La Sb CdMo Ge CuCoMn Ti Ca Si2d A "
U Pb W Yb Ce
Crystal
0·699 3·84
liF 4·02 I I
1·85 10·2
ADP 10·61 L I
1.·6 25·3
KAP 26·6 I I
Ba 17 93·5
100·4 I I
Stearate
45 140
MEL 160 L I
Figure 4. Spectrometer wavelength coverage. ADP, ammonium dihydrogen I'hosphate; KAP, potassium hydrogen phthalate; MEL, Me1issat
Table 5. A comparison of Iimits of detection for pure e1ements
1960 1964 1968
Cr 6 X
w-9
Mn 4 X
w-9
Fe 1 X
w-9
Co 7 X 10⁻¹⁰ Ni 5 X 10⁻¹⁰
Cu 4 X
w-w
3 X 10-14 6 x w - 16Zn 4 x w-lo
Sr 2 X IQ--9
Mo 7 X IQ--9 9 X 10-14
w
5 X IQ--9 9 X 10-14 Au 8 X 10--9 2 X 10-13 Al 6 X 10-s 2 X 10-14Table 6. Limits of detection for various e1ements in stee1 Element
Si Kll
PK~l
S Kll Cr Kll1 MnKil1 Co Kll1 NiKil1 Cu Kll1 MoLcx1
Limit of detection c%) 0·053 0·029 0·029 0·019 0·015 0·016 0·014 0·014 0·089
Concentration in sample (%)
1·20 15·6
1-17 0·27 0-23 1-23 0·12 1-49
the homogeneity ofthe matrix and the preparation ofthe surface for analysis all play important roles in governing the Iimits of detection.
If analysis ofthe pure elements is carried out, a reasonably valid comparison can be obtained for guidance, as shown in Table 5. However, for the purpose of chemical analysis, it is much more important to know the lowest concentration of element A that can be detected or determined in matrix B. As an example, the Iimits of detection found for various elements in steel are shown in Table 6;
these Iimits were established under the optimal conditions of accelerating voltage for each element concerned8.
It seems that there are now very few analytical problems that cannot be solved by means of electron probe microanalysis, always provided that a solid sample is available. Tousimis and Adler9, in 1963, investigated the content and distribution of copper in the cornea of the human eye, and since that time, investigations of living specimens, vein walls, bones, etc. have become routine in universities and hospitals. Oxidic materials such as dolomites, Iimes and silicates can now be analysed, as weil as carbides, sulphides, borides, etc., in metallic samples. Nearly every branch of science has found benefits from the introduction of this technique.
INTERACTION BETW.EEN ELECTRON BEAM AND SAMPLE:
QUANTITATIVE ASPECTS
For a proper understanding of the difficulties that can be encountered in electron probe analysis, particularly in quantitative work, it is necessary to Iook closely at the interaction of the electrons with the different elements in the sample.
In the analysis, electrons accelerated to an energy in the range of 5-50 kV are focused on the sample, usually to a diameter of 1 J.LID, carrying a current between 1 JJ:A and 1nA. This beam strikes the specimen at the point to be analyzed. The interaction of the electrons with the atoms in the sample can be classified into two parts: (a) elastic scattering in which there is a considerable change of direction so that the result may be the backscattered electrons; (b) inelastic interaction which Ieads, not in every case but very often, to the ionization of an inner electron shell producing K or L characteristic x-ray quanta.
The interaction can be of considerable complexity (cf. Figure 2), and the atomic nurober correction can be very difficult to establish. All the models that have been proposed are, to a greater or lesser extent, simplifications. Even treatments of the problern by means of Monte-Cario procedures and computer techniques are not entirely satisfactory.
Corrections necessary for quantitative analysis
In his Thesis, Castaing10 stated that, as a first approximation, the concentra- tion of an element A is equal to the ratio of ionization in the sample and the standard. Thus:
CA =.nA/nAst
or, in terms ofthe measurable intensity, lAs' ofthe characteristic radiation of
THE PRESENT STATUS OF ELECTRON PROBE MICROANALYSIS element A in the sample, and the intensity, IA,t' of the same radiation of the pure element under identical conditions:
Very often this simple equation can be used successfully, especially if the sample and standard are very similar. However, there arealso many deviations from this approximation, so that corrections become necessary. The correc- tions required and the reasons for them may be summarized as follows.
1. If elements of widely differing atomic number are present, the intensity of the characteristic x-rays generated within the sample is not proportional to the concentration. This necessitates a correction for the so-called atomic number effect (F1).
2. The x-rays are generated below the surface of the sample and thus they must be partly absorbed by the matrix as they emerge from the sample. This is the reason for a further correction parameter for the absorption effect (F2).
3. As the initially produced x-rays travel through the sample they can, under certain circumstances, generate further radiation; this Ieads to an enhancement of the total radiation, hence a third correction must be made, the fluorescence correction (F3).
When these corrections are included, we have
IA/IA,t
=
kA=
c.A - FI . Fz . F3 where k A is the measurable ratio of intensities.According to Philibert and Tixier 11 a possible scheme of calculation is as follows:
ratio of total emergent intensities
correction for fluorescence
ratio of primary emergent intensities
ratio of
correction for
absorption primary correction for mass- generated atomic numbt!(" concen- intensities effect tration The secondary emissions have to be subtracted from the total measured intensities and the resulting primary emergent intensities have then to be corrected for the absorption effect; finally the true concentration is calculated from the ratio of the primary generated intensities, after correction for the atomic number effect. However, the situation with regard to the correction factors is in dispute, and the methods of computation arestill under develop- ment. The unsatisfactory nature ofthe present understanding ofthese factors is weil illustrated by the fact that about 17 different formulae for correction are currently in use. Mulvey12 has recently pointed out:
'The general physical picture of the interaction of the electron beam with the specimen in the x-ray microanalysis is clear. Nevertheless, many of the numerical results yielded by even the most successful theoretical calculations fall outside the range of experimental error. An improvement in this position can be attained in principle, but only at the expense of long and tedious calculations. However, if one is prepared to Iimit the field of application of a model on an empirical basis or introduce plausible assumptions, surprisingly accurate quantitative analysis can be performed in practice.'
The above description served to indicate why it has become more common to prepare standards which simulate the samples as far as possible, rather than
to use the _pure elements; preparation of suitable standards is of extreme impor- tance in view of the difficulties encountered in the application of formulae derived from a theoretical physical standpoint.
These difficulties arise from a variety of causes in addition to those men- tioned above. For example, there is still no proper agreement on mass- attenuation factors and this would appear to be a proper task for IUPAC.
Another cause involves the 'analysed volume' of the sample. According to Castaing10, the analysed volume depends on the diameter ofthe beam, d5, and
Table 7. Penetration depth for an accelerating voltage of 20kV.
Mean atomic Mean
Compound or molecular atomic Density
weight number
u 238 92 18·7
Mg 24·3 12 1-74
Ca 40·08 20 1·55
CaO 56·1 14 3·4
MgO 40·3 10 3·6
2 MgO. Si02 140-7 10 3·2
MgO.
FSl
0 3 200 13·7 4·52 CaO. t02 172·3 12·3 3·3
CaO. Fe203 271·9 14·7 4·5
CaO. :\:lgO. Si02 156·5 11·1 3·2 MgO. 3_ CaO. Mg . Si0~u2o
0
2 328·8 142·3 10 12·2 3·2 3·6SiO 60·1 10 2·3
All>3 101·9 10 3·7
Penetration depth (J.Ull)
0-67 6·2 6·3 3·2 3·0 3·4 2·6 3·3 3·2 3·4 3·1 3·4 4·7 3·0
on the depth of penetration, dE, of the electrons. The depth of penetration can be calculated as described by Wittry13• For metallic samples, the so-called analysed volume is 2-Sj..Ull for acceleration voltages of 20-30 kV and a beam diameter of. about 1 j.llll. But for non-metallic systems with relatively low average atomic numbers, an entirely different situation obtains; the depth of penetration may be as much as 30-40 J..l1Il for an acceleration valtage of only 20 kV. Since the production ofx-rays takes place in at least the 'analysed volume', it is essential, even with a very fine electron beam, that the grain size of the phases which compose the sample should be large enough to comprise the entire 'analysed volume'.
During the past ten years it has been found that, for practical purposes, with few exceptions, changes in the beam diameter below 1 J.LID do not have a very significant effect, and the resolving power does not improve if the diameter of the beam is reduced, as is possible, down to 0·1 J..l1Il. In the ordinary x-ray technique, the general tendency is to use an accelerating valtage for the electron beam equal to at least three times the critical excitation valtage ofthex-level. If this rule is maintained in x-ray microanalysis, the accelerating valtagethat has tobe used for assaying copper, for instance, is ofthe order of 30 kV. Under such conditions, the diameter ofthe irradiated region ofthe sample is greater by about 2 J..l1Il than the actual diameter ofthe electron probe, and there would be
488
THE PRESENT STATUS OF ELECTRON PROBE MICROANALYSIS
little point in seeking to improve the resolving power by reducing the diameter of the probe below 0· 5 J.llll.
To reduce the diameter of the probe and of the irradiated sampl e area further, it would be necessary to use very low accelerating voltages, just above the critical excitation voltage, and the analysis would then be restricted to the very first layers ofthe sample. However, undersuch conditions, technical difficulties would arise from the weakness of the characteristic lines and from the sensiti- vity of the analysis to impurities in surface films arising from contamination.
Another difficulty is caused by the fact that a mean atomic number is used in the calculations. This means, for example, that calcium ferrate should show the same 'behaviour' as potassium which is certainly not the case.
Errors caused by grain size, orientation
and
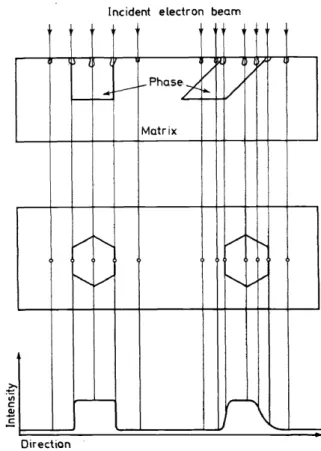
inhomogeneityA further problern may be created by a lack in uniformity of grain size, and, also very important, in orientation of the grains. This means that the 'analysed volume' may consist of a heterogeneaus system, so that incorrect results may occur. Figure 5 shows a typical case schematically. With an optical micro-
lncident electron beam
~~ l {
/
"" VPhase/ /
~ - - f - ~
/
~
Matrix
I
V
~ / ...I'-. V
..._,_vv
r - " - V"-'""
\
Direction
Figure 5. Errors caused by variable orientation of sample grains
scope only the surface can be viewed, and it is impossible to predict how the orientation of the crystal continues with depth. This type of error can be at least as serious as the choice of the proper correction formula. If the crystal or phase is truly vertical to the surface, then a concentration profile such as that shown on the left-hand side of Figure 5 is obtained, but if the orientation is oblique, then the profile appears as on the right-hand side.
Even if perfect correction formulae were available, some invisible part of the region located under the free surface, may show important changes in its chemical constitution. A precipitate, for instance, may occur just below the analysed point in a region which the electrons cannot reach, and a large error in a quantitativeanalysiswill then be obtained; it is impossible to correct for such errors even approximately. In contrast to what happens for the self-absorption correction, the trouble in this case arises from an unknown part of the specimen, and a certain amount of 'fluorescence uncertainty' is bound to remain. This uncertainty could be reduced by using very small values for the
100 95
_...4--. 1 "-.. ..
. . . _."..,-- :E%
... ... 2
-- -- - - -
.-100 3
1 90
~
..
~ 80
70
60
-
~ ~Fe
h
.i/
~ ;t ht
\ /I
'1\
,,~,Yf :~
' 2 ' 350
40 30
20
~
·-z
110
Nt
1!~ ~ y
I
I~ ' \.
l- I
- -\
~
~ ~
-
~0 10 20 30 L.O 50 60 70
x,#-'m
Figure 6. Diffusion curves for nickel and iron. (Heating at 800° for 48 h)
490
THE PRESENT STATUS OF ELECTRON PROBE MICROANALYSIS
angle of emergence of the x-ray beam, for in such a case the fluorescence emission of the deep layers is eliminated by self-absorption; but difficulties would occur in the analysis of specimens whose surface is not perfectly flat.
It must be borne in mind that all correction formulas are valid only for a homogeneaus matrix in view of x-ray production. This means that the irra- diated volume must contain the same concentration ofthe element that is being determined, as that part of the specimen through which the x-rays travel to reach the detectors. This aspect of the electron probe makes it clear why a high take-ofT angle is generally preferred. As a compromise, most instruments have a take-ofT angle between 30 and 60°.
If diffusion problems or the composition of inclusions or reaction products which have a broad solubility band are to be studied, the calculation of the concentration is different in principle. In the usual calculation, as discussed by Philibert, it is assumed that the radiation which is produced in the irradiated volume travels through areas of identical composition on its way to the detectors, undergoing some absorption; in this case,
1
CA= kA. - -
pabs
Ifthere is a gradient in concentration this formula is not applicable. However, it has proved possible to develop a useful formula for such conditions14:
1
CA= k.Ä F'K
In the first formula, Fis a constant, whereas in the latter case both F', and Kare functions depending on the gradient ofthe change in concentration. The value of this new formula can best be demonstrated from Figure 6 where the diffusion curves of nickel and iron are shown. If the calculations are made by means of the first approximation of Castaing, then the sums of nickel and iron obtained are too high, by up to 5-6 per cent ( curve 1 ), and if the absorption correction of Philibert is applied, then the sums are low to about the same extent (curve 3);
only with the new formula can good agreement be achieved (curve 2)14•
APPLICATIONS OF ELECTRON PROBE MICROANALYSIS For some years now electron probe microanalysers have been used routinely in several different ways. For point analyses, the beam is exactly adjusted on a previously selected point of the surface of the specimen. Today this is still the most accurate method for quantitative analyses, because all the essential conditions and'parameters can be fulfilled (the Rowland conditions, etc.)
Scanning methods
Every commercial instrument allows three different kinds of scanning. Bragg angle scanning is used primarily for the qualitative identification of elements.
There are two main possibilities in beam scanning. The beam can be scanned over a small area by electrical deflection. The signals from thex-ray or electron detector are used to modulate the intensity of the cathode-ray tube, which is
~ynchronised with the scanning speed of the probe. With this arrangement, it is
possible to obtain a very good picture ofthe distribution of elements in the area covered, but this procedure cannot be used for exact quantitative measure- ments, because the Rowland circle conditions are fulfilled only over a very smaU area.
The second possibility in the use of electronic scanning is to deftect the probe along a line and to record the distribution of the element of interest along this line. This method of line scanning is very fast but gives only semiquantitative results. One of the reasons is that the electron beam does not remain long enough at any one point for the full intensities to be generated.
In another method, so-called mechanical scanning is employed. In this case the probe remains stationary and the specimen is moved more or less slowly under the probe. Here the Rowland conditions can be fulfilled strictly, and the results can be evaluated almost perfectly, especially if the scanning is carried out stepwise so that the conditions are essentially the same as in point analyses.
This type of procedure is very close to the Moseley arrangement.
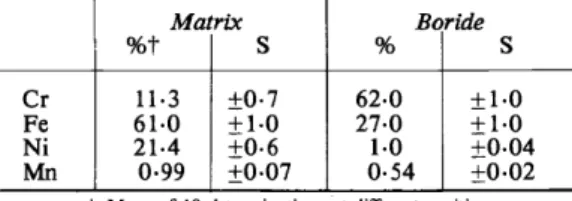
Table 8. Precision of point measurements, indicated by analysis ofthe matrix and the boride in a steel containing
4 · 7 per cent boron
Matrix Boride
%t
s
%s
Cr 11·3 ±0·7 62·0 ±1·0
Fe 61·0 +1·0 27·0 +1·0
Ni 21·4 ±0·6 1·0 +o.o4
Mn 0·99 ±0·07 0·54 ±0·02
t Mean of lO determinations at different positions.
The precision ofpoint measurements is illustrated in Table 8 which summar- izes the analytical results obtained for four elements in the matrixandin the boride inclusions of a steel containing 4 · 7 per cent of boron. It is of interest to note that both the primary boride and the boride-free part ofthe eutectic matrix appear to be completely homogeneaus phases. The precision of these analyses is remarkably good considering that none of the boride inclusions was thicker than 20 J.Ull·
Studies of electrode behaviour
There are so many notable examples from metallurgy and other disciplines that it is impossible to give even a reasonably full survey of the manifold applications of electron probe microanalysis. The following example is of interest in that it indicates the fruitfulness of combining chemical and electron probe methods. The problern concerned the determination of traces of copper in solution 15• The electrodeposition of copper from certain electrolytes gave a good mirror-like surface which was of even thickness. Measurements with the electron microprobe, however, showed that there was a perceptible rim on the electrode (a 5-mm platinum disc) where the depositwas thieker, although this was not such as to affect the usefulness of the procedure. This initial finding may later Iead to further studies of the reaction · mechanisms on electrodes:
THE PRESENT STATUS OF ELECTRON PROBE MICROANALYSIS Recoveries of copper on the 1 0-f.lg scale were about 90 per cent from solution to electrode.
Small, known quantities of copper were deposited on the electrodes by means of constant-current coulometry, and these samples were measured in the electron probe microanalyser. Multiple counts on several different points on each electrode were made in order to obtain a measure of the mean thickness and of its variation. The layers were then stripperl and the copper was determined spectrophotometrically, as a final check. Very good linearity between count-rates and the amount of copperwas found for the range upto 35 J..Lg, corresponding to a thickness of 0· 2 J.lm. Measurements were possible up to a thickness of about 0· 5 f.lm. Total recoveries of 80-90 per cent were obtained and the mean result obtained on 10 counts per sample, all on different points of the electrode surface, was 30 J..Lg with a standard deviation of 10·6 J.lg. The time required for collection, electrolysis, and measuring was approximately 30 minutes for each analysis.
Very recently, Meites and Chodos16 used electron probe microanalysis to investigate the oxide films of platinum-iridium electrodes. Even in only preliminary tests, these workers found that there is some evidence that can be taken as implying the chemical participation of oxide films in electron-transfer processes at noble metal electrodes. As the redox behaviours of iridium and platinum are quite different, the slow accumulation of iridium-either as an impurity or as an added alloying element-might weil alter the electrochemical behaviour of an electrode. No doubt this behaviour would also occur with many other elements, and it may be guessed that this phenomenon may be at least partly responsible for the familiar dependance of the properties of a platinum electrode on its previous history.
Stereometrie analysis
Another combination is the use of a so-called 'phase integrator'17 with an electron probe microanalyser, the aim being to develop a real Stereometrie, i.e.
three-dimensional, analysis. The electron microprobe has proved tobe a very valua ble tool for the determination of the chemical composition of phases and it has nearly the same spatial resolution as the light microscope. The instru- ment, therefore, lends itself readily to applications in the field of Stereometrie analysis, especially since the scanning microprobe design offers the possibility of scanning the sample in straight lines. Thus, the most sophisticated method of Stereometrie analysis, lin<:!ar analysis, can also be accomplished with the microprobe. It is not surprising that several attempts in this direction have been made independently by different investigators. At the sametime as Dörfler and Plöckinger17 discussed their phase integrator, Melford and Whittington IM des-
cribed the development of an 'inclusion counter' which is based mainly on a computer technique. This counter analyses the x-ray and backscatter output of the microprobe. The phases or inclusions are distinguished by the presence or absence of the elements in question, and by the value of the mean atomic number as given by the intensity of the backscattered electrons. If a phase is identified, sizing circuits are activated, which record the number of intercepts falling into a special size dass. A special provision is made to avoid the counting of an inclusion twice while analysing on subsequent lines. This
method is extraordinarily rapid, the analysis on a field of 500 x 500 J.Ull2 being performed in 30-60 seconds.
The basic principle of the apparatus known as a 'phase integrator' is as follows. A signal ofthe electron microprobe (x-ray, target current, etc.) is fed into a discriminator circuit, where the identification of the selected phase is accomplished. lf the signal voltage remains within the lower and upper threshold Iimits, a constant voltage is applied which opens a gate. Through the open gate, pulses of constant frequency, which are produced by an extemal oscillator, can pass to the analysing circuits. The pulse groups obtained in this way represent the intercept length of the linear analysis and can, therefore, be analysed to give all the structural parameters required.
For routine use, the coupling of computers with analytical techniques such as electron probe microanalysis which yield their data in the form of high impulse rates, is of very great importance, and in the future such combinations will become essential. Because ofthe high count rates involved and because of the complex nature of the many parameters required for quantitative evalua- tion, e.g. atomic number correction, specially designed computer programmes have recently been developed 19•
CONCLUSION
At the present time, the instrumentation available for electron probe micro- analysis has reached a very high standard of performance, and its handling is as Straightforward as is likely to be achieved. The method offers very great possibilities to analytical chemistry both alone andin combination with other methods; indeed, there are few branches of science to which the application of electron probes cannot bring new and valuable results that could not be achieved by other means.
At the present time, there is a considerable discrepancy between the very rapid production of the signals and their very slow evaluation, but as electron probe systems become fitted with on-line computers, this problern will disap- pear. The technique is one of those which are particularly adaptable for automation and work on these lines is proceeding rapidly in many places.
Many basic problems remain unsolved; for example, the distribution ofthe characteristic x-rays produced in the sample volume. In 1968, Mulvey12 stated that 'it is at this Ievel that the real difficulties begin'. He surely meant the solution of analytical problems by means of pure mathematics. However, such problems can be obviated provided that suitable standard samples are available, and in routine work, the great majority of analytical questions can be solved without difficulty.
References
1 H. Malissa, H. Ch. Horn, H. Triebel and J. Feges. Radex, in press.
2 H. Moseley. Phi/. Mag. 26, 1024, (1913); 27, 703 (1914).
3M. von Ardenne. Naturwiss, 27, 485 (1939).
4 L. S. Birks. Electron Probe Microanalysis, Interscience, New York-London, 1963.
5 R. Castaing and A. Guinier. Proc. Conf Electron Microscopy, Delft, 1949, Martin Nijhoff, Delft, 1950.
6 H. Malissa. Elektronenstrahl Mikroanalyse, Springer, Wien-New York 1966, p. 50.
7 H. Malissa. Elektronenstrahl Mikroanalyse, Springer, Wien-New York 1966, p. 51.
THE PRESENT STATUS OF ELECTRON PROBE MICROANAL YSIS
8 H. Malissa. Elektronenstrahl Mikroanalyse, Springer, Wien-New York 1966, p. 94.
9 A. J. Tousimis and I. Adler. J. Histochem. Cytochem. II, 40 (1963).
10 R. Castaing, Thesis, University of Paris, 1951.
11 J. Philibert and R. Tüder. Quantitative Electron Probe Microanalysis, NBS Special Publica- tion No. 298, Washington, 1968, p.13.
12 T. Mulvey. Quantitative Electron Probe Microanalysis, NBS Special Publication No. 298, W ashington, 1968, p.81.
13 D. B. Wittry. J. Appl. Physics 29, 420 (1959).
14 H. Triebel, Dissertation, Technische Hochschule Wien, 1969.
15 I. Marr. Private communication.
16 A. A. Chodos and L. Meites. Anal. Chem .. 41, 846 (1969).
17 G. Dörfler and E. Plöckinger. Optique des Rayons X et Microanalyse, Hermann, Paris, 1966, p. 506.
18 D. A. Melford and K. R. Whittington. Optique des Rayons X et Microanalyse, Hermann, Paris, 1966, p. 497.
19 H. Malissa, H. Ch. Horn and G. Jellinek. Z. anal. Chem. 245, 80 (1969).