• Keine Ergebnisse gefunden

Ausschuss Geodäsi e der Bayer i schen Akademi e der Wi ssenschaf t en

N/A
N/A
Protected

Academic year: 2021

Aktie "Ausschuss Geodäsi e der Bayer i schen Akademi e der Wi ssenschaf t en"

Copied!
142
0
0

Wird geladen.... (Jetzt Volltext ansehen)

Volltext

(1)

Ver öfent l i chungen der DGK

Ausschuss Geodäsi e der Bayer i schen Akademi e der Wi ssenschaf t en

Rei he C Di sser t at i onen Hef t 784

Lukas Schack

Obj ect - based Mat chi ng of Per si st ent Scat t er er s t o Opt i cal Obl i que I mager y

München 2016

Ver l ag der Bayer i schen Akademi e der Wi ssenschaf t en

I SSN 0065- 5325 I SBN 978- 3- 7696- 5196- 6

Di ese Ar bei t i st gl ei chz ei t i g ver öfent l i cht i n:

Wi ssenschaf t l i che Ar bei t en der Fachr i cht ung Geodäsi e und Geoi nf or mat i k der Lei bni z Uni ver si t ät Hannover

I SSN 0174- 1454, Nr . 327 , Hannover 2016

(2)
(3)

Ver öfent l i c hungen der DGK

Aus s c hus s Geodäs i e der Ba y er i s c hen Ak ademi e der Wi s s ens c haf t en

Rei he C Di s s er t at i onen Hef t Nr . 784

Obj ec t - bas ed Mat c hi ng of Per s i s t ent Sc at t er er s t o Opt i c al Obl i que I mager y

Von der Fak ul t ät f ür Baui ngeni eur wes en und Geodäs i e der Got t f r i ed Wi l hel m Lei bni z Uni v er s i t ät Hannov er

z ur Er l angung des Gr ades Dok t or - I ngeni eur ( Dr . - I ng. ) genehmi gt e Di s s er t at i on

v on

M. Sc . Luk as Sc hac k

Münc hen 2016

Ver l ag der Bay er i s c hen Ak ademi e der Wi s s ens c haf t en

i n Kommi s s i on bei der C. H. Bec k ' s c hen Ver l ags buc hhandl ung Münc hen

I SSN 0065- 5325 I SBN 978- 3- 7696- 5196- 6

Di es e Ar bei t i s t gl ei c hz ei t i g v er öfent l i c ht i n:

Wi s s ens c haf t l i c he Ar bei t en der Fac hr i c ht ung Geodäs i e und Geoi nf or mat i k der Lei bni z Uni v er s i t ät Hannov er

I SSN 0174- 1454, Nr . 327 , Hannov er 2016

(4)

Aus s c hus s Geodäs i e der Ba y er i s c hen Ak ademi e der Wi s s ens c haf t en ( DGK) Al f ons - Goppel - St r aße 11 • D – 80 539 Münc hen

T el ef on +49 – 89 – 23 031 1113 • T el ef ax +49 – 89 – 23 031 - 1283 / - 1100 e- mai l pos t @dgk . badw. de • ht t p: / / www. dgk . badw. de

Pr üf ungs k ommi s s i on Vor s i t z ender : Ref er ent : Kor r ef er ent en:

Pr of . Dr . - I ng. St efen Sc hön Pr of . Dr . - I ng. Chr i s t i an Hei pk e Pr of . Dr . - I ng. Uwe Sör gel Pr of . Dr . - I ng. Moni k a Ses t er T ag der mündl i c hen Pr üf ung: 23. 09. 2016

© 2016 Bay er i s c he Ak ademi e der Wi s s ens c haf t en, Münc hen

Al l e Rec ht e v or behal t en. Ohne Genehmi gung der Her aus geber i s t es auc h ni c ht ges t at t et ,

di e Ver öfent l i c hung oder T ei l e dar aus auf phot omec hani s c hem Wege ( Phot ok opi e, Mi k r ok opi e) z u v er v i el f äl t i gen

I SSN 0065- 5325 I SBN 978- 3- 7696- 5196- 6

(5)

3

Abstract

Modern subsidence monitoring for urban areas comprises active spaceborne techniques like synthetic aperture radar (SAR). Specifically, the persistent scatterer interferometry (PSI) has reached market maturity in recent years. This weather independent remote sensing approach allows for large-area observations over long time series and is capable of detecting movements at the scale of some millimeters per year. Recent missions like TerraSAR-X, TanDEM-X, and CosmoSkyMed offer ground resolutions reaching down to 0.6 m, which refined the monitoring granularity from single blocks of buildings towards individual houses and even particular facades. Nevertheless, more advanced monitoring tasks like capturing torsions or other non-rigid deformations demand even finer assignments of individual radar scatterers to their corresponding geometric structures. The spatial resolution of PSI has the potential for establishing such correspondences, but in order to assign individual scatterers to their counterparts at facades a suitable facade representation has to be available. Furthermore, PSI is an opportunistic technique to the effect that it cannot be guaranteed that a particular facade can be used for monitoring. This is due to the fact that the physical nature of many persistent scatterers (PSs) is still unknown, i.e. the exact scattering mechanism at the geometrical structure in general is obscure. Even though simulations revealed some scattering mechanisms at trihedral faces like window corners, the majority of scatterers can be assigned to facades but not to the exact building structure. Thus, sometimes statements about deformation rates are made within millimeter precision, without exactly knowing which structure on the facade was measured.

Airborne oblique imagery delivers optical acquisitions of the scene in a viewing angle comparable to that of SAR sensors. The typically higher spatial resolution and the good interpretability for human operators make this data a very suitable source of information.

Geometrical features like window corners, which are known to induce PSs, can be extracted from optical images with high geometric accuracy.

In this thesis, optical oblique images of building faces are used as their representations

of the real facade. A method of matching PSs to individual structures of the buildings

(6)

mapped in oblique imagery is derived. Even though the viewing direction is similar, the mapping geometries of SAR and optical oblique imagery are very different. To cope with this difference, a feature of many modern multistory buildings is exploited: the regular alignment of windows at the facade. A plethora of office buildings in urban areas are characterized by steady patterns. Those can be extracted both in radar and optical acquisitions of the facade. This is the initial point of this thesis in which a matching algorithm based on graph theory is derived. Regular patterns are grouped in SAR data as well as the optical image by assuming that the facade consists of repeated regular patches of same appearance. One key idea is to perform the subsequent matching by considering facade objects instead of single PSs. On this basis prior knowledge is introduced, like the assumption that all regularly aligned scatterers at the facade lie in the same plane. Nevertheless, every PS is assigned to its individual counterpart in the oblique image and carries an accuracy information.

The developed object-based approach also allows one to derive topology information from the very precise range-azimuth domain of the SAR data and incorporate it together with a geometrical measure into the matching. This helps mitigating the inaccuracy induced by the projection into the image compared to a solution based on individual PSs. The derived method bases on the iterative application of the Hungarian algorithm and is proven to always yield the optimal solution as long as well defined constraints are met.

With the aid of a variety of case studies, it is shown that a meaningful assignment of PSs to their correspondences in optical oblique images can be achieved. The presented method is robust against changing contrasts on the facade due to shadows, steep aspect angles, and also works on partly occluded building faces due to the object-based approach.

In order to derive a statement about the feasibility and quality of assigning individual PSs

to structures at the facade, the area of the repeated regular patch is compared to the area

of the 95% confidence ellipse of the projected PS position in the image. The latter is found

to be usually smaller than the extent of the repeated element at the facade which means

that a meaningful assignment was found.

(7)

5

Zusammenfassung

Satellitengest¨ utzte Fernerkundungssensoren sind ein wichtiger Bestandteil moderner Metho- den zur ¨ Uberwachung von Bodenbewegungen. Insbesondere die Persistent Scatterer Interfer- ometrie (PSI), die ein spezielles Auswerteverfahren der bildgebenden Radar-Fernerkundung ist, erreichte in den letzten Jahren breite Anwendung. Diese wetterunabh¨angige Technik erm¨oglicht großfl¨achige Beobachungen ¨ uber lange Zeitr¨aume bei einer Aufl¨osung der Defor- mationsmessung von bis zu wenigen Millimetern pro Jahr. Moderne Satellitenmissionen wie TerraSAR-X, TanDEM-X und CosmoSkyMed besitzen Bodenaufl¨osungen von bis zu 60 Zen- timetern. Im Vergleich zu fr¨ uheren Sensoren verfeinerte dies die M¨oglichkeiten der Zuordnung von Streuern zu einzelnen Fassaden. Dennoch ben¨otigen genauere ¨ Uberwachungsmethoden noch feinere Lokalisierungen der Reflexionsmechanismen. Die r¨aumliche Aufl¨osung der PSI- Methode bietet das Potential dazu. Um jedoch eine Zuordnung einzelner Streuer zu ihren Entsprechungen an Fassaden herzustellen, ben¨otigt man ein gutes Modell ebendieser. Die PSI ist ein opportunistisches Verfahren. Dies bedeutet, dass f¨ ur eine bestimmte Fassade nicht garantiert werden kann, dass f¨ ur eine ¨ Uberwachung g¨ unstige Streumechanismen vorhanden sind. Der Grund daf¨ ur ist, dass die genauen physikalischen Ursachen f¨ ur die Entstehung von Persistent Scatterern (PS) in vielen F¨allen noch unbekannt sind. Zwar wurden mittels Simulationen einige Streumechanismen, beispielsweise an Fensterecken, erkl¨art. F¨ ur die Mehrzahl an Streuern kann aber nach wie vor nur eine eindeutige Zuordnung zu Fassaden, nicht jedoch zu den genauen geometrischen Strukturen an ebendiesen, gemacht werden. Dies bedeutet, dass oftmals millimetergenaue Aussagen ¨ uber Deformationen getroffen werden, ohne genau zu wissen, welche Struktur an der Fassade gemessen wurde.

Schr¨agluftbilder liefern optische Abbildungen der Szene unter einem ¨ahnlichen Blickwinkel wie Synthetische-Apertur-Radar (SAR)-Sensoren. Außerdem weisen sie ¨ ublicherweise eine im Vergleich zu SAR h¨ohere r¨aumliche Aufl¨osung sowie eine f¨ ur den menschlichen Betrachter einfachere Interpretierbarkeit auf. Somit stellen sie eine geeignete Quelle an Informationen

¨

uber die Fassade dar. Geometrische Merkmale wie Fensterecken, von denen bekannt ist,

dass sie Persistent Scatterer verursachen, k¨onnen mit hoher Genauigkeit extrahiert werden.

(8)

In dieser Arbeit werden optische Schr¨agluftbilder der Fassaden als deren geeignete Abbil- dung genutzt und eine Methode entwickelt, die Radarstreuer einzelnen Fassadenstrukturen im Bild zuzuordnen. Fensterecken, die aus den optischen Bildern extrahiert wurden, dienen als Partner f¨ ur die Zuordnung. Auch wenn die Blickrichtungen beider Sensoren ¨ahnlich sind, unterscheiden sich die Abbildungsgeometrien sowie die verwendeten Wellenl¨angen erheblich. Um dennoch eine Zuordnung etablieren zu k¨onnen, wird eine Eigenschaft vieler mehrst¨ockiger Geb¨aude ausgenutzt: die regelm¨aßige Anordnung von Fenstern an der Fassade.

Diese gitterartigen Muster k¨onnen sowohl in optischen als auch in SAR-Aufnahmen des entsprechenden Geb¨audes erkannt und beschrieben werden. Dies ist der Zusammenhang, bei dem die Methode dieser Arbeit ansetzt. Es wird ein auf Graphmatching basiertes Verfahren entwickelt, welches solch regelm¨aßige Muster extrahiert und eine 1-zu-1-Zuordnung zwischen jedem PS und seiner Entsprechung im optischen Bild herstellt. Regelm¨aßige Muster werden sowohl in den SAR-Daten als auch im optischen Bild extrahiert unter der Annahme, dass die Fassade aus sich wiederholenden gleichen Teilen besteht. Bei der anschließenden Zuordnung ist ein zentraler Gedanke, ein Fassadenobjekt anstatt viele einzelne PS zu betrachten. Auf dieser Grundlage l¨asst sich Vorwissen, wie beispielsweise die Annahme, dass alle PS an der Fassade in einer Ebene liegen, einf¨ uhren. Das Approximieren der Fassade durch eine gemeinsame Ebene wird genutzt, um den Fehlerhaushalt der einzelnen PS zu reduzieren.

Die objekt-basierte Betrachtung des Problems erlaubt die explizite Formulierung der Nach- barschaftsbeziehungen der PS untereinander. Diese wird gemeinsam mit einem geometrischen Maß in das Zuordnungsproblem eingef¨ uhrt, um eine h¨ohere Robustheit gegen¨ uber einer rein geometrischen L¨osung zu erreichen. Die entwickelte Methode basiert auf der iterativen Anwendung des Ungarischen Algorithmus. Es wird bewiesen, dass sich unter den definierten Randbedingungen eine optimale und garantiert konvergierende L¨osung ergibt.

Anhand vielf¨altiger Experimente wird gezeigt, dass eine richtige Zuordnung zwischenPS

und ihren Entsprechungen im optischen Schr¨agluftbild hergestellt werden kann. Das Ver-

fahren ist robust gegen¨ uber sich lokal ¨anderndem Kontrast auf der Fassade sowie steilen

Blickwinkeln und kann aufgrund der objekt-basierten Betrachung erfolgreich teil-verdeckte

Fassaden verarbeiten. Um eine Aussage ¨ uber die Qualit¨at der Zuordnung zu machen,

wird die Fl¨ache eines sich wiederholenden, gleichen Fassadenteils mit der Fl¨ache der 95%-

Konfidenz-Ellipse eines in das Bild projizierten PS verglichen. Diese ist ¨ ublicherweise kleiner

als das wiederholte Fassadenelement, was bedeutet, dass eine eindeutige Zuordnung erreicht

wurde.

(9)

Contents 7

Contents

Abbreviations and notation 9

1. Introduction 11

1.1. Motivation . . . . 11

1.2. Objectives and contributions . . . . 14

1.3. Structure of the thesis . . . . 16

2. Basics 17 2.1. Persistent scatterers . . . . 17

2.1.1. Synthetic aperture radar . . . . 17

2.1.2. Persistent scatterer interferometry . . . . 22

2.2. Oblique optical imagery . . . . 24

2.3. The inaccuracy budget of persistent scatterers projected into oblique images . . . . 26

2.3.1. Geocoding of SAR acquisitions . . . . 27

2.3.2. Projection of single PS object coordinates into oblique images . . . . 31

2.4. Graphs . . . . 33

2.5. Bipartite graph matching . . . . 35

3. State of the art 39 3.1. Recent developments and applications of PSI . . . . 39

3.2. Persistent scatteres at facades . . . . 42

3.3. Grouping of persistent scatterers . . . . 43

3.4. Fusion of SAR data with other sources . . . . 44

3.5. Facade extraction and description in optical imagery . . . . 45

3.6. Graph matching . . . . 47

3.7. Objectives revisited . . . . 48

4. Object-based matching of PSs to optical oblique imagery 51 4.1. Regularity at facades . . . . 51

4.2. Fundamental assumptions . . . . 54

4.3. Grouping persistent scatterer point cloud data . . . . 56

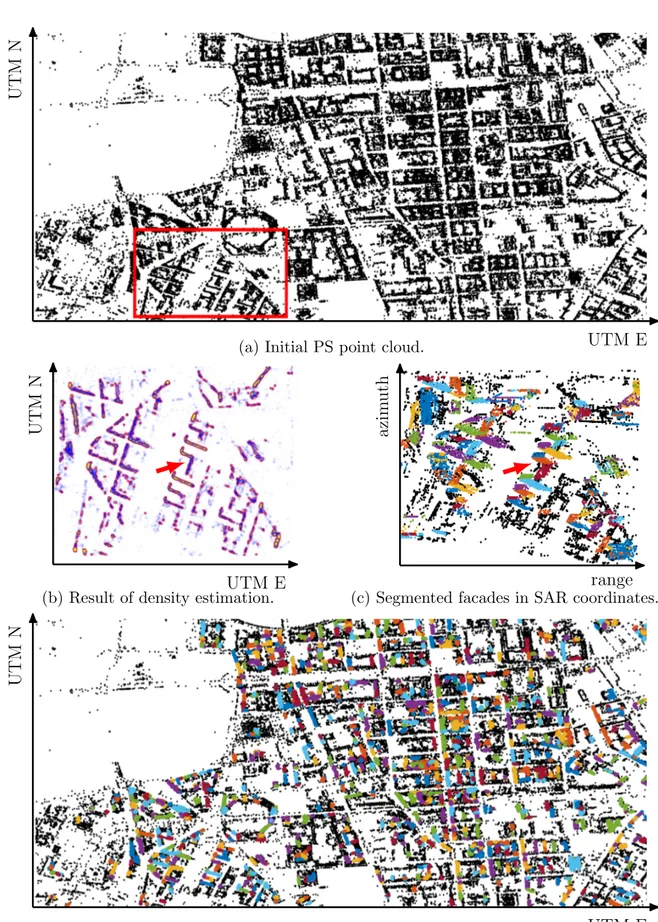
4.3.1. Segmenting the persistent scatterer point cloud . . . . 57

(10)

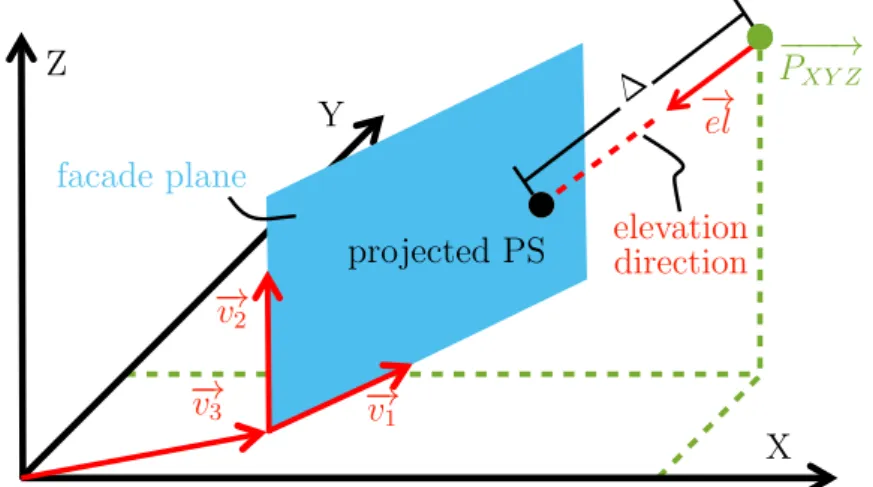
4.3.2. Projection of PSs onto the facade plane . . . . 60

4.3.3. Extracting regularity from PS point clouds . . . . 64

4.4. Lattice extraction in optical oblique imagery . . . . 67

4.4.1. Image rectification . . . . 69

4.4.2. Segmenting the facade . . . . 71

4.4.3. Explicitly modeling the window . . . . 74

4.5. Iterative graph-based bipartite matching . . . . 78

4.5.1. Topology information . . . . 82

4.5.2. Optimization scheme . . . . 84

4.6. Improving the accuracy of PS in optical images . . . . 88

5. Experiments 93 5.1. Data description . . . . 94

5.2. Regular facades in urban area: case study Berlin . . . . 95

5.3. Grouping of persistent scatterers . . . . 96

5.3.1. Grouping of PSs: Park Kolonnaden . . . . 97

5.3.2. Grouping of PSs: Charlottenstraße . . . 100

5.4. Window corner extraction . . . 102

5.4.1. Window corner extraction: Park Kolonnaden . . . 103

5.4.2. Window corner extraction: Charlottenstraße . . . 105

5.4.3. Window corner extraction: Axel-Springer building . . . 105

5.5. Iterative graph-based bipartite matching . . . 107

5.5.1. IGBM: Park Kolonnaden . . . 107

5.5.2. IGBM: Charlottenstraße . . . 111

5.5.3. IGBM: Axel-Springer building . . . 111

5.5.4. IGBM: Ebertstraße . . . 114

5.6. Balance between geometry and topology . . . 116

5.7. Application to the whole test area . . . 118

6. Conclusions and open questions 121 6.1. Summary and conclusion . . . 121

6.2. Future work . . . 124

Bibliography 125 Appendices 129 A. Proof of K˝onig-Egerv´ary Theorem . . . 129

B. Example of the Hungarian algorithm . . . 131

(11)

Abbreviations and notation 9

Abbreviations and notation

DEM digital elevation model.

GNSS global navigation satellite system.

GSD ground sampling distance.

IGBM iterative graph-based bipartite matching.

IMU inertial measurement unit.

InSAR interferometric synthetic aperture radar.

LOS line of sight.

NCC normalized cross correlation.

PS persistent scatterer.

PSI persistent scatterer interferometry.

RANSAC random sample consensus.

SAR synthetic aperture radar.

SCR signal-to-clutter ratio.

SNR signal-to-noise ratio.

UTM universal transverse mercator.

Throughout the thesis, scalars are depicted as lower case or capital Latin or Greek

characters, e.g. a, A, or α. Vectors are denoted with an arrow on top of the symbol: − → a ,

while matrices are written in lowercase or capital bold characters: a or A. Sets of any

entities are denoted in calligraphic letters, e.g. A .

(12)
(13)

11

1. Introduction

1.1. Motivation

Remote sensing is an indispensable technique in multiple fields of geoscience. The non- contact acquisition of information about the Earth’s surface builds the basis for many applications in agriculture, regional planning, mapping, settlement monitoring, landslide detection, and many other applications at the local, regional, and national scale. Especially the weather and sun independent synthetic aperture radar (SAR) systems play an important role for time critical tasks like damage mapping after natural disasters or reliable long-term monitoring of surface deformation areas. In recent years, spaceborne radar sensors have also become widely used for subsidence monitoring as a result of mining. Movements in sensing direction of up to a few millimeters per year can be resolved. In such scenarios, statements about large structures or even building blocks are made. But the geometrical resolutions of modern SAR sensors allow for applications with much more spatial detail since the identification of single small buildings and even parts of facades are now possible. Together with the persistent scatterer interferometry (PSI) processing technique, the assignment of individual scatterers, so called persistent scatterers (PSs), to parts of buildings comes into reach. As a consequence, instead of only detecting rigid movements of complete buildings, more complex deformations like torsions can be monitored. But even though the sensing geometry itself is known, SAR images often require an experienced human interpreter in order to extract information about the nature of the sensed objects. On the one hand, this is due to the used wavelengths which lie in the microwave spectrum, and on the other hand, due to the unknown geometry of the irradiated objects on the surface leading to complex reflection mechanisms. Thus, the physical nature of the object position corresponding to a single pixel in the SAR acquisition, i.e. its equivalent in the object space, is often not known and therefore subject to ongoing research.

Optical remote sensing sensors are also well established. Especially oblique imagery has

seen a rise in the last decade. For instance, many municipalities acquire optical images of their

(14)

X

Y

(a) Optical oblique image.

range

az im u th

(b) SAR amplitude image with PSs in red.

Figure 1.1: Example for the appearance of facades in optical and SAR data.

inhabited areas in order to use them as a tool for various planning activities, monitor long-

term developments or create three-dimensional models of their cities or townships. Compared

to SAR products, the interpretation of optical images is easier even for inexperienced

operators. Commonly, the ground sampling distance (GSD), i.e. the spatial resolution,

of airborne oblique imagery is in the range of 5 cm to 40 cm, while modern SAR sensors

reach a resolution on the ground of some 60 cm to 120 cm. Given a SAR acquisition and

an optical oblique image of the same facade, the latter typically carries more information

about the structure and condition of the building face. This is a central motivation for this

thesis: if an assignment of individual PSs to their counterparts in optical oblique imagery is

established, it could be used to learn something about the physical nature of the scatterers

and may lead the way towards an automatic interpretation of the SAR scene. Finding such

correspondences imposes the challenging task of matching PSs to features derived from

optical imagery. The sensing geometries and used wavelengths are rather different, which

results in two very distinct appearances of the same facade in both sensor types. Figure

1.1 gives an example. In the optical oblique image, three facades of a building complex

are shown, marked with colored rectangles. The same facades in the SAR acquisition of

Figure 1.1b are consistently marked. In the background, the mean amplitude image is shown

as gray values. Bright pixels correspond to high intensities of the sensed signal. The red

points mark the result of a PSI processing, yielding temporarily stable scatterers with a

high signal-to-noise ratio (SNR). The regular alignment of facade structures is striking in

both data sets. Lines of PSs are discernible and comparing them to the facades in the

optical image makes the correspondence to the distribution of windows evident. This is

(15)

1.1. Motivation 13

(a) Sketch of reflections in trihedral corner. (b) Example of typical window corner.

Figure 1.2: (a) Sketch of two threefold reflections in a trihedral corner reflector as it is often formed by window sills, window frames and the welting building wall. (b) Example window corner which forms a trihedral corner reflector with nearly rectangular planes.

especially true for the facade marked in red. An assignment of PSs to individual windows can be made visually. In fact, the regular alignment of objects at the facades is preserved in both imaging geometries and window corners often induce PSs. The latter results from a scattering mechanism that is already well understood: the threefold reflection in trihedral corners. Three perpendicular planes form structures that reflect the incoming signal back, independently of the direction of the incoming signal, as long as the inlying faces of the trihedral structure are visible for the sensor. Such corner reflectors are often formed by the window sill, the window frame, and the wall of the recessed window. Figure 1.2 shows such a scattering mechanism. A sketch of the reflection model for two rays is depicted in Figure 1.2a. A corresponding real world example of such a window corner is shown in Figure 1.2b.

The aim of this thesis is to develop a method for the automatic identification of the equivalents of PSs in optical oblique images. The principal intricacy to overcome is the inherently different appearance of urban objects in data originating from both sensor types.

A key idea to cope with this challenge is to exploit regularities which are discernible in

both data domains. The alignment of facade objects like windows or balconies is often very

regular and can be described by a lattice in many cases. Graph matching techniques are

used in order to match lattice nodes extracted from SAR data to regular point features

derived from an optical oblique image of the same facade. This task is formulated as an

optimization problem aiming at minimizing the geometrical distance between PSs projected

into the image and their matching partners, as well as maintaining the topology of the

(16)

grouping. The desired result is a one-to-one assignment of every PS to its equivalent in the optical oblique image. The topology information is used to mitigate possible inaccuracies originating from the SAR domain and the projection into the image. The resulting matching offers the opportunity to systematically investigate the mechanisms leading to the occurrence of PSs at facades which has been found to be dependent on the sensor’s line of sight (LOS) and many other sensing parameters. Another application is change detection after natural disasters in a setup where a PS point cloud is available at the time before the event arose.

The airborne optical imagery is matched to the PS data and the degree of destruction can be derived.

1.2. Objectives and contributions

In this thesis, a new method for matching PSs to their correspondences in optical oblique imagery is derived. The following three contributions are fundamental for the achievement of this goal. First, the patterns in data of both sensor types are extracted and described.

The PS point cloud data is segmented into separate facade clusters followed by a grouping procedure. This information is then transferred into the optical image in order to simplify the pattern recognition. This inter-sensor knowledge transfer allows one to apply rather simple yet very robust methods to extract the patterns in optical images. Once a regularity is found, all PSs and also potential window corners extracted from the optical image are described by a lattice model, respectively. This is the transition from considering individual scatterers towards regarding facade objects which allows one to introduce model knowledge.

Relations of data points to each other within one sensor type are then merged into

the matching procedure. The goal of this assignment algorithm is to transfer the sensor

type internal topology information across the domains and find an optimal solution which

minimizes a geometrical, as well as a topological measure between PSs and their counterparts

in optical data. The geometric measure is induced by the consideration that the distance

between every PS and its counterpart in the image should be as small as possible. On

the other hand, the matching partners of neighboring PSs should also be adjacent. This

constraint can be formulated as a topological measure which sometimes counteracts the

geometrical measure. Furthermore, both terms are mutually dependent on each other and

an optimal solution depends on the relative contribution of each term which has to be

determined. An algorithm is derived and proven to converge and always yields the optimal

solution in terms of the matching, as well as the final position of all PSs in the image.

(17)

1.3. Structure of the thesis 15

Projection from SAR to image

(Section 2.3) Single Facades

Segmentation (Section 4.3.1) PS point cloud

single oblique image Image selection Optical Oblique

Imagery

Regularity Extraction (Section 4.3.3)

Window extraction (Section 4.4) PS Facade in image

iterative graph-based bipartite matching

(Section 4.5) topology information

(Section 4.5.1) Lattice in image

Optimal Matching, Position of PS in image.

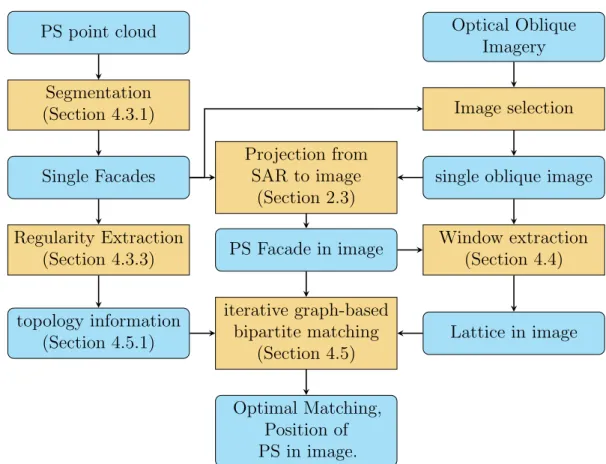
Figure 1.3: Flowchart of the presented method. The sections in brackets contain detailed information about the respective steps.

As the third main contribution of this thesis, investigations are made about how accurate the assignment between PSs and their corresponding optical features can be established.

Also, approaches to improve the accuracy of the image coordinates of aggregated PSs

compared to simply projecting single scatterers into the image are made. The position

uncertainty of the PS position in the optical image is mostly determined by the relatively

inaccurate elevation direction. Compared to the other two SAR coordinates range and

azimuth the localization accuracy in elevation is worse by a factor of 20. Furthermore,

the projection itself carries inaccuracies typically dominated by the exterior orientation

parameters of the camera. In order to cope with these influences, assumptions are made like

the claim that all regular PSs at the facade lie in a plane. This model knowledge and other

considerations then are converted into remedies which reduce the inaccuracy down to the

level that individual structures of the facade can unambiguously be identified.

(18)

1.3. Structure of the thesis

This thesis is structured as follows. First, in Chapter 2 some basics are presented which form the foundation of the methods derived later. The inaccuracy of the projection of PSs into oblique images and fundamentals of graph matching are of particular interest. Chapter 3 gives insights into related work. This includes recent developments of SAR processing techniques as well as grouping of PS point clouds and approaches to fuse them with data from other sources.

The new method for assigning PSs to their correspondences in optical imagery is then described in Chapter 4. Fundamental assumptions which imply constraints and limitations of the matching approach are explicitly stated in Section 4.2. Figure 1.3 shows the flowchart of the method and also the corresponding sections. The structure of the method chapter basically coincides with the procedure itself. First, the segmentation and grouping of a PS point cloud is described. This result is then projected into the image and used in the extraction of regular window corners in the optical imagery. Both results are then introduced into the derived iterative graph-based bipartite matching (IGBM) algorithm, resulting in an optimal matching and the final positions of the PSs in the image. The influences of each processing step onto the resulting accuracies of PS assignments in the image are highlighted in Section 4.6.

In order to validate the most fundamental propositions derived, experiments are conducted

in Chapter 5. Selected case studies show the applicability of the method and investigate their

characteristics and limitations. Some violations of made assumptions and their consequences

on the result are also presented. A short summary of results and an outlook on open research

topics in this field are given in Chapter 6.

(19)

17

2. Basics

This chapter addresses some fundamentals on the creation and characteristics of the used data, namely PS point clouds (Section 2.1) and optical oblique imagery (Section 2.2). Section 2.3 states the inaccuracy budget of the combined coordinate transformation from the SAR domain into the optical image. The basics of graphs and bipartite graph matching are given in Section 2.4 and Section 2.5, respectively.

2.1. Persistent scatterers

Persistent scatterers are the result of the PSI processing technique. Only the main concepts of SAR and PSI are outlined here. A detailed explanation is beyond the scope of this thesis, since the PSI processing is not part of the presented method. Only important aspects, which are crucial for understanding the developed approaches are highlighted. A more comprehensive treatment can be found in Kampes [2006] or Moreira et al. [2013], for instance.

2.1.1. Synthetic aperture radar

A SAR is an active remote sensing system which is mounted on a moving platform, i.e.

plane or satellite, and sequentially illuminates the Earth’s surface in an oblique angle with

electromagnetic radiation. The emitted radiation interacts with the objects on the ground

and is partly backscattered to the receiving antenna. For remote sensing purposes, the used

wavelength typically lies in between one centimeter up to one meter where a tradeoff between

geometrical resolution versus penetration depth has to be taken into account [Moreira et al.,

2013]. The emitted signal has to be coherent in order to combine series of measurements

into an integrated SAR acquisition. In order to resolve the complex nature of the signal,

the received pulses are sampled twice. SAR systems deliver two-dimensional images of the

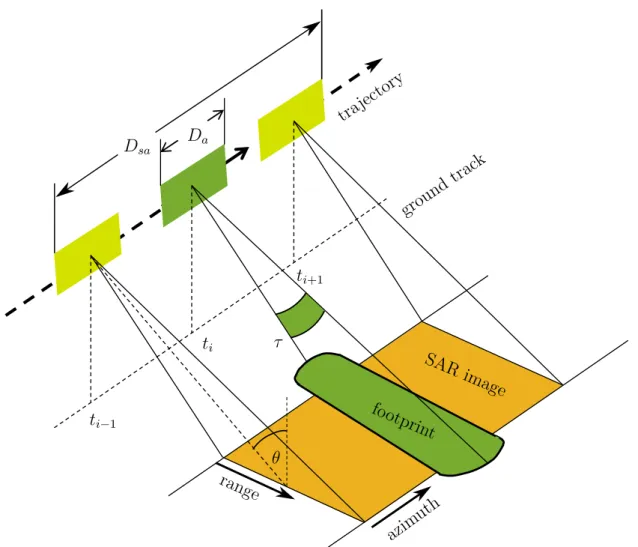
illuminated objects. Figure 2.1 shows the imaging geometry schematically. The sensor moves

(20)

tra jec tor y

gro un d t rac k D a

t i − 1

t i

t i+1

SAR image

θ

footp rint D sa

range

az im ut h τ

Figure 2.1: Sketch of imaging geometry of a SAR acquisition. The SAR image, depicted as orange area, is formed by coherently integrating the signal from t i − 1 to t i+1 .

along its trajectory, which is denoted as azimuth direction and coincides with the first image coordinate. The emitted pulse of duration τ is directed sideways and nearly orthogonal to the azimuth direction. On the Earth’s surface the pulse forms a footprint on the ground which is marked in green in Figure 2.1. The travel time of the signal is directly proportional to the distance between the objects on the ground and the sensor. This direction is denoted as range and coincides with the second image coordinate. The resolution in range direction ρ r is directly proportional to the length of the pulse τ :

ρ r = τ c 0

2 , (2.1)

where c 0 is the speed of the emitted pulse in the atmosphere and the factor 1 2 results from

traversing the distance sensor-object twice. For most applications, the projection of the

(21)

2.1. Persistent scatterers 19

range direction and its resolution onto the ground plane is of interest and achieved by incorporating the incidence angle θ as:

ρ gr ≈ τ c 0

2 sin θ . (2.2)

The resolution in azimuth direction is determined by the antenna beam width which is approximately inversely proportional to the real aperture size D ra :

ρ az,ra ≈ λ r D ra

(2.3) where λ is the used wavelength and r is the distance to the sensed target. D ra denotes the length of the real antenna. Incorporating a set of consecutive pulses with overlapping footprints results in a synthetic aperture of length

D sa = λr D ra

(2.4) and an improved resolution in azimuth direction of [Bamler & Sch¨attler, 1993]:

ρ az,sa ≈ λ r D sa

= λ r D ra

2 λ r = D ra

2 . (2.5)

In the remainder of this thesis only the resolution in azimuth for the synthetic aperture is considered and denoted as ρ az . A detailed derivation of the SAR image formation is out of the scope of this thesis and the reader is therefore referred to Bamler & Sch¨attler [1993]. A notable finding is that the azimuth resolution is range independent and improves with a smaller real aperture. Modern spaceborne sensors like TerraSAR-X offer a further enhancement of the azimuth resolution by electronically steering the beam towards the target scene, resulting in an even longer synthetic aperture [Eineder et al., 2009].

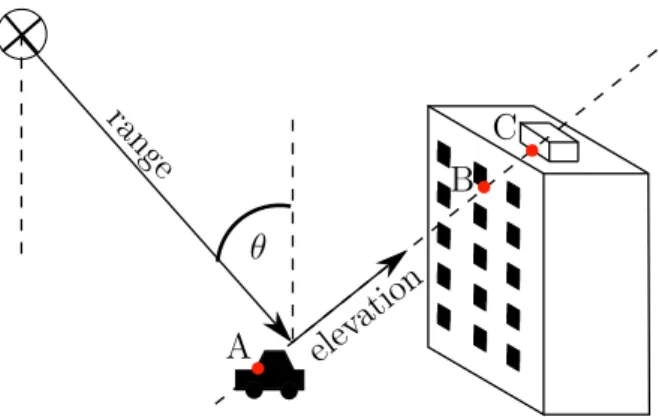
The side-looking imaging geometry of SAR acquisitions can be approximated by a cylindrical projection with the Z-coordinate corresponding to the trajectory of the satellite, i.e. azimuth direction [Soergel, 2010]. The orthogonal distance from the cylinder’s axis is given by the range between the sensor and the object. The angle defining the point of the reflection on the circle of equal distances corresponds to the elevation direction. As a consequence of mapping the three-dimensional object into a two-dimensional image, some imaging effects have to be taken into account. For the task of matching PSs to optical imagery, the mixture of signal contributions, denoted as layover, has the largest impact.

It is the direct result of not resolving the elevation angle. Figure 2.2 shows this effect

(22)

θ ran ge

ele va tio n A

B C

Figure 2.2: Sketch of signal mixing due to layover in one resolution cell of a SAR acquisition.

The azimuth direction points into the paper plane. In this example the received signal contains contributions from all three points (A, B, and C).

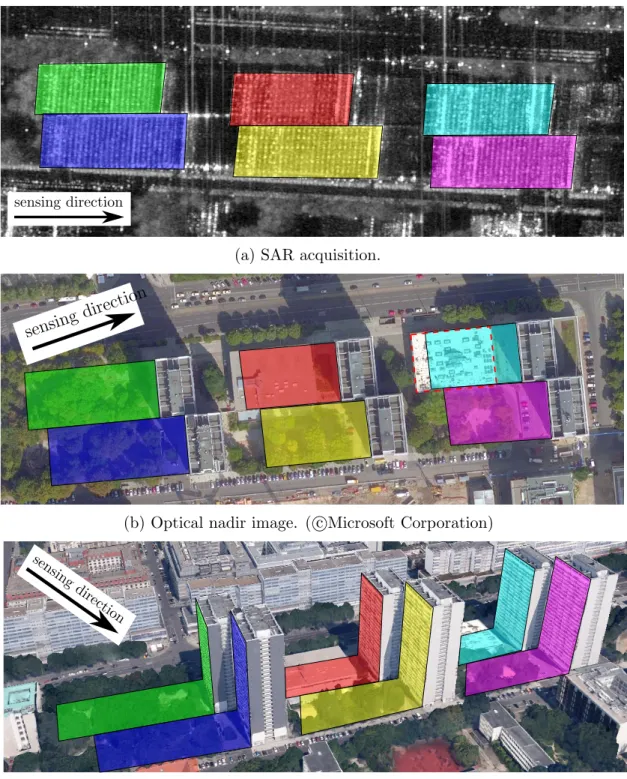
schematically. The objects on the surface are sensed under the incidence angle θ. Due to the large distance between sensor and scene, the phase fronts are parallel and all points of the same distance from the sensor are approximated as a line. In this sketch, the car (A), a window corner (B), and some structure on the roof (C) have the same distance from the sensor and, therefore, the same range coordinate. This results in a mixture of the integrated signal. A more realistic example is given in Figure 2.3. The areas affected by layover of a housing complex consisting of six multi-storage buildings are shown. In the cyan layover area, for example, a two-story, flat roofed supermarket is fully overlayed with signal contributions originating from the facade of the nearby multi-story building.

In order to resolve this two-dimensional mapping of the three-dimensional object, several acquisitions with slightly different sensor positions are exploited. As described in Section 2.1.2, the three-dimensional position of the most dominant scatterer can often be computed.

In the following it is assumed that the correct object coordinates can be found by the PSI processing.

Shadowing and foreshortening are two other effects which are characteristic for the SAR

imaging geometry. Specifically high rise buildings lead to shadowing in urban scenes resulting

in areas which are invisible to the sensor. This can be mitigated to some extent by combining

two different viewing aspects. Given that SAR data from ascending and descending viewing

directions are available, this effect can be omitted. Foreshortening occurs when the observed

area is bent towards the sensor. Since this thesis solely deals with the appearance of facades

in urban areas which are assumed to be vertical, this effect is also no longer taken into

account.

(23)

2.1. Persistent scatterers 21

sensing direction

(a) SAR acquisition.

sens ing dire ctio n

(b) Optical nadir image. ( c Microsoft Corporation) sen sin

g d irec tion

(c) 3D model ( c Google Earth).

Figure 2.3: Complex of six multi-story buildings in the city center of Berlin. The colored

areas mark areas which are affected by layover. (a) Mean amplitude image of a

stack of 79 TerraSAR-X acquisitions. (b) Optical nadir image. The presence

of a separate buildings in the layover area marked in cyan can be seen as a

white rectangular roof (outline highlighted with red dashed line). (c) A three-

dimensional city model of the building complex.

(24)

φ

| A |

Re Im

Figure 2.4: Sketch of the complex signal inside one resolution cell. Black vectors symbolize individual scattering contributions. The resulting signal which is the sum of all individual contributions is shown in red. It is dominated by one scatterer with a large amplitude compared to all other scatterers.

2.1.2. Persistent scatterer interferometry

For a given azimuth and range coordinate, the complex valued signal can be expressed as a vector in polar coordinates in which the amplitude corresponds to the length and the phase to the angle with respect to zero. The footprint covered by a distinct azimuth and range coordinate contains many scattering contributions which are integrated into the resulting and measured signal (omitting influences of the atmosphere). Figure 2.4 illustrates the composing of the resulting signal schematically. The black vectors are individual scatterer contributions inside the same resolution cell. The red vector is the summed signal which is received by the sensor. It is dominated by one strong contribution which exhibits a larger amplitude compared to the other scattering contributions. Of course, two strong scatterers with nearly opposed phase values can extinguish each other resulting in a resolution cell with apparently no dominant scatterer present.

The largest advantage of SAR remote sensing is the possibility to analyze the coherent signal over time, and measure movements of the observed objects at the scale of fractions of the used wavelength. In order to do so, a time series of acquisitions covering the scene under investigation is necessary. For TerraSAR-X the orbit repetition time is 11 days which allows for many applications like monitoring of widespread construction sites or anthropogenic subsidence events as a result of mining. The movement of the object in LOS of the sensor can be measured by analyzing the residual phase of at least two acquisitions of the same scene. This is the basic principle of interferometric synthetic aperture radar (InSAR).

Not only does the displacement Φ def o of the object between two acquisitions affect the

interferometric phase Φ, but also dissimilar appearances of the object under slightly different

viewing directions due to the surface topography Φ topo , different atmospheric conditions

(25)

2.1. Persistent scatterers 23

Φ atmo , errors of the estimated orbit position Φ orb , and random errors in the sensor’s electronics Φ ǫ . Thus, the interferometric phase is composed as the sum of these contributions:

Φ = Φ def o + Φ topo + Φ atmo + Φ orb + Φ ǫ . (2.6) The PSI technique describes the decomposition and computation of the interferometric phase as well as the selection of temporarily stable scatterers where this analysis is feasible. The reduction onto temporarily stable scatterers simplifies the reliable mitigation of atmospheric influences. In the following, the technique is briefly summarized based on the detailed description given in Kampes [2006].

A resolution cell is considered as temporarily stable if the temporal standard deviation of the amplitude is small with respect to the mean amplitude [Ferretti et al., 2001]. This relation can directly be evaluated pixel by pixel through the stack of acquisitions and does not need spatial context which allows the detection of isolated points. A more robust approach is to consider the signal-to-clutter ratio (SCR) which is spatially estimated assuming that a dominant scatterer is surrounded by clutter and that the intensity of clutter can be estimated from resolution cells surrounding the dominant scatterer [Adam et al., 2004].

The phase contribution of the topography can be computed and subtracted by incorpo- rating a digital elevation model (DEM). The resulting interferometric phase is referred to as differential InSAR phase. The height of the PSs are also parameters in the PSI processing.

The atmosphere is considered to be temporarily uncorrelated but spatially stable. This behavior can be formulated as a high-pass filter over time and low-pass filter over the spatial domain. A similar contribution which cannot be separated from the atmosphere is the orbit estimation. Typically, a linear or periodic model for the scatterer movement is assumed and used to estimate the resulting deformation contribution of the differential phase. The estimation is conducted in a redundant network-like setup which consists of the most dominant scatterers, i.e. those with the smallest standard deviation with respect to the mean amplitude or highest SCR, respectively. After all contributions to the interferometric phase have been estimated for this coarse network, all PSs are appended to it [Gernhardt, 2012].

In order to assign a three-dimensional Cartesian object coordinate to a PS, the precisely known LOS of the satellite is intersected with the DEM plus the estimated height of the PS.

Due to the network-like estimation setup, the heights of all PSs are relative with respect to

a manually chosen reference point. Thus, a constant offset of the heights has to be taken

into account. This geocoding procedure is explained in detail in Gernhardt [2012].

(26)

2.2. Oblique optical imagery

Optical oblique imagery has a long history dating back to the beginning of the 20th century [Slama et al., 1980]. The optical axis is pointed to a direction between the horizontal and the vertical axis resulting in an oblique view of the depicted scene. Typically, incidence angles between 40 to 50 in the scene center are used. Therefore, and as opposed to nadir acquisitions, facades of buildings are visible which allows for many applications like widespread texturing of city models [Frueh et al., 2004] or even their creation [Xiao et al., 2010]. A typical GSD lies in the range of 5 cm to few decimeters depending on the camera, the aircraft in use, the flying altitude, and the pixel position in the image [Gerke, 2009]. In most cases blocks of overlapping images are captured during a flight campaign resulting in the possibility of stereo processing. Combined with the exterior orientation measured by a global navigation satellite system (GNSS) and inertial measurement unit (IMU) on board the aircraft, or via bundle adjustment, three-dimensional positions of the depicted objects can be derived.

Optical oblique imagery is well suited to extract information from building facades.

Typical oblique camera systems consist of five cameras directed into the four cardinal oblique directions and one nadir view. This means that always at least one image is available where the planimetric angle between any facade’s normal vector projected to the ground and the camera’s LOS in the ground plane is at most 45 . This is a sufficiently small angle to reliably extract facade objects like windows or balconies, as long as those objects can visually be distinguished from the background of the facade. In order to automate the extraction, approaches based on the gradient or texture of the intensity values or color are applied. In general, optical imagery of facades deliver very strong evidence of geometrical structures.

The tilted view direction leads to a changing GSD across the image. Considering only

single facades, this effect can be neglected due to the fact that the area of the image covered

by a facade is usually small compared to the overall acquisition, and the GSD can then be

assumed to be constant in this area. Apart from that, oblique images do not differ from

other types of aerial imagery, e.g. nadir images. Therefore, the standard central projection

model can be applied to this type of data. To map object space coordinates onto an image,

the orientation Ω of the camera is necessary. This includes the camera position in object

space, its alignment in terms of rotations around the axes of the object coordinate system,

(27)

2.2. Oblique optical imagery 25

Y Z

imag e pla ne y

camera x

azim uth

satellite

ra n ge

−−−→ P XY Z

X t az

LO S az im u th

range

−−−→ P rg,az

SAR acquisition

f(t az )

y

x

−→ P xy

optical oblique image

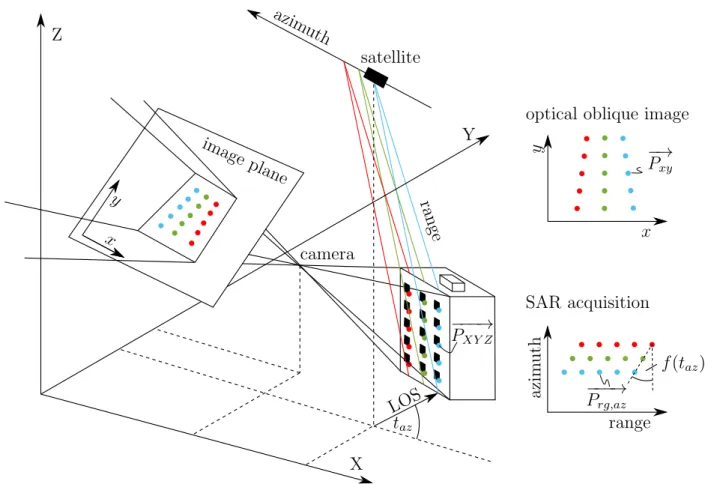
Figure 2.5: A facade mapped in two different imaging geometries. The image taken from the optical camera yields a central perspective. The two-dimensional mapping of the SAR sensor leads to a cylindrical projection.

as well as the interior orientation. The projection from the object point − →

P = { P X , P Y , P Z } into an image is then performed via the collinearity equations

x = x 0 − c · r 11 (P X − X 0 ) + r 21 (P Y − Y 0 ) + r 31 (P Z − Z 0 ) r 13 (P X − X 0 ) + r 23 (P Y − Y 0 ) + r 33 (P Z i − Z 0 ) y = y 0 − c · r 12 (P X − X 0 ) + r 22 (P Y − Y 0 ) + r 32 (P Z − Z 0 ) r 13 (P X − X 0 ) + r 23 (P Y − Y 0 ) + r 33 (P Z i − Z 0 )

, (2.7)

with r ij elements of a 3 × 3 rotation matrix, determined by three rotation angles { ω, φ, κ } . x

and y are the projected image coordinates of the object point − → P . The interior orientation of

the camera is determined by the principle point (x 0 , y 0 ) and the focal length c. The exterior

orientation describes the camera position (X 0 , Y 0 , Z 0 ) and viewing direction { ω, φ, κ } in the

three-dimensional object coordinate system. This equation will be revisited in Section 2.3.2

where the variance propagation from object space to image coordinates is described.

(28)

2.3. The inaccuracy budget of persistent scatterers projected into oblique images

As a consequence of dealing with two different sensors, one task is to transform all data into a common coordinate system to accomplish the registration. Since the overall aim of this thesis is to find the equivalents of individual PSs in optical data, the target coordinate system is a single image. Figure 2.5 shows the mapping of facade points in the object space to the two imaging geometries. On the left side, the mapping of an optical camera is illustrated. The object point −−−→

P XY Z is mapped onto −→

P xy . The image of the whole facade is subject to a perspective projection which is illustrated in the right hand part of the sketch.

In case of the SAR acquisition, the facade is mapped by a cylindrical projection. The angle of shear of the facade mapping is a function of the angle t az between the sensor’s LOS projected to the ground and the facade’s normal.

A common feature of both sensing geometries is fundamental for the reasoning throughout this thesis and can be seen by comparing the mappings of the facade points in Figure 2.5:

Observation 2.1 (topology preservation). Both the projection of the optical camera as well as the imaging geometry of the SAR sensor are topology preserving.

This means that neighborhood relations of windows are retained in a SAR acquisition and an optical image, respectively. This is a simple consequence of the type of transformations between the SAR domain, object coordinates and the projection into the image. Both the projective transformation of an optical perspective camera as well as the cylindrical projection of a SAR system are homeomorphisms for points on planes: if point B is the right side neighbor of point A and left side neighbor of point C on a plane in the object space, this is also the case in the SAR image as well as the optical image. Furthermore, a characteristic of the SAR sensing geometry in the case of facades is notable. The cylindrical projection always maps scatterers which are vertically aligned, meaning that their planimetric position is equal, into the same azimuth coordinate. This is indicated in Figure 2.5 as red, green, and blue lines of scatterers.

Figure 2.6 shows the relations between the SAR, object, and image coordinate systems as

a flowchart. The transformation from SAR to object coordinates is done by geocoding which

needs a DEM as well as the imaging geometry parameters of the radar acquisition. Note

that the resulting accuracy is not affected by the precision of the DEM. In order to project

three-dimensional object coordinates into an optical image, its orientation is needed. The

transformation process from SAR to optical image coordinates and its inaccuracy budget is

(29)

2.3. The inaccuracy budget of persistent scatterers projected into oblique images 27

t az

θ

DEM SAR

rg, az, el

geocoding

object coordinates

X, Y , Z Ω, −−−→

P XY Z

projection

image coordinates

x, y

Figure 2.6: Flowchart of the transformation process from SAR domain to image coordinates.

Object coordinates are obtained by geocoding. The projection into the image needs the projection parameters.

described in the following two sections. The complete transformation can be split into two separate operations, namely the transformation from SAR to object space and subsequently the projection from object space into the image.

2.3.1. Geocoding of SAR acquisitions

The accuracy of the assignment of PSs to their counterparts in optical imagery depends on the transformations from the SAR domain to object coordinates and from there into the image, as well as the localization precision of a point scatterer in the radar stack. The latter is typically found by assuming an ideal point scatterer which means that the impulse response of the SAR system is a sinc-shaped signal [Bamler & Eineder, 2005]. To detect the exact position with subpixel accuracy, a predefined sinc-function is then correlated with the mean amplitude image of the SAR stack. The estimated error between the predefined sinc and the measured signal is a function of the SNR. Assuming zero mean uncorrelated clutter, the precision for the estimation of the mean of N acquisitions is improved by the factor of

√ N [Gernhardt, 2012]. The localization precision in range and azimuth of a PS in a stack of N images with a fixed SNR is then:

σ rg =

√ 3 π √

SNR · N · ρ rg

σ az =

√ 3 π √

SNR · N · ρ az ,

(2.8)

(30)

79 acquisitions 30 acquisitions SNR σ rg [m] σ az [m] σ el [m] σ rg [m] σ az [m] σ el [m]

10 0.012 0.022 0.269 0.019 0.035 0.436 5 0.016 0.031 0.380 0.027 0.050 0.617 2 0.026 0.048 0.601 0.042 0.078 0.975

Table 2.1: Examples of typical localization precisions of single PSs in SAR coordinates.

where ρ rg and ρ az are the spatial resolutions as described in equations (2.1) and (2.5), respectively. The Cram´er-Rao lower bound for the localization precision of the third coordinate, i.e. elevation, of PSs can be approximated by [Bamler et al., 2009]:

σ el ≈ λ r

4π · √

2 SNR · N · σ B

, (2.9)

where λ denotes the system’s wavelength and r the distance from the sensor to the PS under investigation. The accuracy of the elevation direction is a function of the observational basis which can be expressed as the standard deviation σ B of the baseline B perpendicular to the viewing direction. A wider baseline improves the localization precision in elevation direction.

In the case of TerraSAR-X, the absolute orbit positions are limited to a tube with a radius of 250 m which also limits σ B for a fixed number of acquisitions N [Yoon et al., 2009]. For a given scene and sensor, the SNR is fixed. Since the wavelength can also not be influenced from an operator’s perspective, the only possibility to improve the accuracy in elevation direction is to increase the number of acquisitions. Typically, the three SAR coordinate axes are assumed to be uncorrelated which leads to a covariance matrix of the form

Σ RAE =

 

σ rg 2 0 0 0 σ az 2 0 0 0 σ el 2

  . (2.10)

Table 2.1 gives an example of typical values for the localization precision in range, azimuth

and elevation (equations (2.8) – (2.9)) by reference to one ascending SAR stack used in the

experiments Chapter 5. The standard deviation of the perpendicular baseline is 156 m and

the distance from the sensor to the scene center is 673 308 m. The number of acquisitions is

79 and a SNR of 10 dB according to Gernhardt [2012] can be assumed. Since this very high

number of available images in one stack exceeds the typical application case, a more realistic

stack size of 30 is assumed as well (all other parameters are unchanged). In all scenarios the

resolutions in range and azimuth are set to ρ rg = 0.6 m and ρ rg = 1.1 m. Furthermore, worse

SNR conditions as they may occur are taken into account. The resulting numbers show two

(31)

2.3. The inaccuracy budget of persistent scatterers projected into oblique images 29

issues. First, the localization precision in elevation direction is roughly 20 to 30 times worse than in range and azimuth direction. This leads to a highly anisotropic inaccuracy budget in geocoded three-dimensional coordinates. Second, even for a low SNR and a stack size of 30 images the localization precision can be expected to be smaller than the typical extent of a facade object like a window. Even a three-dimensional absolute inaccuracy of roughly one meter, as is the case for a SNR of 2, is smaller than the expected spacing of horizontally or vertically aligned facade objects. This means that the assignment of single PSs to individual repeated objects at facades should not be prevented by too inaccurate SAR coordinates, but this of course, depends on the specific facade. Note that this is not the case for the inaccuracy induced by the projection from object coordinates into the image which will be treated in Section 2.3.2.

The cylindrical projection of the SAR imaging geometry can be approximated by two rotations R y (θ) and R z (t az ) around the Y and Z axes of the object coordinate system, respectively. Thus, the SAR-coordinate −−−→

P RAE of a given object point −−−→

P XY Z can be expressed as

f : −−−→

P RAE = R y (θ) · R z (t az ) · −−−→

P XY Z . (2.11)

Since R y (θ) and R z (t az ) are rotation matrices, they are orthogonal and the inverse operation can therefore be expressed as

g = f 1 : −−−→

P XY Z = R z (t az ) · R y (θ) · −−−→

P RAE . (2.12)

In order to derive an accuracy estimation for geocoded PS in object coordinates, the variances from (2.8) – (2.9) are propagated using the law of variance propagation applied to the transformation g:

Σ XYZ =

 

σ X 2 σ XY σ XZ

σ XY σ 2 Y σ Y Z

σ XZ σ Y Z σ Z 2

  = F Σ RAE F , (2.13)

with F being the Jacobian matrix of the coordinate transformation g:

F =

 

∂g

1

∂P

rg

∂g

1

∂P

az

∂g

1

∂P

el

∂g

2

∂P

rg

∂g

2

∂P

az

∂g

2

∂P

el

∂g

3

∂P

rg

∂g

3

∂P

az

∂g

3

∂P

el

 

 , (2.14)

(32)

symbol substitution cos (t az ) A

sin (t az ) B

cos (θ) C

sin (θ) D

Table 2.2: Substitution of trigonometric terms.

where g i denotes the ith entry of the three element vector resulting from applying g.

Substituting the trigonometric functions with the expressions of Table 2.2 makes the structure of the resulting covariance matrix Σ XYZ explicit:

Σ XYZ =

 

σ 2 X σ XY σ XZ

σ XY σ Y 2 σ Y Z

σ XZ σ Y Z σ 2 Z

  (2.15)

=

 

σ el 2 A 2 C 22 rg A 2 D 2az 2 B 2 AB σ 2 el D 2 − σ el 2 − σ rg 2 D 2az 2

ACD σ el 2 − σ rg 2 σ el 2 C 2 B 22 rg B 2 D 2az 2 A 2 − C 2 B 2 D 2 σ 2 el − σ rg 2

sym. σ 2 el D 2 − σ rg 2 D 22 rg

 

The anisotropy of the RAE-space results in correlations between the coordinate axes in the XY Z object space. Assuming σ rg 2 = σ 2 az = σ 2 el would cause the off-diagonal elements to vanish. Due to the mentioned high discrepancy between the accuracies in azimuth and range on the one side and elevation on the other side, the covariances are always taken into account throughout this thesis. Typical values for Σ XYZ lie in the lower meter domain.

As stated in Section 2.1.2, the absolute PS heights are biased by a constant offset which is a direct result of the PSI processing in which all heights are appended to a manually selected reference point. In the experiments conducted later on, this offset is corrected manually by applying the shift which minimizes the sum of distances between manually selected and projected PSs and their correspondences in oblique images over the whole investigation area.

A method to mitigate the systematic offset induced by the reference point automatically is

to merge PS point clouds originating from two SAR stacks with opposing viewing directions

and common reference points as introduced in Gernhardt [2012]. Furthermore, the influence

of the accuracy of the incidence angle θ which changes over the scene, as well as the azimuth

angle t az can be omitted since they are already considered in the PSI processing [Adam

et al., 2003] and negligible small compared to the influence of the remaining inaccuracy

induced by the elevation direction [Gernhardt, 2012].

(33)

2.3. The inaccuracy budget of persistent scatterers projected into oblique images 31

2.3.2. Projection of single PS object coordinates into oblique images

To derive an estimation for the accuracy of object coordinates of individual PSs projected into the oblique image the variance propagation procedure is continued. In this section, only single scatterers are considered, the extension to a set of PSs is given in Section 4.6.

The Jacobian of the collinearity equations (2.7) (page 25) with respect to object coordinates and projection parameters are denoted with G:

G =

" ∂x

∂P

X

∂x

∂P

Y

∂x

∂P

Z

∂x

∂c

∂x

∂x

0

∂x

∂y

0

∂x

∂X

0

∂x

∂Y

0

∂x

∂Z

0

∂x

∂ω

∂x

∂φ

∂x

∂κ

| {z }

PS-related

∂y

∂P

X

∂y

∂P

Y

∂y

∂P

Z

| {z }

image-related

∂y

∂c

∂y

∂x

0

∂y

∂y

0

∂y

∂X

0

∂y

∂Y

0

∂y

∂Z

0

∂y

∂ω

∂y

∂φ

∂y

∂κ

#

, (2.16)

where { x, y } are the image coordinates of the PS. An important fact, which will be taken into account during the derivation of the method, is the difference between two types of inaccuracy budgets. While the uncertainty in SAR and object coordinates is individual for every PS, the projection parameters and their inaccuracies are the same for all PSs. The first type of inaccuracy is denoted as PS-related, while the latter is called image-related throughout this thesis.

Analogous to the aforementioned geocoding, the covariance matrix of single PSs in two-dimensional image coordinates is derived as

Σ xy =

"

σ 2 x σ xy

σ xy σ y 2

#

= G

"

Σ XYZ 0

0 Σ Ω

#

G , (2.17)

where Σ Ω contains all the variances of the interior and exterior orientations. The variances of Ω typically are correlated depending on the specific imaging geometry. As a simplification for the presented method those parameters are assumed to be independent of each other

Parameter σ source impact

PS position range 3 cm Section 2.3 PS-related PS position azimuth 3 cm Section 2.3 PS-related PS position elevation 70 cm Section 2.3 PS-related focal length c 44 µm camera calibration image-related principle point x 0 , y 0 13 µ m camera calibration image-related camera position X 0 , Y 0 10 cm GNSS/IMU data sheet image-related camera position Z 0 20 cm GNSS/IMU data sheet image-related camera orientation ω, φ, κ 0.015 GNSS/IMU data sheet image-related

Table 2.3: A priori accuracies of parameter set.

(34)

X

Y

SAR coordinates interior orientation camera position camera angles all together

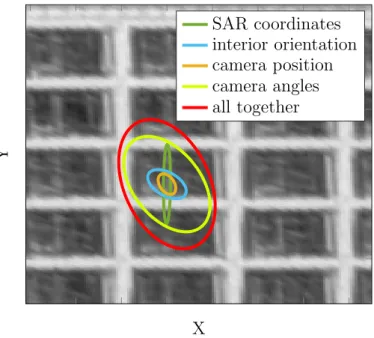
Figure 2.7: Contributions to inaccuracy budget shown as 95% confidence ellipses.

which means that only the main diagonal of Σ Ω carries entries. In order to obtain an impression of the relations with respect to the contribution of Σ XYZ and Σ Ω to the total inaccuracy budget, the variance propagation considering only a single PS is performed for different scenarios. Table 2.3 lists the employed standard deviations. The PS accuracies are derived following the considerations stated in Section 2.3. The cameras of the oblique imagery were calibrated and the resulting accuracies are known. The information for the exterior orientation can be estimated from the sensor specifications of the used GNSS and IMU. Figure 2.7 shows an example in the form of 95% confidence ellipses in the image.

Totally neglecting the inaccuracy budget of the projection into the image results in the green confidence ellipse. In this case, the covariance matrix is solely determined by the inaccuracies of SAR coordinates. The previously described anisotropy becomes clear. The direction of the long semiaxis coincides with the elevation direction of the radar sensor projected into the image which, in this case, is nearly parallel to the Y direction of the image.

The inaccuracy budget of the interior orientation (in blue) as well as the camera position (in

orange) are comparatively small with respect to the inaccuracy contribution of the camera

angles (in yellow). The latter mostly governs the overall inaccuracy budget which is shown

in red. A relation to absolute values is given by comparison with the grayvalue image in

the background. It shows a section of a regular facade. The window confining wall parts

are bright in contrast to the dark windows. Considering the overall inaccuracy budget, the

assignment to a distinct window is not reliably possible since the area of the 95% confidence

(35)

2.4. Graphs 33

ellipse is larger than one window. Nevertheless, a method to exploit topology information and model knowledge about the PS distribution in order to reduce this inaccuracy is derived in Chapter 4.

2.4. Graphs

A graph is a common and well established structure to describe and formalize relations between objects or entities of any kind. One example is the investigation of movement patterns in groups of walking persons and individual atypical behavior [Sester et al., 2012].

In such a case, important places of the investigation area are represented as nodes while the paths between them form the set of edges. Another example are network maps of public transport facilities where stations are represented as nodes and the direct connections between them are edges. In general, nodes typically represent objects while edges link nodes and correspond to their bilateral relations. In this thesis, the definition of a graph based on Neuhaus & Bunke [2007] is used and stated as follows:

Definition 2.2 (Graph). A graph G is defined by the four-tuple G = ( V , E , µ, υ), where V is the set of nodes and E the set of edges. Each edge connects two nodes. This edge is called adjacent to the nodes. Two edges adjacent to the same node are called adjacent to each other. µ is a function that labels every node with a weight and υ is a function that labels every edge with an individual weight, respectively.

The cardinality of edges is denoted with |E| and is the number of edges in the graph, while the cardinality of nodes is denoted with |V| , respectively. Figure 2.8a shows an example of a graph constituted by 7 nodes and 5 edges. The function µ assigns a label (in this example capital letters) to every node while υ attributes a weight to every edge. The minimum cover of a graph is a measure of the graphs’ structure in terms of the ratio between nodes and edges. More precisely:

Definition 2.3 (Cover). A cover of a graph G = ( V , E , µ, υ) is a set of nodes K ∈ V such that each edge e ∈ E has at least one endpoint in K . A minimum cover of G is a cover of G with the smallest number of nodes.

In Figure 2.8a, the nodes { A, C, F } form one minimum cover. The concept of a graph’s

cover is essential for the derivation of the bipartite matching in Section 2.5.

Abbildung

Figure 1.1: Example for the appearance of facades in optical and SAR data.
Figure 1.3: Flowchart of the presented method. The sections in brackets contain detailed information about the respective steps.
Figure 2.1: Sketch of imaging geometry of a SAR acquisition. The SAR image, depicted as orange area, is formed by coherently integrating the signal from t i − 1 to t i+1 .
Figure 2.2: Sketch of signal mixing due to layover in one resolution cell of a SAR acquisition.
+7

Referenzen

ÄHNLICHE DOKUMENTE

can note that the greater majority of the SMEs are active on a local or on a regio- nal market. This leads us towards a very fundamental point: the SME-population i so

Eine musealisierte Medieninstallation ist aufgrund ihrer historischen Bedeutung oder ihrer kultu- rell-gesellschaftlichen Werte (also ihrer Repräsentativität, Typizität

Shi Yinhong, director of the Center for American Studies at Renmin University, warns in the Financial Times: “When Hu Jintao took over [in 2002] China didn’t need to look to Russia

Having announced the future size of the military presence in Afghanistan two days prior, the president’s re- marks were a symbolic bookend to US engage- ment in the

Player positioning view giving detailed information about a specific player (top shows free kicks and bottom depicts corners).. the arising clusters are grouped by the number and

Heavy precipitation and fl oodwater warnings can be created with radar observations and information from weather models.. This is how, for example, short-term warnings for

termining the most probable feature class for each true positive extracted line (combined for both urban and rural areas) when compared to the reference

When planning the treat- ment allocated to lemmata in e-dictionaries lexicographers should consider the possibility of layering search zones in such a way that the user can