Measurement of the central exclusive production of charged particle pairs in proton-proton collisions at
√s = 200 GeV with the STAR detector at RHIC
The STAR Collaboration STAR
E-mail: leszek.adamczyk@agh.edu.pl
Abstract:We report on the measurement of the Central Exclusive Production of charged particle pairs h+h− (h = π, K, p) with the STAR detector at RHIC in proton-proton collisions at √
s = 200 GeV. The charged particle pairs produced in the reaction pp → p0+h+h−+p0 are reconstructed from the tracks in the central detector and identified using the specific energy loss and the time of flight method, while the forward-scattered protons are measured in the Roman Pot system. Exclusivity of the event is guaranteed by requiring the transverse momentum balance of all four final-state particles. Differential cross sections are measured as functions of observables related to the central hadronic final state and to the forward-scattered protons. They are measured in a fiducial region corresponding to the acceptance of the STAR detector and determined by the central particles’ transverse momenta and pseudorapidities as well as by the forward-scattered protons’ momenta. This fiducial region roughly corresponds to the square of the four-momentum transfers at the pro- ton vertices in the range0.04GeV2 <−t1,−t2<0.2GeV2, invariant masses of the charged particle pairs up to a few GeV and pseudorapidities of the centrally-produced hadrons in the range |η|< 0.7. The measured cross sections are compared to phenomenological pre- dictions based on the Double Pomeron Exchange (DPE) model. Structures observed in the mass spectra ofπ+π− andK+K−pairs are consistent with the DPE model, while angular distributions of pions suggest a dominant spin-0 contribution to π+π− production. For π+π− production, the fiducial cross section is extrapolated to the Lorentz-invariant region, which allows decomposition of the invariant mass spectrum into continuum and resonant contributions. The extrapolated cross section is well described by the continuum produc- tion and at least three resonances, thef0(980),f2(1270)andf0(1500), with a possible small contribution from thef0(1370). Fits to the extrapolated differential cross section as a func- tion oft1 andt2 enable extraction of the exponential slope parameters in several bins of the invariant mass ofπ+π− pairs. These parameters are sensitive to the size of the interaction region.
Keywords: Diffraction, Forward physics, Hadron-Hadron scattering (experiments)
arXiv:2004.11078v2 [hep-ex] 28 Jul 2020
Contents
1 Introduction 1
2 Theoretical framework and current experimental situation 2
3 Experimental setup 4
4 Event reconstruction 6
5 Monte Carlo simulation 7
6 Data sample and event selection 8
7 Kinematic variables and fiducial region 13
8 Background estimation 14
9 Corrections 14
10 Systematic uncertainties 17
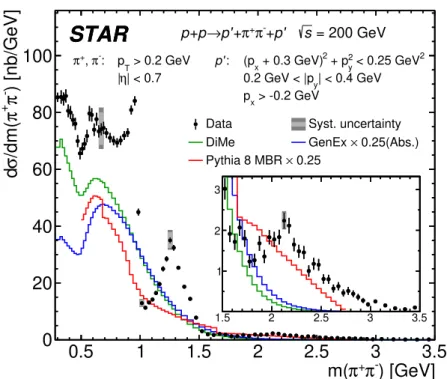
11 Results 20
11.1 Cross sections in fiducial region 20
11.2 Extrapolated π+π− differential cross sectionsdσ/dmand d2σ/dt1dt2 30
12 Summary 36
The STAR Collaboration 42
1 Introduction
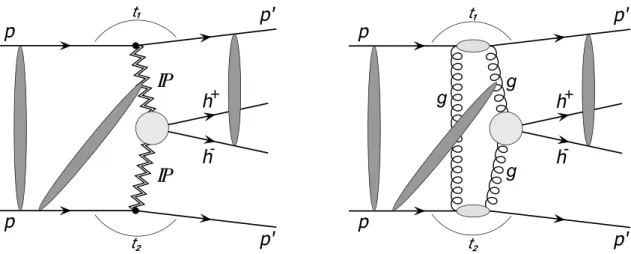
The study of exclusive production of meson and baryon pairs has long been recognised as an important ground for Quantum Chromodynamics (QCD) tests. Exclusive produc- tion of pion and kaon pairs has been studied both theoretically [1–3] and experimentally, in two-photon collisions at lepton colliders [4–7] and via photoproduction [8–11] and deep inelastic scattering [12,13] in lepton-proton and heavy-ion experiments. Exclusive produc- tion of meson and baryon pairs belongs to the class of Central Exclusive Production (CEP) processes. In hadron-hadron collisions, CEP processes can proceed via Double Pomeron Ex- change (DPE), photon-Pomeron exchange or photon-photon exchange, where the Pomeron is a colour-singlet object with internal quantum numbers of the vacuum, see, e.g., [14,15].
Although several properties of diffractive scattering at high energies are described by the
phenomenology of Pomeron exchange in the context of Regge theory [16], the exact nature of the Pomeron still remains elusive.
This paper presents a measurement of CEP of π+π−,K+K− and p¯p pairs inpp colli- sions at a centre-of-mass energy of√
s= 200GeV with the STAR detector at RHIC. Differ- ential and integrated cross sections are measured in a fiducial region and compared to phe- nomenological predictions. The fiducial region roughly corresponds to the square of the four- momentum transfers at the proton vertices in the range0.04GeV2 <−t1,−t2 <0.2GeV2 and invariant masses of the charged particle pairs up to a few GeV. Throughout the paper the conventionc=~= 1 is used.
2 Theoretical framework and current experimental situation
Over the last decade, one could observe a renewal of interest in studies of CEP processes in high energy proton-(anti)proton collisions (see, e.g., [17–19] for review and further refer- ences). CEP processes in hadron-hadron collisions provide an especially clean environment to study the nature and quantum numbers (spin, parity) of centrally-produced resonance states [18]. In proton-proton collisions, the CEP reaction may be written in the form
pp→p0⊕X⊕p0, (2.1)
where the ⊕ symbols denote the presence of large rapidity gaps which separate the final state systemXfrom the diffractively-scattered protons. This process in the DPE mode and with the hadronic final state, X, consisting of just an oppositely-charged particle pair is schematically shown in Fig. 1(left). In Fig.1(right), its representation within perturbative QCD (pQCD) is shown in the two-gluon approximation. The scattered protons emerge in- tact from the collision at small polar angles with respect to the incoming beams and can be detected with special tagging devices. The final state, X, can be fully measured at central rapidities. The upper limit of the invariant mass, MX, of the system X depends on the energy of the colliding particles. At the LHC, this upper limit can reach above 100 GeV and the central production of even the Higgs or supersymmetric particles might be possible [20].
Recently, CEP of pion pairs in pp collisions at√
s= 5.02,7 and 13 TeV has been reported by the CMS experiment [21,22]. The LHCb experiment has measured photo-induced CEP ofJ/ψandψ(2S)states inppcollisions at√
s= 13TeV [23] andΥ(nS) (n= 1,2,3)states inpp collisions at√
s= 7and 8 TeV [24]. At the Tevatron, it was possible to study CEP of π+π− pairs with invariant masses up to a few GeV inpp¯collisions at several centre-of-mass energies up to √
s= 1.96 TeV [17,25]. The above measurements were performed without forward-proton tagging. The experiments at CERN at the ISR [26] and the SPS [27] have provided measurements of many CEP processes with forward proton tagging, however at significantly smaller centre-of-mass energies (62 GeV for ISR and 30 GeV for SPS).
In the present analysis,X stands for either continuum or resonant production ofπ+π−, K+K−or pp¯pairs in the non-perturbative regime up to aroundMX = 3GeV. At the rela- tively high centre-of-mass energy of√
s= 200GeV, only small contributions from Reggeon exchange are expected. Contributions from photon-Pomeron and photon-photon processes are also not significant and are additionally suppressed at −t > 0.04 GeV2. Therefore,
IP
IP
Figure 1. (left) Generic diagram of CEP of h+h− in DPE model. The scattered beam protons emerge intact from the collision and the charged particle pair is produced in the central rapidity region. (right) The two-gluon approximation of DPE in pQCD. The grey ovals represent some of the possible absorptive corrections.
the DPE process is expected to be dominant. The DPE process can be regarded as a spin and parity filter, i.e., the h+h− system must have even spin and positive parity, so only exclusive production of f0 and f2 resonances are allowed on top of the continuum in the studied h+h− production. In general, the resonance and continuum contributions may interfere. Calculations of the hadron mass spectrum in this domain were first done for only the continuum production [18,28,29] ofπ+π− orK+K− pairs using an approach based on Regge theory. In these models, the parameters of the Pomeron and sub-leading Reggeon exchanges were adjusted to describe the total and elastic πp or Kp scatterings.
In this approach, the amplitude for the p+p → p0 +ππ(KK) +p0 process is expressed in terms of the product of two amplitudes describing the interaction of each of the two protons with one of the two mesons. The intermediate meson form factor is parameterised with one of three functions: an exponential, exph
(ˆt−m2h)/Λ2offi
, an Orear-like function, exph
−b(√
−ˆt+m2h+a2−a)i
, or a power-like function,1/(1−(ˆt−m2h)/a0), whereˆtis the square of the four momentum transfer at the Pomeron-meson vertex and Λ2off,b,aanda0 are free parameters. The models can be supplemented to include absorption effects (shown symbolically on Fig.1) which are needed to calculate the ‘survival probability’ for no addi- tional soft re-scatterings between the colliding protons or the final state mesons. Absorption corrections are related to the non-perturbative interaction in the initial or final state of the reaction. The re-scattering leads to suppression of the cross section and distortion of the distributions of the kinematic variables. The suppression factor depends on the collision energy. They usually reduce the cross sections, even by a factor of 5 at RHIC energy and a factor of 10 at LHC energies [30]. Recently, the production of a variety of resonances: the f0(500),f0(980)andf2(1270)decaying toπ+π−, thef0(980),f0(1500),f0(1710),f2(1270) and f20(1525) decaying to K+K−, and the f0(2020), f0(2100) and f0(2200) decaying to pp, were studied theoretically [31–33] including interference effects between resonant and¯
non-resonant amplitudes. The calculations are based on a tensor Pomeron model. The amplitudes for the processes are formulated in terms of vertices, respecting the standard crossing and charge-conjugation relations of Quantum Field Theory. In recent work [34], the authors also consider resonant CEP ofπ+π−through Pomeron-Pomeron fusion ignoring the spin effects in the Pomeron-Pomeron-resonance vertices.
At relatively large MX (> 2 GeV), perturbative QCD (pQCD) calculations can be performed [18]. In Fig.1(right), the relevant diagram is shown, where the hard sub-process gg → X is initiated by gluon-gluon fusion and the second gluon is needed to screen the colour flow across the rapidity gap intervals. The cross section is calculated based on the generalised (skewed) unintegrated gluon densities of the protons [35]. The skewed uninte- grated density can be obtained from the conventional integrated gluon densities [36]. The hard scale needed for pQCD calculations should be larger thanΛQCDand is typically given by the mass of the produced state [18]. The pQCD predictions include the contribution fromπ+π−(K+K−) produced both directly and from χc0 decay.
One important motivation for measuring DPE processes is to search for gluonic bound states, called glueballs, which are predicted by QCD due to its non-Abelian nature. The properties of these compound objects offer a unique insight into the strong interaction, since the gluon self-interaction is exclusively responsible for the mass of glueballs. The search for these exotic states, and determining their possible role within the family of mesons, is a long-standing quest in hadron spectroscopy [37]. Glueballs are preferentially produced in gluon-rich processes such as pp¯ annihilation [38, 39], the radiative decay of the J/ψ- meson [40], and CEP processes [17, 18, 26, 41] in pp(¯p). The absence of valence quarks in the production process makes CEP a favorable place to look for hadronic production of glueballs. Lattice QCD calculations have predicted [37] the lowest-lying scalar glueball state in the mass range of1000−1700MeV, and tensor and pseudo-scalar glueballs in the range of2000−2500MeV. Experimentally measured candidates for scalar glueball states are thef0(1500)and thef0(1710) observed in central production as well as in other gluon-rich reactions. The glueballs are expected to be unstable and decay in diverse ways, yielding typically two or more mesons. The f0(1710) state decays into KK¯ and the f0(1500) into ππ and 4π. For the tensor meson sector,IGJPC = 0+2++, neither the establishedf2(1950) nor less well-established states, such as the f2(1910) and f2(2150), have been thoroughly explored. This is partly due to a small production cross section and partly due to not being able to clearly separate the Reggeon contribution.
3 Experimental setup
The data used in this analysis were collected by the STAR experiment at RHIC [42] in 2015 in proton-proton collisions at√
s= 200GeV and correspond to an integrated luminosity of 14.2 pb−1. A detailed description of the STAR detector is given in Ref. [43].
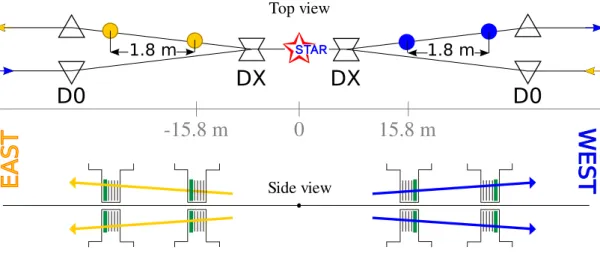
The forward-scattered protons are measured in the Roman Pot (RP) system adopted from the pp2pp experiment [44] at RHIC. This is schematically shown in Fig.2(top), where the locations of the RPs are displayed together with the beam line elements. Silicon strip detectors are located in two stations on each side of the interaction point (IP) at distances
1.8 m 1.8 m
0
-15.8 m 15.8 m
D0 DX DX
D0
STAR
Top view
Side view
EAST WEST
Figure 2. (top) The layout of the beam-line elements outside of the STAR main detector (not to scale). Two sets of RPs are installed between the DX and D0 dipole magnets, at 15.8 m and 17.6 m on each side of the nominal IP, respectively. (bottom) Each station consists of two RPs, one above and one below the beam-line, housing four planes of silicon strip detectors and a scintillation counter.
of 15.8 m and 17.6 m, respectively. Each station has two RPs, one placed above and one below the beam-line, see Fig. 2 (bottom). The RPs are situated downstream of the DX dipole magnets responsible for head-on targeting of the incoming beams and for bending outgoing beams back into the respective accelerator pipelines. The constant and uniform magnetic field of the DX magnet works as a spectrometer, and thus knowledge of the scat- tered proton’s trajectory allows reconstruction of its momentum. Each RP houses a package of 4 silicon strip detector planes - two with vertical and two with horizontal orientation of the strips - allowing measurement of the position of a proton in the transverse plane. The strip pitch is about 100 µm, resulting in a spatial resolution of about 30 µm. Scintillator counters placed inside each RP station allow for triggering on forward protons and also provide timing information with 0.5 ns resolution.
Measurement of a pair of charged particles produced in the final state at central rapid- ity is performed using the Time Projection Chamber (TPC) [45], which provides tracking for charged particles in the 0.5 Tesla solenoidal magnetic field. The TPC covers the pseu- dorapidity range of |η| <1.8 in full azimuthal angle.1 The TPC is used to determine the momenta of the charged particles, and also helps in locating the position of the collision vertex. The tracking efficiency is ∼ 85% for |η| < 1, but falls to 50% at |η| ∼ 1.3. The measurement of the specific energy loss in the TPC gas, dE/dx, is used for particle iden- tification. Furthermore, to extend the particle identification power of the STAR detector performed by the TPC, a Time-Of-Flight (TOF) detector [46] is placed around the TPC covering a pseudorapidity range of |η| < 0.9. The TOF detector is a system of adjacent
1STAR uses a right-handed coordinate system with its origin at the nominal IP in the centre of the detector and the z-axis along the beam pipe. Thex-axis points from the IP to the outside of the RHIC ring, and they-axis points upward. Cylindrical coordinates(r,ϕ)are used in the transverse plane,ϕbeing the azimuthal angle around the beam pipe. The pseudorapidity is defined in terms of the polar angleθ as η=−ln [tan (θ/2)]. Transverse momentum is defined aspT=psinθ.
Multi-gap Resistive Plate Chambers. In addition to being a precise timing detector, it is used to measure event multiplicity at the trigger level and to discriminate TPC tracks ar- rived in preceding/posterior bunch crossings (out-of-time pile-up) from the in-time tracks.
Using the TOF timing information together with the momentum and path length recon- structed in the TPC allows for the particle mass determination.
For the TOF efficiency study, an unbiased sample with tracks reconstructed using Heavy Flavor Tracker (HFT) [47] hits in addition to TPC hits was analysed. This sample provides a clean source of in-time tracks. The HFT is a system of multi-layer silicon pixel and strip detectors. It improves the impact parameter resolution of the STAR tracking system and enables reconstruction of secondary decay vertices of open heavy flavour hadrons.
To suppress non-exclusive background, the Beam-Beam Counters (BBCs) [48] and the Zero-Degree Calorimeters (ZDCs) [49] are used. The BBCs are scintillator detectors placed in the endcap regions of the STAR detector and covering pseudorapidity ranges of 2.1<|η|<3.3 (large BBC tiles) and 3.3<|η|<5 (small BBC tiles). The ZDCs are used to tag neutral particles which leave the interaction region close to the beam direction.
4 Event reconstruction
In order to reconstruct the position and momentum of the scattered protons, a clustering procedure is applied for each RP detector plane separately. A cluster is formed by a continuous series of Si strips with signals well above the pedestal. Pairs of matched clusters found in detector planes measuring the same coordinate define the(x, y)coordinates of space points for a given RP. Correlating space points between RP stations, and reconstructing the proton kinematics, relies on an alignment procedure, which is carried out using elastic scattering data for each run separately, as described in Ref. [50]. A track is formed based on one or two points reconstructed in the two RP detector stations on the same side of the IP.
Using elastic scattering events reconstructed with tracks formed from the two points, the average transverse position of the primary vertex was measured to behxIPi= 0.42±0.04mm and hyIPi= 0.46±0.05 mm. With the average transverse position of the vertex and two- point proton tracks, the proton transverse momentum (px, py) can be reconstructed, and hence the value of the Mandelstam variablet. For single point proton tracks, the transverse momentum is reconstructed assuming that the scattered proton energy is equal to the beam energy. Such an approximation is justified because the proton loses on average less than 1% of its initial energy for events with MX <2 GeV.
Particle pair identification is performed using the combined information from the TPC and TOF detectors for both tracks simultaneously. The compatibility of the track’sdE/dx with that expected for a given particle (h=π,K,p) is determined using the quantity
nσh= ln [(dE/dx)/(dE/dx)h]
σ , (4.1)
where (dE/dx)h is the Bichsel [51] expectation for particle type h and σ is the relative resolution ofdE/dxfor a given track. Fromnσh for each of the two tracks, theχ2 statistic
for ahh pair hypothesis is calculated:
χ2dE/dx(hh) = (nσh,1)2+ (nσh,2)2. (4.2)
The time at which a particle is detected in the TOF system is used to reconstruct its squared mass m2TOF. For this purpose, the time of the primary interaction is required;
however, it is not known for CEP events. Instead, the unknown time of the primary interaction can be eliminated by assuming that both tracks present in an event are of the same type. In that case, the measured TOF time difference between particles is given by
∆t=L1
p1 +m2TOF/p21−L2
p1 +m2TOF/p22, where p1,2 are tracks’ momenta and L1,2 are the lengths of the helical paths between the primary vertex and TOF hit associated with them. m2TOF can be then calculated per event. If m2TOF is negative, due to the detector’s resolution, then it is set to zero.
5 Monte Carlo simulation
Monte Carlo (MC) simulations are used for the modelling of background contributions, unfolding of detector effects, calculation of systematic uncertainties and comparisons of models with the hadron-level cross section measurements.
The GenEx [52] and DiMe [19] event generators are based on simple phenomenological models [18,28,29] of continuum production ofπ+π− or K+K− pairs.
In the DiMe event generator, four models for absorption are available. The predic- tion from "model 1", which is most consistent with data, is used in this analysis. DiMe predictions are also sensitive to the choice of meson form factor. Three different param- eterisations of meson form factor are implemented. We chose an exponential form using Λ2off = 1.0 GeV2, which fits the present data better. A larger value of Λ2off was used [18]
to fit DiMe predictions to ISR data, however the 50% normalisation uncertainty of the ISR data does not excludeΛ2off = 1.0GeV2.
In GenEx, the absorption corrections are not taken into account. However, the model developers estimated the suppression factor to be of the order of 2−5 (π+π−) and 2 (K+K−) [30]. To account for absorption, the π+π− cross sections obtained from GenEx are scaled by 0.25 to fit DiMe predictions for masses above 0.8 GeV, while theK+K−cross sections from GenEx are scaled by 0.45 to fit DiMe predictions for masses above 1.2 GeV.
Above these limits, the absorption effects only weakly depend on pair mass. In the GenEx generator, we also use an exponential form for the meson form factor usingΛ2off = 1.0GeV2. Therefore the differences between GenEx and DiMe are almost entirely due to the absorp- tion effects.
The MBR model [53] implemented in PYTHIA8 [54] was tuned to describe the in- clusive cross section for central diffraction (CD), p+p → p0 +X+p0, measured by the CDF experiment. In this model, the exclusive h+h− final state occurs from fragmentation and hadronisation of the central state based on the Lund string model. The MBR model implemented in PYTHIA8.244 allows generation of the central state starting from the mass threshold of0.5GeV, however the suggested value is 1.2 GeV. Therefore, PYTHIA8 expec- tations for very low masses are in question, but are shown for completeness. The obtained
cross sections from PYTHIA8 are scaled by an arbitrary value of 0.25 for easier comparison with the data.
Single particle MC embedded into zero-bias data events were used to calculate the TPC and TOF reconstruction and matching efficiencies separately for: π+, π−, K+, K−, p and
¯
p. The GenEx sample of p+p → p0 +π+π−+p0 embedded into zero-bias data events was used to calculate the RP reconstruction efficiency for forward-scattered protons and also for closure tests of the full analysis chain. The inclusive CD and Minimum Bias (in- elastic) PYTHIA8 samples without embedding were used for calculation of the impact of systematic uncertainties in the subtraction of non-exclusive background, as well as for the comparisons with the data. Prior to the embedding, MC samples were passed through a detailed GEANT3 [55] simulation of the STAR central detector and the GEANT4 [56]
simulation of the beam optics and RP detectors. All MC samples were then subjected to the same reconstruction and analysis software as applied to the data.
A fast and simplified MC simulation was used for estimation of the central pair parti- cle identification (PID) efficiency and misidentification probability. In this simulation, the dE/dxand the times of detection of particles in the TOF detector were generated according to parameterisations obtained from the inclusive data and the full TPC/TOF simulations, while the amount of exclusive π+π−,K+K− and pp¯were chosen to describe the data.
6 Data sample and event selection
The CEP events were triggered by requiring signals in at least one RP station on each side of the IP, and at least 2 hits in the TOF to ensure the presence of at least two in-time tracks in the TPC. In addition, a lack of activity in both the small BBC tiles and the ZDC detectors is required to ensure the double gap in pseudorapidity topology characteristic of CEP events. In order to reduce pile-up events, or events involving proton dissociation, a veto is imposed on events containing signals in both upper and lower RP stations on the same side of the IP. 560 million CEP event candidates were triggered in total, corresponding to 14.2 pb−1 of integrated luminosity. An average trigger prescale of 5 was used during the entire data-taking period due to limited data acquisition bandwidth.
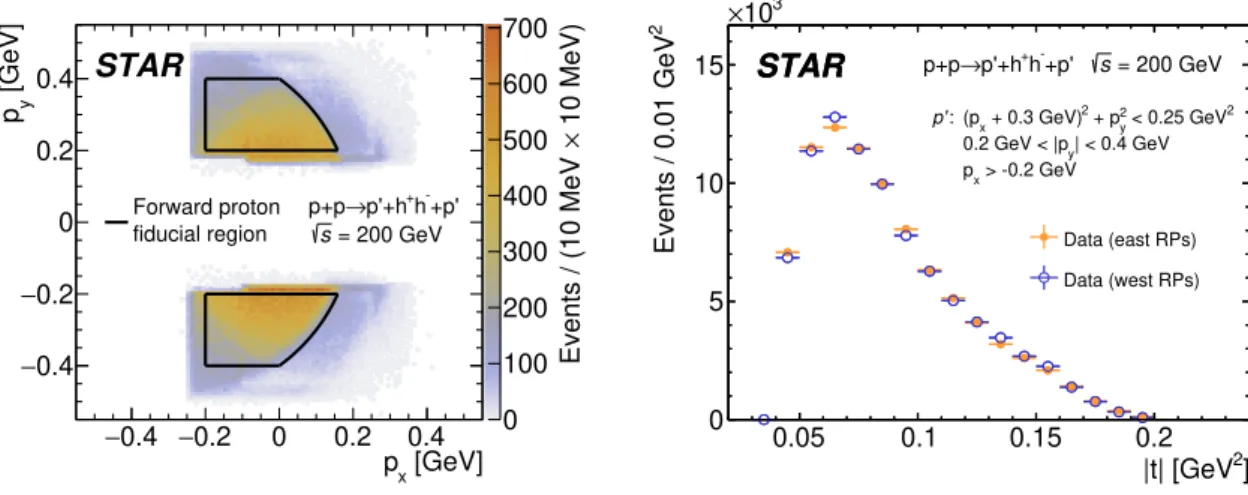
In the offline analysis, the protons tagged in the RPs are further required to have transverse momenta (px,py) in the fiducial region defined as
(px+ 0.3GeV)2+p2y <0.25GeV2 & 0.2GeV<|py|<0.4GeV & px >−0.2GeV.
(6.1) This fiducial region is chosen to achieve high geometrical acceptance and track reconstruc- tion efficiency and also to minimise systematic uncertainties. Figure 3 (left) shows the combined distributions of the momenta,py vs. px, of the diffractively scattered protons in exclusive h+h− events reconstructed with the East and West RP stations. The kinematic region used in the measurement, defined in Eq. (6.1), is enclosed with the black line. Fig- ure 3 (right) shows the distributions of measured four-momentum transfers at the proton vertices separately for the East and West stations.
In this analysis, the CEP events must consist of only one pair of oppositely charged
0.4
− −0.2 0 0.2 0.4 [GeV]
px
0.4
− 0.2
− 0 0.2 [GeV]p y0.4
0 100 200 300 400 500 600 700
10 MeV)×Events / (10 MeV
STAR
-+p'
+h p'+h p+p→
= 200 GeV fiducial region s
Forward proton
0.05 0.1 0.15 0.2
2]
|t| [GeV 0
5 10 15
103
2 Events / 0.01 GeV × Data (east RPs)
Data (west RPs) = 200 GeV +p' s
h-
p'+h+
p+p→
STAR STAR
p':
2 < 0.25 GeV2
+ py
+ 0.3 GeV)2
(px
| < 0.4 GeV 0.2 GeV < |py
> -0.2 GeV px
Figure 3. (left) Combined distributions of diffractively-scattered protons’ momenta py vs. px
reconstructed with the East and West RP stations. The kinematic region used in the measurement is enclosed with the black line. (right) Distributions of measured four-momentum transfers at the proton vertices are shown for the East and West stations with yellow and blue colours, respectively.
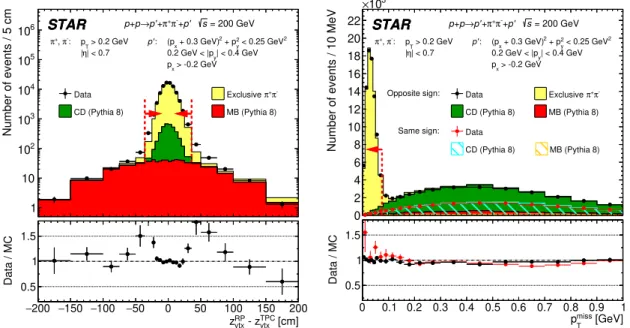
mid-rapidity particles, besides the two forward-scattered protons. Therefore, only events with exactly two opposite-sign TPC tracks, each matched with hits in the TOF and orig- inating from a common vertex, are selected. These tracks have at least 25 hits (out of a possible 45). All tracks are required to be within the fiducial region defined byptrackT >0.2 GeV and |ηtrack|<0.7. The z-position of the event vertex obtained from the TPC tracks is limited to |zvtx| < 80 cm. The above limits on ηtrack and zvtx were chosen to ensure high geometrical acceptance in the entire fiducial phase space. In addition, it is required that the z-position of the vertex obtained from the time difference of the signals from the forward protons in the RPs agrees with the TPC vertex within 36 cm, corresponding to three-and-a-half standard deviations. To further suppress the residual backgrounds, a veto is imposed on signals in the large BBC tiles (2.1 < |η| < 3.3), as well as on events with more than one additional TOF hit not matching either of the two TPC tracks. This mainly removes higher-multiplicity events where some particles are either not reconstructed in the TPC or produced outside the TPC acceptance.
PID involves a few steps. First, the p¯p hypothesis is checked:
χ2dE/dx(pp)¯ <9 & χ2dE/dx(π+π−)>9 & χ2dE/dx(K+K−)>9 & m2TOF >0.6GeV2. (6.2) If the conditions (6.2) are satisfied, the pair is assumed to bepp. If not, the pair is checked¯ for compatibility with theK+K− hypothesis:
χ2dE/dx(K+K−)<9 & χ2dE/dx(π+π−)>9 & χ2dE/dx(pp)¯ >9 & m2TOF >0.15GeV2. (6.3) If the pair is not compatible with either thepp¯or theK+K− hypothesis, it is assumed to be a π+π− pair if
χ2dE/dx(π+π−)<12. (6.4)
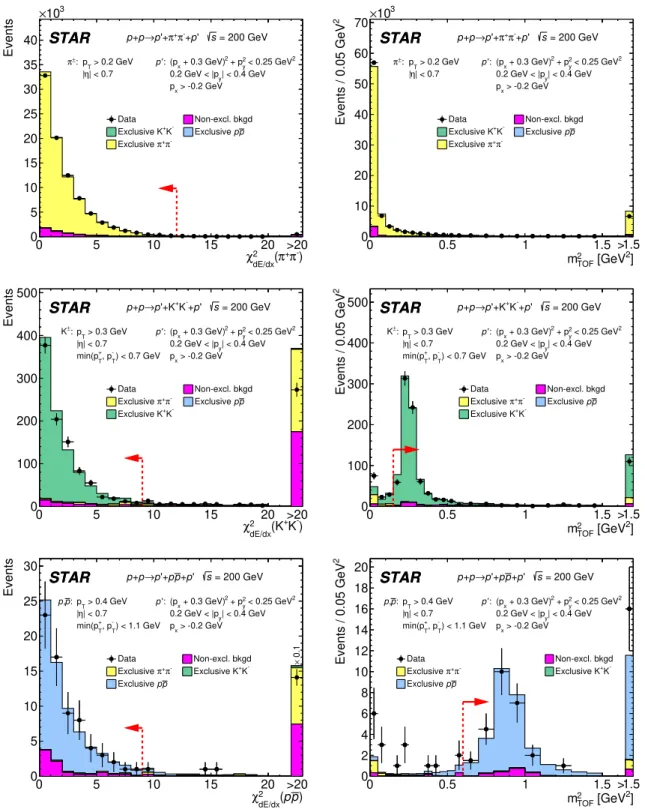
For pairs identified as kaons or protons, a more restrictive cut on each track’s pT is imposed: pT >0.3GeV forK± and pT >0.4GeV forp(¯p). In addition, it is required that the lower-pT track in the pair has pT < 0.7 GeV (K+K−) or pT < 1.1 GeV (pp). These¯ additional cuts are intended to constrain the fiducial range of high track reconstruction efficiency (lower cut) and high pair identification efficiency (upper cut). The criteria used for PID given by Eqs. (6.2), (6.3) and (6.4), and themin(p+T, p−T) cut discussed above, were chosen to suppress exclusive background below 1% for π+π− and p¯p and below 3% for K+K−. The distributions ofχ2dE/dxand m2TOF for all studied particle species are shown in Fig.4, together with the fast MC predictions. Theχ2dE/dxdistributions are shown after the correspondingm2TOF cut listed in Eq. (6.2) and Eq. (6.3). Similarly, them2TOF distributions are shown after the correspondingχ2dE/dxcut.
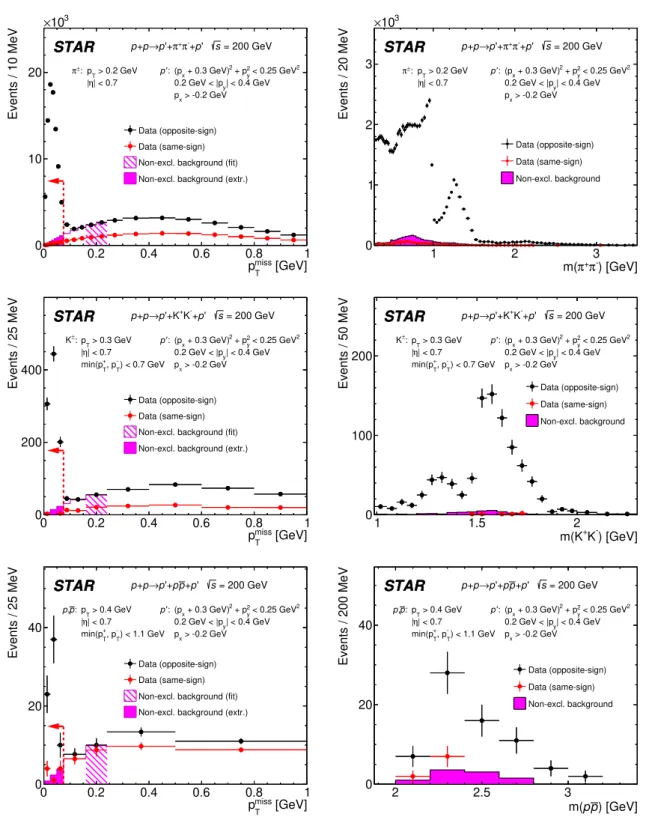
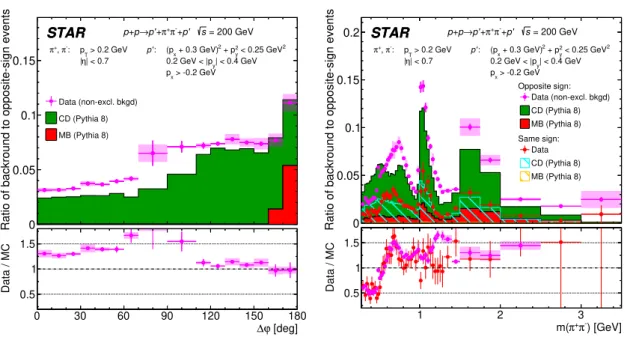
Finally, the missing transverse momentum in the event,pmissT , obtained from the trans- verse momenta of the protons tagged in the RPs and the tracks of the centrally produced pair, is required to be less than 75 MeV to suppress the non-exclusive background. Fig- ure5(left column) shows thepmissT distributions for all studied particle species together with the pmissT distributions for like-sign control sample. After all the above selection cuts, the approximate numbers of CEP event candidates are 85600 for π+π− pairs, 930 for K+K− pairs and 70 forpp¯pairs in the final state.
Uncorrected invariant mass distributions of theπ+π−,K+K− and p¯p pairs after the final selection cuts are shown in Fig. 5(right column). The same-sign control sample is also shown, obtained with exactly the same event selection cuts as the nominal sample except for the requirement that the two centrally produced tracks should have opposite electric charges. Instead it is required that the charges of the tracks are the same. The same-sign control sample is at the level of a few percent of the final sample.
0 5 10 15 20
-)
+π (π
dE/dx
χ2
0 5 10 15 20 25 30 35 40
103
×
Events
Data Non-excl. bkgd
K-
Exclusive K+ Exclusive pp π-
π+
Exclusive
>20 = 200 GeV ' s
+p π-
π+
'+
→p +p
STAR p
STAR
:
π± > 0.2 GeV p': pT
| < 0.7
|η
< 0.25 GeV2 2
+ py
+ 0.3 GeV)2
(px
| < 0.4 GeV 0.2 GeV < |py
> -0.2 GeV px
0 0.5 1 1.5
2] [GeV
TOF
m2
0 10 20 30 40 50 60 70
103
2 Events / 0.05 GeV × Data Non-excl. bkgd
K-
Exclusive K+ Exclusive pp π-
π+
Exclusive
1.5
>
= 200 GeV ' s
+p π-
π+
'+
→p +p
STAR p
STAR
:
π± > 0.2 GeV p': pT
| < 0.7
|η
< 0.25 GeV2 2
+ py
+ 0.3 GeV)2
(px
| < 0.4 GeV 0.2 GeV < |py
> -0.2 GeV px
0 5 10 15 20
-)
+K
dE/dx(K χ2
0 100 200 300 400 500
Events
Data Non-excl. bkgd
π-
π+
Exclusive Exclusive pp K-
Exclusive K+
>20 = 200 GeV ' s
+p K-
'+K+
→p +p
STAR p
STAR
±:
K p':
| < 0.7
|η > 0.3 GeV pT
) < 0.7 GeV
-
, pT +
min(pT
< 0.25 GeV2 2
+ py
+ 0.3 GeV)2
(px
| < 0.4 GeV 0.2 GeV < |py
> -0.2 GeV px
0 0.5 1 1.5
2] [GeV
TOF
m2
0 100 200 300 400 500
2 Events / 0.05 GeV Data Non-excl. bkgd
π-
π+
Exclusive Exclusive pp K-
Exclusive K+
1.5
>
= 200 GeV ' s
+p K-
'+K+
→p +p
STAR p
STAR
±:
K p':
| < 0.7
|η > 0.3 GeV pT
) < 0.7 GeV
-
, pT +
min(pT
< 0.25 GeV2 2
+ py
+ 0.3 GeV)2
(px
| < 0.4 GeV 0.2 GeV < |py
> -0.2 GeV px
0 5 10 15 20
) p p
dE/dx( χ2
0 5 10 15 20 25 30
Events
Data Non-excl. bkgd
π-
π+
Exclusive Exclusive K+K- p
Exclusive p
>20 = 200 GeV ' s
+p p '+p
→p +p
STAR p
STAR
: p ,
p p':
| < 0.7
|η > 0.4 GeV pT
) < 1.1 GeV
-
, pT +
min(pT
< 0.25 GeV2 2
+ py
+ 0.3 GeV)2
(px
| < 0.4 GeV 0.2 GeV < |py
> -0.2 GeV px
0.1×
0 0.5 1 1.5
2] [GeV
TOF
m2
0 2 4 6 8 10 12 14 16 18
2 Events / 0.05 GeV 20 Data Non-excl. bkgd
π-
π+
Exclusive Exclusive K+K-
p Exclusive p
1.5
>
= 200 GeV ' s
+p p '+p p p→ +
STAR p
STAR
: p ,
p p':
| < 0.7
|η > 0.4 GeV pT
) < 1.1 GeV
-
, pT +
min(pT
< 0.25 GeV2 2
+ py
+ 0.3 GeV)2
(px
| < 0.4 GeV 0.2 GeV < |py
> -0.2 GeV px
Figure 4. Distributions ofχ2dE/dx(left column) andm2TOF(right column) for exclusiveπ+π− (top), K+K− (middle) and p¯p (bottom) candidates after final event selection. The dashed red line and arrow indicate the value of the cut imposed on the plotted quantity to select exclusive pairs of a given particle species. Yellow, blue and green histograms correspond to the fast exclusive MC simulation while magenta shows the estimated amount of non-exclusive background in the data.