Essays on Systemic Risk and Bank Profitability
Inauguraldissertation zur
Erlangung des Doktorgrades der
Wirtschafts- und Sozialwissenschaftlichen Fakult¨ at der
Universit¨ at zu K¨ oln
2016
vorgelegt von
Dipl.-Kfm. Benjamin Georg D¨ oring aus
K¨ oln
Referent: Univ.-Prof. Dr. Thomas Hartmann-Wendels, Universit¨at zu K¨oln Korreferent: Univ.-Prof. Dr. Heinrich R. Schradin, Universit¨at zu K¨oln Vorsitz: Univ.-Prof. Dr. Dieter Hess, Universit¨at zu K¨oln
Tag der Promotion: 11. Januar 2017
F¨ ur meine Familie
Danksagung
Eine wissenschaftliche Arbeit ist nie das Werk einer einzelnen Person. Daher m¨ochte ich an dieser Stelle all den Personen meinen Dank entgegenbringen, deren Mithilfe maßgeblich zum Erfolg der vorliegenden Promotionsschrift beigetragen hat:
Mein besonderer Dank gilt zun¨achst Herrn Prof. Dr. Hartmann-Wendels, meinem Doktorvater, f¨ ur die wertvolle Unterst¨ utzung und bereichernden Diskussionen w¨ahrend der gesamten Erstellung dieser Arbeit. Auch m¨ochte ich mich bei ihm f¨ ur die M¨oglichkeit bedanken, dass ich meine Forschungsergebnisse auf verschiedenen internationalen Fachkon- ferenzen pr¨asentieren konnte. Mein Dank gilt des weiteren Herrn Prof. Dr. Schradin f¨ ur die T¨atigkeit als Zweitgutachter und Herrn Prof. Dr. Hess f¨ ur die ¨ Ubernahme des Vor- sitzes des Disputationsgremiums.
Ohne das Mitwirken von Dr. Claudio Wewel, meinem Diplomarbeitsbetreuer, Koautor und guten Freund, der mich als erster mit der Thematik meiner Promotionsarbeit vertraut gemacht hat und w¨ahrend der gesamten Zeit mit wertvollem Rat zur Seite stand, w¨are diese Arbeit in ihrer jetzigen Form nicht m¨oglich gewesen. Auch m¨ochte ich an dieser Stelle Kerstin Reichmann anf¨ uhren. Sie war beim Korrekturlesen eine große Unterst¨ utzung f¨ ur mich. Ein weiteres Dankesch¨on geht an meine fr¨ uheren und aktuellen Kollegen der Universit¨at zu K¨oln. Dabei m¨ochte ich insbesondere Stefan Jaspersen f¨ ur viele hilfreiche Anmerkungen und Vorschl¨age zu meinem ersten Forschungsprojekt sowie David Fritz und Dr. Eugen T¨ows f¨ ur die Hilfe im Umgang mit L
ATEX nennen.
Bei meinen Eltern m¨ochte ich mich ganz besonders herzlich f¨ ur die uneingeschr¨ankte, liebevolle und vielseitige Unterst¨ utzung w¨ahrend meines gesamten Studiums und meiner Promotion bedanken.
K¨oln, Januar 2017 Benjamin D¨oring
This thesis consists of the following works:
D¨oring, Benjamin, Thomas Hartmann-Wendels, and Claudio Wewel (2016).
Systemic risk measures and their viability for banking supervision.
Working Paper.
D¨oring, Benjamin, Thomas Hartmann-Wendels, and Claudio Wewel (2016a).
Systemic importance, default risk, and profitability in the European banking system.
Working Paper.
D¨oring, Benjamin (2016).
Risk-adjusted bank performance and income diversification.
Working Paper.
Contents
Front matter xv
List of Tables . . . xv
List of Figures . . . xvii
1 Introduction 1 2 Systemic risk measures and their viability for banking supervision 5 2.1 Introduction . . . . 5
2.2 Sample selection . . . . 8
2.3 Systemic risk measures . . . 12
2.3.1 Marginal Expected Shortfall . . . 12
2.3.2 SRISK . . . 13
2.3.3 Conditional Value at Risk . . . 14
2.3.4 Implementation . . . 15
2.4 Evaluation methodology . . . 15
2.4.1 Assessment criteria . . . 16
2.4.2 Selection of state variables . . . 17
2.5 Empirical evidence . . . 20
2.5.1 SRMs’ predictive power . . . 20
2.5.2 Drivers of systemic risk . . . 30
2.5.3 Some critical remarks on SRMs . . . 33
2.6 Conclusion . . . 34
2.A Econometric approach . . . 36
2.B DCC GARCH . . . 40
2.C Time series diagnostics . . . 42
3 Systemic importance, default risk, and profitability in the European banking system 45 3.1 Introduction . . . 45
3.2 Measuring systemic importance . . . 48
3.3 Data . . . 49
3.3.1 Sample selection . . . 50
3.3.2 Bank characteristics . . . 50
3.3.3 Macroeconomic variables . . . 53
3.3.4 Descriptive statistics . . . 54
3.4 Empirical evidence . . . 57
3.4.1 Determinants of institutions’ default risk and return . . . 57
3.4.2 Impact of systemic importance on default risk and return . . . 63
3.4.3 Systemically important banks’ risk and return dynamics . . . 69
3.4.4 Robustness checks . . . 73
3.5 Conclusion . . . 75
3.A Supplementary tables . . . 77
4 Risk-adjusted bank performance and income diversification 87 4.1 Introduction . . . 87
4.2 Related literature . . . 90
4.3 Data and empirical method . . . 92
4.3.1 Sample selection . . . 92
4.3.2 Measures of bank performance and income diversification . . . 92
4.3.3 Control and dummy variables . . . 94
4.3.4 Descriptive statistics and correlation matrix . . . 98
4.3.5 Estimation method . . . 107
4.4 Empirical evidence . . . 108
4.5 Extended analysis and robustness tests . . . 113
4.6 Conclusion . . . 123
Bibliography 125
List of Tables
2.1 Bank characteristics and descriptives . . . 11
2.2 Summary of bank characteristics and descriptives . . . 12
2.3 Description of bank-specific and macroeconomic variables . . . 19
2.4 Correlation coefficients . . . 25
2.5 VAR results bank-specific variables . . . 27
2.6 VAR results macroeconomic variables . . . 29
2.7 Time series diagnostics (levels): p-values and test statistics . . . 43
2.8 Diagnostics of sample bank’s daily log return series: p-values and test statistics . . . 44
3.1 Summary statistics on bank characteristics and macroeconomic variables . 55 3.2 Summary statistics on bank characteristics by country . . . 56
3.3 Correlation coefficients of bank characteristics . . . 57
3.4 Determinants of default risk and return . . . 60
3.5 Drivers of the net profit margin . . . 61
3.6 Endogeneity and banks’ default risk and return . . . 62
3.7 Summary statistics of institutions’ default risk and return characteristics categorized by systemic importance . . . 65
3.8 Systemic importance, bank default risk, and return . . . 67
3.9 Systemically important banks’ risk and return dynamics . . . 70
3.10 Robustness tests: Systemic importance, bank default risk, and return . . . 78
3.11 Robustness tests: Systemically important banks’ risk and return dynamics (Quartile 1 regressions) . . . 79
3.12 Robustness tests: Systemically important banks’ risk and return dynamics (Top10 regressions) . . . 80
3.13 Robustness tests: Systemically important banks’ risk and return dynamics (including MES as independent variable) . . . 81
3.14 Robustness tests: Systemically important banks’ risk and return dynamics (separate regression analysis) . . . 82
3.15 Robustness tests: Systemically important banks’ risk and return dynamics (endogeneity issues) . . . 83
3.16 Robustness tests: Systemically important banks’ risk and return dynamics (MES as categorization criterion) . . . 85
4.1 Definition of variables . . . 97
4.2 Descriptive statistics . . . 99
4.3 Sample correlations . . . 100
4.4 Bank performance and income diversification by bank category . . . 103
4.5 Non-interest income share and the return on risk-weighted assets . . . 109
4.6 Baseline results: The non-interest income share and its subcomponents . . 112
4.7 Fee, trading, and other NII share and the RoRWA: An extended analysis . 115 4.8 Income diversification and bank size . . . 119
4.9 Income diversification and the impact of investment banks and listed banks 120
4.10 Different measures of income diversification and RoRWA . . . 122
List of Figures
2.1 Time evolution of bank-specific variables . . . 21
2.2 Time evolution of macroeconomic variables . . . 22
2.3 Time evolution of systemic risk measures . . . 23
3.1 Evolution of systemic importance . . . 51
3.2 Distribution of systemic importance . . . 51
3.3 Evolution of macroeconomic variables . . . 54
3.4 Systemic importance, default risk, and return . . . 64
3.5 Marginal contribution of systemic importance by quintile . . . 68
3.6 Systemically important banks’ default risk and return dynamics . . . 72
4.1 Distribution of the non-interest income share and its subcomponents . . . 101
4.2 Return on risk-weighted assets . . . 104
4.3 Bank type and income diversification . . . 105
4.4 Bank size and income diversification . . . 106
“We feel that fundamentally Wall Street is sound, and that for people who can afford to pay for them outright, good stocks are cheap at these prices.”
– Goodbody and Company market-letter quoted in The New York Times (Friday, October 25, 1929)
“Life’s biggest tragedy is that we get old too soon and wise too late.”
– Benjamin Franklin
1 Introduction
The U.S. housing bubble, with house prices peaking in 2006, was primarily initiated by lax mortgage lending standards of U.S. banks. As interest rates increased, however, fewer and fewer debtors were able to service their outstanding loans, which contributed to a sudden rise of the default rates of U.S. subprime mortgages in mid 2007. The following credit crunch, forcing banks to write down several hundred billion dollars in bad loans, has caused the most severe financial crisis since the Great Depression (Brunnermeier, 2009).
However, the unprecedented International Financial Crisis of 2007 to 2009 would not have reached such a global and disastrous scale without the bankruptcy of the investment bank Lehman Brothers in September 2008.
Before then, large and interconnected financial institutions were generally considered as ”too-big-too-fail”, ”too-interconnected-too-fail” or just ”systemically important” be- cause their default would easily trigger banking system turmoil with contagious effects spreading from one bank to the other. Therefore, bondholders and managers of those banks perceived their investments to be backed by implicit government bailout guaranties in the case of failure. This strategy worked for investors of Bear Stearns and Northern Rock. Both banks were rescued by their governments after experiencing significant losses in the aftermath of the U.S. credit crunch. In the case of Lehman Brothers, though, the U.S. Department of the Treasury and the Federal Reserve Bank were not willing to provide rescue funds guaranteed by the taxpayers to offset its liquidity shortage resulting from heavy subprime mortgage losses in early 2008 (Brunnermeier, 2009).
One explanation for this proceeding was the strategy to break the vicious cycle be- tween large banks’ ”too-big-too-fail” status and their corresponding government bailout guarantees. Nonetheless, the decision resulted in a loss of confidence of financial mar- ket participants and a disruption of the interbank lending market, which led to a severe liquidity crisis that globally prompted governments and central banks to intervene and bailout financial institutions. Thus, the Lehman bankruptcy can be best described as the trigger of a systemic event that significantly aggravated the U.S. credit crunch. Generally, such an event can be regarded as the materialization of the banking system’s underlying level of systemic risk, whereas systemic risk is tantamount to the risk of the occurrence of a severe banking crisis with spillover effects to the real economy (FSB, IMF, BIS, 2009).
As a response to the International Financial Crisis and the ripple effects of the default
of the investment bank Lehman Brothers, the Group of Twenty agreed on the implemen-
tation of a whole bunch of new regulatory rules commonly summarized as Basel III with
the purpose of, besides improving microprudential supervision, fostering the resilience
of the banking system by introducing macroprudential measures such as counter-cyclical capital buffers and capital surcharges for systemically important banks. The adequate application of such macroprudential measures, however, necessitates the precise measure- ment of a banking system’s level of systemic risk and a comprehensive understanding of the particularities of systemically important banks.
Notwithstanding the ongoing efforts of politicians, regulators, and supervisors to im- prove the stability of the global banking system and hence the reduction of systemic risk, European banks, especially those in the euro area, are still suffering from the long-term consequences of the International Financial Crisis and the subsequent European Sovereign Debt Crisis. Today, however, the insufficient profitability patterns of a lot of banks and the unsustainable business models of some of the largest European banks are in the spot- light and a growing concern for aggregate banking system stability (see, e.g., European Central Bank, May 2014, Financial Stability Review).
Unfortunately, especially the monetary policy of the European Central Bank (ECB) targeted at stimulating economic growth in the euro area with interest rates at or close to zero has become a growing drag on banks’ profitability patterns. It is more and more difficult for banks to achieve profits from maturity transformation because the yield curve flattened over the last couple of years. Moreover, at current market rates, banks are unable to profitably invest the excess supply of deposits into liquid and more or less risk-free financial assets. The fact that financial institutions are facing ever increasing costs from regulation and an enhanced competition from Fintechs is not particularly helpful either.
Given the European economic environment, one recurring expert suggestion to boost banks’ business model profitability and sustainability is the increased diversification into non-interest income generating activities such as fees and commissions. The question that remains, however, is whether the diversification into non-interest income is a gener- ally valid option for the average bank.
This thesis consists out of three essays on systemic risk, systemic importance, and bank profitability. To be more precise, the essays address the following three main questions.
How should we evaluate the viability of systemic risk measures? Do systemically im- portant banks (SIBs) exhibit default risk and return characteristics that are distinctively different from non-SIBs? How can banks adjust their business models in order to achieve sufficiently high but sustainable risk-adjusted profitability patterns in the post-crisis area?
The first essay (D¨oring et al., 2016, Systemic risk measures and their viability for bank-
ing supervision) contributes to the literature by proposing a criteria-based framework to
1 Introduction 3 assess the viability of systemic risk measures as a monitoring tool for banking supervision and investigates the bank characteristics that determine the banking system’s overall level of systemic risk. We empirically evaluate and compare the Marginal Expected Shortfall (MES) (Acharya et al., 2010), the SRISK measure (Acharya et al., 2012; Brownlees and Engle, 2015), and the Conditional Value at Risk (CoVaR) (Adrian and Brunnermeier, 2016) on the basis of a representative sample of listed European institutions covering the period from July 2005 to June 2013. The three measures have had the highest impact on research and regulation over the past years and are applied by the U.S. Department of the Treasury and the European Systemic Risk Board.
We assess the monitoring qualities of the former systemic risk measures (SRMs) by focusing on their forecasting capabilities for a set of major aggregated bank-specific and macroeconomic state variables. We find that all of them are informative for the prediction of the future state of the banking system; however, the measures vary significantly in their predictive power for the state of the real economy. In fact, only the MES and the SRISK measure are able to significantly explain future variations in the macroeconomic state variables. Furthermore, we find that the system-wide market-to-book and loan-to-deposit ratios act as fundamental drivers of systemic risk.
The results have paramount implications. First, the market-to-book ratio itself may be used as a simple and efficient proxy for the systemic tension in the banking system.
Second, the systemic relevance of the loan-to-deposit ratio underlines the critical role of funding liquidity and supports recently proposed regulatory initiatives that curb aggre- gate liquidity risks, i.e., the Basel III Liquidity Coverage Ratio and Net Stable Funding Ratio. Third, the inclusion of balance sheet data is beneficial for systemic risk measure- ment, which becomes obvious in a comparison between SRMs based on both balance sheet data and stock market information and SRMs based solely on stock market information.
The second essay (D¨oring et al., 2016a, Systemic importance, default risk, and prof- itability in the European banking system) examines the relation between banks’ systemic importance and their default risk and return characteristics on a broad sample of listed European banks. To be more specific, we analyze whether systemically important banks (SIBs) exhibit default risk and return patterns that are distinctively different from those of non-systemically important banks (non-SIBs). We apply the SRISK (Acharya et al., 2012; Brownlees and Engle, 2015) as the measure of systemic importance.
By grouping banks into quintiles according to their systemic importance we show
that SIBs’ default risk and return characteristics feature above average pro-cyclicality
with respect to economic conditions. We do not find evidence that non-SIBs exhibit
such patterns. These insights are particularly important for the design of macropruden- tial stress-testing procedures because supervisors need to separately account for SIBs’
and non-SIBs’ sensitivities to macroeconomic shocks. Our finding on the increased pro- cyclicality of SIBs’ financial stability patterns also indicates the usefulness of the Basel III leverage ratio for the regulation of SIBs since the former measure acts much more counter- cyclical than current regulations on risk-weighted assets (Brei and Gambacorta, 2015).
Furthermore, systemic importance coincides with significantly weaker return patterns.
That is, SIBs feature annual returns that are around 5% lower than those of non-SIBs.
In contrast, the 20% least systemically important banks exhibit returns that are approxi- mately 2% higher when compared to more systemically important banks. Institutions’ sys- temic nature, however, cannot be associated with higher levels of default risk, challenging the notion that systemically important banks take excessive risks as a result of perceived bailout guarantees. In fact, SIBs exhibit levels of ameliorating default risk over time.
The third essay (D¨oring, 2016, Risk-adjusted bank performance and income diversifi- cation) contributes to the academic literature by analyzing the effects of income diversifi- cation on banks’ profitability patterns for a broad sample of listed and unlisted euro area banks covering the period from 2007 to 2014. We measure bank profitability employing the ratio return on risk-weighted assets (RoRWA) and proxy a bank’s income diversifi- cation by calculating the shares of non-interest income, fee income, trading income, and other non-interest income in total operating income.
We apply the two-step system GMM (generalized method of moments) regression technique for estimation purposes developed by Arellano and Bover (1995) and Blundell and Bond (1998) in order to account for the possibility of reverse causalities between banks’ risk-adjusted profitability patterns and their non-interest income shares. The system GMM estimator is further capable of controlling for unobserved heterogeneity across our sample banks by first differencing the employed regression variables.
Our empirical analysis shows that the diversification into non-interest income activi-
ties such as fees, commissions, and trading substantially increases a bank’s profitability,
supporting the existence of economies of scope. However, we also find that a diversifica-
tion into other non-interest revenue streams is disadvantageous for the average bank. Yet,
the significance of the relations between the fee and trading income shares and bank per-
formance depends to a large extent on bank type and bank size. That is to say, especially
investment banks and banks with a stock exchange listing profit from the economies of
scope resulting from fee generating activities, whereas smaller banks are the only ones that
are able to significantly increase their RoRWAs by diversifying into trading activities.
2 Systemic risk measures and their viability for banking supervision
2.1 Introduction
How should we monitor systemic risk? In the aftermath of the Lehman bankruptcy that triggered an unprecedented international financial crisis this question has become of vital interest to regulators and researchers. Over the last years, a large number of approaches to measure both – systemic importance (at the institutional level) and systemic risk (at the banking system level) – have been proposed.
The Bank for International Settlements (2013), for example, identifies systemically important financial institutions (SIFIs) by various balance and off-balance sheet charac- teristics such as size, interconnectedness, and substitutability. Moreover, academia has recommended a whole bunch of approaches with a strand of literature based on asset prices applying standard risk measures such as the Conditional Value at Risk (Adrian and Brunnermeier, 2016) and the Marginal Expected Shortfall (Acharya et al., 2010), ex- treme value theory (De Jonghe, 2010; Zhou, 2010), principal components analysis (Billio et al., 2012; Kritzman et al., 2011), and credit default models and default probabilities (Suh, 2012; Gray and Jobst, 2010; Huang et al., 2009; Segoviano and Goodhart, 2009;
Lehar, 2005). Another strand of literature applies network analysis to investigate systemic risk arising from interbank relationships (e.g., Halaj and Kok Sorensen, 2013; Drehmann and Tarashev, 2013; Allen et al., 2010). Furthermore, supervisors and academia suggest the use of simple market indicators such as Libor-OIS and credit default swap spreads for the monitoring of systemic risk. For an extensive survey on the literature on systemic risk measurement we refer to Bisias et al. (2012).
Despite the multitude of approaches, research on the measures’ capability to effec- tively capture and predict the dynamics of systemic risk and its potential consequences is scarce. For macroprudential policymaking and supervision, however, the assessment of the measures’ adequacy as a monitoring tool is crucial. But how can we determine whether systemic risk measures (SRMs) are viable as a monitoring tool or not?
While it is difficult to assess SRMs at the institutional level because an individual bank’s rank with respect to its systemic importance is predominantly determined by the applied measure, evaluating SRMs at the banking system level is more expedient.
According to the definition of the International Monetary Fund, aggregate systemic risk
is the risk of excessive losses within all or parts of the financial system with imminent
negative spillover effects to the real economy (FSB, IMF, BIS, 2009). Recent research supports this definition. E.g., Reinhart and Rogoff (2009) show that systemic financial crises often have substantial adverse effects on the overall state of the economy, such as drops in asset prices, output, and employment levels. Therefore, expedient SRMs should be capable of pre-identifying banking system distress as well as downturns in the real economy in order to gauge the overall level of systemic risk.
This paper contributes to the literature on the analysis of SRMs and underlying aggre- gate systemic risk by proposing a criteria-based framework that can be applied to assess the viability of SRMs as a monitoring tool for banking supervision. We make use of our assessment framework and empirically evaluate and compare the Marginal Expected Shortfall (MES), the related SRISK measure (Acharya et al., 2012; Brownlees and Engle, 2015), and the Conditional Value at Risk (CoVaR). Over the past years, these measures have had the highest impact on research and regulations. They are applied by the U.S.
Treasury Department and the European Systemic Risk Board.
To be more specific, we compute time series of cross-sectional averages for the bank- level series of MES, SRISK, and CoVaR in order to evaluate the measures’ capability of capturing the level of systemic risk by focusing on their predictive power for a set of major aggregated bank-specific and macroeconomic state variables. We investigate the directionalities and dependencies between the SRMs and the latter variables employing vector autoregressions. This approach allows us to simultaneously examine the aggregate bank characteristics that determine the banking system’s overall level of systemic risk, which is vital in order to achieve macroeconomic stability (Arnold et al., 2012). We apply the measures to a broad sample of European publicly listed banks analyzing the level of systemic risk in the European banking system in the period between July 2005 and June 2013. The latter provides a unique setting for the evaluation of SRMs, as European institutions were affected by both the Subprime Crisis including the subsequent International Financial Crisis of 2007–2009 and the European Sovereign Debt Crisis.
Our main results are as follows. We find that all three SRMs generally possess substan-
tial predictive power for bank-specific state variables, including those that directly proxy
for the banking system’s capital strength and crisis resilience. For instance, an increase
in the value of the measures coincides with an increase in the future level of system-wide
leverage and a decrease of aggregate equity values. The forecasting capabilities of MES
and SRISK for macroeconomic state variables, particularly for aggregate production and
employment, are superior to those of CoVaR, however. In fact, CoVaR’s capability of
capturing the future state of the real economy is rather poor. Thus, given the depen-
dencies between the SRMs and bank-specific and macroeconomic state variables, only the
2 Systemic risk measures and their viability for banking supervision 7 dynamics of MES and SRISK are informative for the identification of true systemic events.
A sharp increase of the latter coincides with a deterioration of the state of the banking system and a decrease in macroeconomic activity. A sharp increase in CoVaR, on the contrary, does not precisely distinguish between banking system turmoil with no macroe- conomic effects and systemic banking crises that cause downturns in the real economy.
Our analysis additionally reveals that the ratio of market valued equity to book val- ued equity (MTB) and the ratio of total loans to total customer deposits (LTD), both calculated as the aggregate of institutions within the predefined banking system, act as fundamental drivers of systemic risk. Both ratios significantly determine the future dy- namics of MES, SRISK, and CoVaR at the banking system level. I.e., lower levels of the MTB ratio (higher levels of the LTD ratio) are associated with higher levels of future systemic risk.
The results have paramount implications. First, the MTB ratio, capturing the mar- ket’s view about banks’ aggregate risk of financial distress by itself, may be used as a simple early warning indicator for the banking system’s systemic tension. The latter in- dicated a significant deterioration in the value of European banks as early as in 2007, pointing at the risk of a systemic banking crisis. Moreover, since it is well-documented in literature that lower MTB values of equity can be mainly attributed to lower earnings expectations, higher earnings uncertainty, and elevated debt burdens (Chen and Zhang, 1998; Fama and French, 1995), our findings indicate that banks’ earnings volatility con- tributes to systemic risk. Thus, supervisors might incentivize institutions to establish more sustainable business models with higher earnings certainty such as to reduce their vulnerability in times of crises, thereby reducing institutions’ aggregate systemic footprint.
Second, the significance of the aggregate LTD ratio demonstrates that an effective regulation of funding liquidity risk is vital to lower the overall level of systemic risk.
Therefore, our empirical findings stress the importance of the new Basel III guidelines concerning limits on institutions’ liquidity mismatch and the strengthening of the institu- tions’ ability to survive periods of stress without market funding, namely the Net Stable Funding Ratio and the Liquidity Coverage Ratio.
Finally, our results reveal that the inclusion of balance sheet data is beneficial for sys- temic risk measurement. This becomes particularly visible in a comparison between SRMs based on both balance sheet and stock market information and SRMs based exclusively on stock market information.
Our paper is most closely related to the work of Rodriguez-Moreno and Pe˜ na (2013),
who evaluate the performance of SRMs at the banking system level based on their cor-
relation with an index of systemic events and policy actions. In contrast, we establish a
criteria-based approach that explicitly considers the consequences of changes in the SRMs’
level of systemic risk for a set of aggregated bank-specific and macroeconomic state vari- ables. Our approach does not require the identification of systemic events that may be prone to selection biases. Moreover, we are – to the best of our knowledge – the first to identify aggregate bank characteristics that drive the overall level of systemic risk.
We contribute to a growing body of literature on the MES, SRISK, and CoVaR mea- sures, which can be systemized as follows. The first strand implements MES, SRISK (e.g., Engle et al., 2014; Idier et al., 2014; Acharya and Steffen, 2013) or CoVaR (e.g., Weiß et al., 2014; Brunnermeier et al., 2012; L´opez-Espinosa et al., 2012) and identifies determinants of systemic importance at the institutional level. These studies find, among others, that balance sheet characteristics such as banks’ non-interest income, short-term wholesale funding or regulatory standards substantially drive an institution’s systemic importance.
Another strand of literature compares or extends these measures. Jiang (2012) an- alyzes the tail dependence structure of MES and CoVaR. Benoit et al. (2013) rank US financial institutions according to MES, SRISK, and CoVaR and find that the risk mea- sures can be proxied by market risk and liabilities. L¨offler and Raupach (2013) estimate the robustness of MES and CoVaR. Girardi and Erg¨ un (2013) propose the use of bivariate GARCH estimates to measure CoVaR and Cao (2013) extends the CoVaR measure from one bank being in financial distress to a set of one or more banks being in distress.
The remainder of this paper is structured as follows. Section 2.2 describes the sample selection and Section 2.3 defines the SRMs. In Section 2.4 we introduce our assessment framework as well as the employed aggregated bank-specific and macroeconomic variables.
Section 2.5 presents and discusses our results and Section 2.6 concludes.
2.2 Sample selection
Our empirical analysis focuses on the European banking system. We concentrate on the member states of the European Union to ensure sufficient homogeneous banking regula- tion across our sample excluding countries from Eastern Europe. However, we additionally include Switzerland due to its comparable regulatory standards and the country’s indi- vidual banking sector’s importance within the European banking system.
1Our sample covers the period from July 2005 to June 2013 including the International Financial Crisis
1
All member states of the European Union and Switzerland implemented the Basel II Directives
2006/48/EC and 2006/49/EC and are introducing the new Basel III criteria.
2 Systemic risk measures and their viability for banking supervision 9 from 2007 to 2009 and the subsequent European Sovereign Debt Crisis.
Beyond location, we select banks according to the following two main criteria: free float market capitalization and total assets. By restricting our sample to free float publicly listed institutions, we ensure that all sample banks are actively traded and that institu- tions’ share prices adequately reflect their financial state and health. Thus, as a starting point we identify all banks that are included in the STOXX Europe TMI Banks Index in at least one quarter within the sample period and select those that fit our geographical restrictions.
2This procedure ensures that our sample of banks adequately reflects the aggregate of traded stocks of banks in Western Europe leaving us with 126 banks.
3In the next step, all preselected banks are ranked with respect to their size in total assets. Based on the Single Supervisory Mechanism (SSM) approved by the European Commission, the European Central Bank started supervising euro area based banks with total assets exceeding e 30bn in November 2014 (Council Regulation 1024/2013/EU). Re- stricting our sample to institutions that fulfill the latter criterion for at least one quarter within the sample period, we ensure that our sample only includes institutions with rele- vant systemic exposure to the European banking system. Furthermore, we apply a penny stock sanction excluding banks in case their stock is traded at a price of lower than e 1 for 22 consecutive trading days. To ensure that our sample does not suffer from any survivorship biases, we do not exclude banks that are delisted from the STOXX Europe TMI Banks Index.
The resulting sample contains 84 banks from 15 countries including Austria, Belgium, Denmark, Finland, France, Germany, Greece, Ireland, Italy, the Netherlands, Portugal, Spain, Sweden, Switzerland, and the United Kingdom. As a result of bankruptcies, merg- ers and acquisitions, and new listings the number of sample banks varies over time with a maximum of 78 and a minimum of 51 banks per sample quarter.
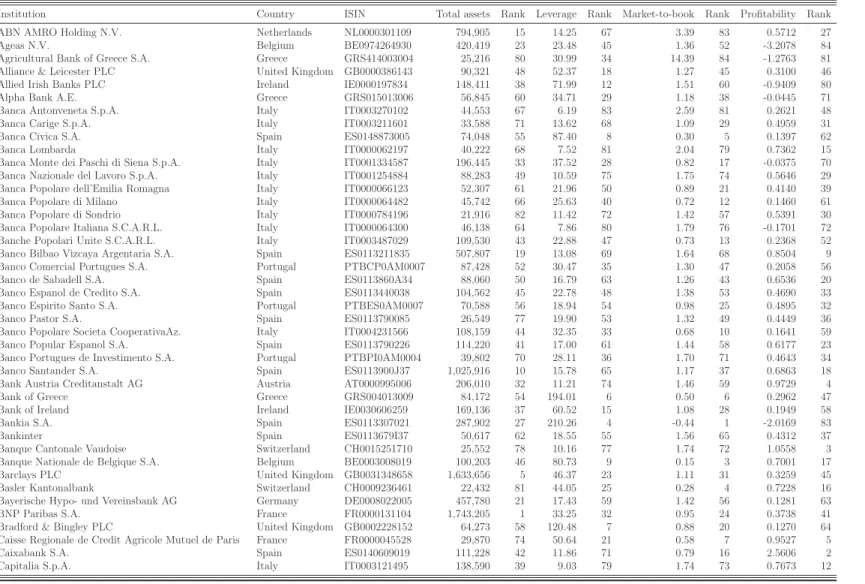
For our predefined selection of banks, we obtain all stock price information and quar- terly balance sheet data from Datastream. Table 2.1 displays the names and different characteristics of the banks in our sample and Table 2.2 provides a summary of the lat- ter. The institutions’ mean total assets over the sample period range from e 13.8bn to
2
The individual banks are admitted into the index based on their free float market capitalization and cover roughly 95% of the free float market capitalization of all banks headquartered in Western Europe. The index composition is updated on a quarterly basis (STOXX Limited, 2013, STOXX Index Methodology Guide, http://www.stoxx.com/indices/rulebooks.html).
3
To our preselection of banks we furthermore add the ING Groep. STOXX classifies the ING Groep
as an insurance company. However, a substantial part of ING’s revenue comes from banking related
activities. In addition, the bank is classified as a global systemically important bank by the Financial
Stability Board.
st em ic ri sk m ea su re s a n d th ei r v ia b ili ty fo r b a n k in g su p er v is io n 10
Institution Country ISIN Total assets Rank Leverage Rank Market-to-book Rank Profitability Rank
ABN AMRO Holding N.V. Netherlands NL0000301109 794,905 15 14.25 67 3.39 83 0.5712 27
Ageas N.V. Belgium BE0974264930 420,419 23 23.48 45 1.36 52 -3.2078 84
Agricultural Bank of Greece S.A. Greece GRS414003004 25,216 80 30.99 34 14.39 84 -1.2763 81
Alliance & Leicester PLC United Kingdom GB0000386143 90,321 48 52.37 18 1.27 45 0.3100 46
Allied Irish Banks PLC Ireland IE0000197834 148,411 38 71.99 12 1.51 60 -0.9409 80
Alpha Bank A.E. Greece GRS015013006 56,845 60 34.71 29 1.18 38 -0.0445 71
Banca Antonveneta S.p.A. Italy IT0003270102 44,553 67 6.19 83 2.59 81 0.2621 48
Banca Carige S.p.A. Italy IT0003211601 33,588 71 13.62 68 1.09 29 0.4959 31
Banca Civica S.A. Spain ES0148873005 74,048 55 87.40 8 0.30 5 0.1397 62
Banca Lombarda Italy IT0000062197 40,222 68 7.52 81 2.04 79 0.7362 15
Banca Monte dei Paschi di Siena S.p.A. Italy IT0001334587 196,445 33 37.52 28 0.82 17 -0.0375 70
Banca Nazionale del Lavoro S.p.A. Italy IT0001254884 88,283 49 10.59 75 1.75 74 0.5646 29
Banca Popolare dell’Emilia Romagna Italy IT0000066123 52,307 61 21.96 50 0.89 21 0.4140 39
Banca Popolare di Milano Italy IT0000064482 45,742 66 25.63 40 0.72 12 0.1460 61
Banca Popolare di Sondrio Italy IT0000784196 21,916 82 11.42 72 1.42 57 0.5391 30
Banca Popolare Italiana S.C.A.R.L. Italy IT0000064300 46,138 64 7.86 80 1.79 76 -0.1701 72
Banche Popolari Unite S.C.A.R.L. Italy IT0003487029 109,530 43 22.88 47 0.73 13 0.2368 52
Banco Bilbao Vizcaya Argentaria S.A. Spain ES0113211835 507,807 19 13.08 69 1.64 68 0.8504 9
Banco Comercial Portugues S.A. Portugal PTBCP0AM0007 87,428 52 30.47 35 1.30 47 0.2058 56
Banco de Sabadell S.A. Spain ES0113860A34 88,060 50 16.79 63 1.26 43 0.6536 20
Banco Espanol de Credito S.A. Spain ES0113440038 104,562 45 22.78 48 1.38 53 0.4690 33
Banco Espirito Santo S.A. Portugal PTBES0AM0007 70,588 56 18.94 54 0.98 25 0.4895 32
Banco Pastor S.A. Spain ES0113790085 26,549 77 19.90 53 1.32 49 0.4449 36
Banco Popolare Societa CooperativaAz. Italy IT0004231566 108,159 44 32.35 33 0.68 10 0.1641 59
Banco Popular Espanol S.A. Spain ES0113790226 114,220 41 17.00 61 1.44 58 0.6177 23
Banco Portugues de Investimento S.A. Portugal PTBPI0AM0004 39,802 70 28.11 36 1.70 71 0.4643 34
Banco Santander S.A. Spain ES0113900J37 1,025,916 10 15.78 65 1.17 37 0.6863 18
Bank Austria Creditanstalt AG Austria AT0000995006 206,010 32 11.21 74 1.46 59 0.9729 4
Bank of Greece Greece GRS004013009 84,172 54 194.01 6 0.50 6 0.2962 47
Bank of Ireland Ireland IE0030606259 169,136 37 60.52 15 1.08 28 0.1949 58
Bankia S.A. Spain ES0113307021 287,902 27 210.26 4 -0.44 1 -2.0169 83
Bankinter Spain ES0113679I37 50,617 62 18.55 55 1.56 65 0.4312 37
Banque Cantonale Vaudoise Switzerland CH0015251710 25,552 78 10.16 77 1.74 72 1.0558 3
Banque Nationale de Belgique S.A. Belgium BE0003008019 100,203 46 80.73 9 0.15 3 0.7001 17
Barclays PLC United Kingdom GB0031348658 1,633,656 5 46.37 23 1.11 31 0.3259 45
Basler Kantonalbank Switzerland CH0009236461 22,432 81 44.05 25 0.28 4 0.7228 16
Bayerische Hypo- und Vereinsbank AG Germany DE0008022005 457,780 21 17.43 59 1.42 56 0.1281 63
BNP Paribas S.A. France FR0000131104 1,743,205 1 33.25 32 0.95 24 0.3738 41
Bradford & Bingley PLC United Kingdom GB0002228152 64,273 58 120.48 7 0.88 20 0.1270 64
Caisse Regionale de Credit Agricole Mutuel de Paris France FR0000045528 29,870 74 50.64 21 0.58 7 0.9527 5
Caixabank S.A. Spain ES0140609019 111,228 42 11.86 71 0.79 16 2.5606 2
Capitalia S.p.A. Italy IT0003121495 138,590 39 9.03 79 1.74 73 0.7673 12
Table 2.1 – Bank characteristics and descriptives (continued on the next page)
2 S y st em ic ri sk m ea su re s a n d th ei r v ia b ili ty fo r b a n k in g su p er v is io n 11
Institution Country ISIN Total assets Rank Leverage Rank Market-to-book Rank Profitability Rank
Commercial Bank of Greece Greece GRS006013007 25,549 79 20.63 52 2.72 82 -1.7566 82
Commerzbank AG Germany DE000CBK1001 663,395 16 75.76 10 0.65 8 0.0746 67
Cr´edit Agricole S.A. France FR0000045072 1,465,511 6 66.49 13 0.75 14 0.1258 65
Credit Suisse Group AG Switzerland CH0012138530 805,461 13 23.01 46 1.54 64 0.3263 44
Credito Emiliano S.p.A. CredemAz. Italy IT0003121677 27,395 76 17.17 60 1.22 40 0.5992 25
Credito Valtellinese S.C.A.R.L. Az. Italy IT0000064516 21,571 83 27.99 37 0.66 9 0.2063 55
Danske Bank Denmark DK0010274414 415,945 24 33.83 30 1.04 27 0.2476 50
Depfa Bank Germany IE0072559994 223,521 30 44.54 24 1.86 77 0.2268 53
Deutsche Bank AG Germany DE0005140008 1,722,101 2 53.30 17 0.94 23 0.2040 57
Deutsche Postbank AG Germany DE0008001009 196,433 34 33.52 31 1.24 41 0.1484 60
Dexia S.A. Belgium BE0003796134 523,914 18 506.42 1 0.93 22 -0.2472 73
Erste Group Bank AG Austria AT0000652011 194,229 35 20.65 51 1.34 50 0.3545 42
Eurobank Ergasias S.A. Greece GRS323003004 67,235 57 64.02 14 1.24 42 -0.4100 75
GAM Holding AG Switzerland CH0102659627 13,786 84 3.12 84 1.68 70 13.8219 1
HBOS PLC United Kingdom GB0030587504 805,950 12 51.84 19 1.76 75 -0.3134 74
HSBC Holdings United Kingdom GB0005405286 1,644,162 4 13.06 70 1.42 55 0.6277 21
IKB Deutsche Industriebank AG Germany DE0008063306 40,094 69 73.66 11 0.86 18 -0.5720 77
ING Groep N.V. Netherlands NL0000303600 1,220,294 7 40.27 26 1.15 33 0.3428 43
Intesa Sanpaolo S.p.A. Italy IT0000072626 542,920 17 301.56 3 0.87 19 0.4532 35
Investec PLCShs United Kingdom GB00B17BBQ50 45,940 65 18.47 57 1.59 66 0.8766 8
Irish Bank Resolution Corporation Ltd Ireland IE00B06H8J93 87,850 51 329.59 2 1.19 39 0.8093 11
Julius B¨ar Switzerland CH0102484968 32,597 72 7.02 82 1.65 69 0.7451 13
Jyske Bank Denmark DK0010307958 28,094 75 15.85 64 1.40 54 0.6222 22
KBC Groep N.V. Belgium BE0003565737 318,055 25 26.93 39 1.11 30 0.2164 54
Lloyds Banking Group United Kingdom GB0008706128 798,099 14 24.21 42 1.53 63 0.3948 40
Mediobanca - Banca di Credito Finanziario S.p.A. Italy IT0000062957 64,004 59 10.51 76 1.26 44 0.9519 6
National Bank of Greece S.A. Greece GRS003003019 93,762 47 24.01 44 1.17 36 -0.7827 79
Natixis Banques Populaires France FR0000120685 425,956 22 50.14 22 0.69 11 0.0777 66
Nordea Bank AB Sweden SE0000427361 485,820 20 18.53 56 1.35 51 0.5956 26
Northern Rock PLC United Kingdom GB0001452795 123,666 40 195.77 5 0.11 2 -0.5364 76
Piraeus Bank S.A. Greece GRS014003008 46,352 63 51.79 20 1.16 34 -0.7509 78
Pohjola Bank PLC Finland FI0009003222 32,148 73 16.83 62 1.16 35 0.6632 19
Raiffeisen Bank International AG Austria AT0000606306 86,980 53 15.23 66 1.52 62 0.9156 7
Royal Bank of Scotland Group PLC United Kingdom GB00B7T77214 1,689,769 3 56.99 16 1.15 32 0.0660 69
Sanpaolo IMI S.p.A. Az. Italy IT0001269361 279,409 28 11.26 73 2.17 80 0.7428 14
Skandinaviska Enskilda Banken AB Sweden SE0000148884 236,951 29 22.75 49 1.29 46 0.4223 38
Soci´et´e G´en´erale S.A. France FR0000130809 1,054,032 9 38.11 27 1.04 26 0.2606 49
Standard Chartered PLC United Kingdom GB0004082847 299,863 26 9.52 78 1.59 67 0.8342 10
Svenska Handelsbanken AB Sweden SE0000193120 220,029 31 17.59 58 1.51 61 0.6166 24
Swedbank AB Sweden SE0000242455 175,054 36 24.05 43 1.31 48 0.5677 28
UBS AG Switzerland CH0024899483 1,212,246 8 24.99 41 1.99 78 0.0746 68
UniCredit S.p.A. Italy IT0004781412 850,254 11 27.05 38 0.79 15 0.2388 51
Table 2.1 – Bank characteristics and descriptives
The table exhibits figures averaged across the entire time series of quarterly bank characteristics for each of the 84 sample banks. The time series
of observations cover the period from July 2005 to June 2013. Total assets is the book value of total assets expressed in EUR m. Leverage is the
ratio of market valued total assets (book valued total debt + market valued equity) divided by market valued equity and market-to-book is the ratio
of market valued equity divided by book valued equity. Profitability is defined as the ratio of net income over total assets expressed in percentage
terms. All data are obtained from Datastream.
Statistics Total assets Leverage Market-to-book Profitability
mean 343,964 49.07 1.40 0.41
std dev 466,554 76.42 1.54 1.65
min 13,786 3.12 -0.44 -3.21
q = 0.25 46,298 16.55 0.92 0.13
q = 0.50 110,379 24.13 1.25 0.35
q = 0.75 433,912 50.27 1.53 0.62
max 1,743,205 506.42 14.39 13.82
Table 2.2 – Summary of bank characteristics and descriptives
The table provides a summary of Table 2.1. Total assets is the book value of total assets expressed in EUR m. The time series of observations cover the period from July 2005 to June 2013. Leverage is the ratio of market valued total assets (book valued total debt + market valued equity) divided by market valued equity and market-to-book is the ratio of market valued equity divided by book valued equity.
Profitability is defined as the ratio of net income over total assets expressed in percentage terms. All data are obtained from Datastream.
e 1,743bn. The median-sized bank has around e 110bn in total assets. Our sample banks are leveraged (market leverage) between 3.12 and 506.42 with a median leverage of 24.13 across the sample period. The banks’ mean market-to-book ratio of equity ranges from -0.44 to 14.39 across the sample period with a sample median of 1.25.
4The institutions’
mean profitability (return on assets) over the sample period ranges from 13.82% to -3.21%
with a sample median of 0.35%.
2.3 Systemic risk measures
This section briefly defines the systemic risk measures (SRMs) implemented in this paper and elaborates on their econometric implementation.
2.3.1 Marginal Expected Shortfall
The Marginal Expected Shortfall (MES) proposed by Acharya et al. (2010) measures the expected return (loss) of bank i’s stock given that the banking system’s overall return is in its tail. More intuitively, the MES can be interpreted as the ”participation rate” of bank i within a financial crisis. Following Acharya et al. (2010), Brownlees and Engle (2015) introduce a time-dependent dynamic extension of the MES that is defined as bank
4
After its IPO in July 2011, Bankia S.A. requested a bailout of e 19bn in May 2012 and was partially
nationalized by the Spanish government. As a consequence, the bank reported on average a negative
balance for its book value of equity over the sample period.
2 Systemic risk measures and their viability for banking supervision 13 i’s expected cumulative h-day stock return – i.e., over time interval [t, t + h] – with the condition that the banking system’s cumulative h-day return is falling below a predefined threshold C, indicating distress in the banking system:
MES
i,ht(C) = −E
R
i;[t,t+h]R
sys;[t,t+h]≤ C
, (2.1)
with R
i;[t,t+h]denoting bank i’s cumulative stock return over h days:
R
i;[t,t+h]= exp
h
X
τ=1
r
i,t+τ!
− 1. (2.2)
r
i,trepresents the one-day returns of bank i’s stock. The h-day banking system return R
sys;[t,t+h]is defined analogously. Note that for the ease of interpretation, we switch the sign for the risk measure. Thus, an increase in the measure indicates an increase in the level of systemic risk.
2.3.2 SRISK
Based on the MES, Acharya et al. (2012) directly model a bank’s expected undercapital- ization during a financial crisis. The proposed systemic risk measure, SRISK, therefore incorporates financial market data as well as balance sheet data. A bank’s capital shortfall or its undercapitalization, respectively, is defined as the amount of capital that a bank would have to raise during a financial crisis in order to prevent bankruptcy. Hence, a bank’s expected time-varying capital shortfall over the time interval [t, t + h] given the event of a financial crisis or severe distress in the banking system is calculated as follows:
SRISK
i,ht(C, k) = E
capital shortfall
i;[t,t+h]crisis
. (2.3a)
Applying the going concern loss absorbing capacity concept, Equation (2.3a) can be re- arranged:
SRISK
i,ht(C, k) = E h
{ k × (debt + equity) − equity }
i;[t,t+h]crisis i
, (2.3b)
In order to prevent bankruptcy, institution i’s equity cushion needs to be larger than a
fraction k of the (market valued) total assets. Within the Basel III framework, parameter
k can be considered to represent the absolute Tier I capital ratio of 3%, which is consistent
with the Basel III maximum Leverage Ratio of 33.3 that must be satisfied even during a
crisis. In that case, k can be interpreted as a Basel Capital Adequacy Ratio equivalent on
market valued total assets instead of risk-weighted assets. The market value of total assets is determined using current debt balance sheet data – assuming that the levels of debt remain relatively constant over the observed time interval [t, t + h] – and the market value of equity. The market value of equity within a future financial crisis can be expressed as a function of MES:
SRISK
i,ht(C, k) = k × debt
i,t− (1 − k)
1 − MES
i,ht(C)
× equity
i,t. (2.3c) The higher a bank’s SRISK, the higher its capital shortfall during a crisis period. A negative SRISK indicates that a bank’s equity cushion is sufficiently large in order to avoid bankruptcy.
2.3.3 Conditional Value at Risk
The bottom-up measure Conditional Value at Risk (CoVaR) proposed by Adrian and Brunnermeier (2016) explicitly allows the calculation of a bank’s contribution to systemic risk in the banking system measuring the value at risk return of the banking system conditional on institution i being in severe financial distress. In analogy to the MES and SRISK measures we define a multi-period CoVaR measure that is in line with the CoVaR extension of Girardi and Erg¨ un (2013). The ”distress CoVaR” CoVaR
sys|i≤VaR,ht
is defined
as the banking system’s h-day value at risk return, conditional on bank i’s h-day stock return being at or below bank i’s h-day value at risk:
P
R
sys;[t,t+h]≤ CoVaR
sys|i≤VaR,ht
(q)
R
i;[t,t+h]≤ VaR
i,ht,q= q, (2.4a)
with VaR
i,ht,qdenoting bank i’s h-day value at risk return. Parameter q indicates the confidence level.
5The median state CoVaR is given by conditioning on the one standard deviation band around institution i’s median h-day return:
P
R
sys;[t,t+h]≤ CoVaR
sys|i=median,ht
(q)
R
i;[t,t+h]− ν
i,th≤ σ
hi,t= q, (2.4b)
5
Whereas Adrian and Brunnermeier (2016) estimate CoVaR using a quantile regression approach, we
employ a bivariate conditionally heteroskedastic model to account for the time-varying dependence
structure between banks and the banking system, which enables the measure to better capture the
tail events of distress (Girardi and Erg¨ un, 2013). Furthermore, we are able to evaluate all three SRMs
within a common statistical setup that improves the comparability and interpretability of our key
results.
2 Systemic risk measures and their viability for banking supervision 15 where σ
hi,tand ν
i,thindicate the standard deviation and the median return of institution i’s h-day cumulative stock return. Thus, institution i’s marginal systemic risk contribution to overall systemic risk in the banking system is defined as the difference between the system’s CoVaR conditional on bank i being in financial distress and the system’s CoVaR conditional on bank i being in its median state:
∆CoVaR
i,ht(q) = − h
CoVaR
sys|i≤VaR,ht
(q) − CoVaR
sys|i=median,ht
(q) i
. (2.4c)
Note that again we switch the sign of ∆CoVaR in order to facilitate the comparison of the three different risk measures MES, SRISK, and ∆CoVaR.
2.3.4 Implementation
We follow Brownlees and Engle (2015) and calculate weekly series of SRMs for each of the 84 sample banks by modeling the bivariate return dynamics of bank i and the banking system employing a conditionally heteroskedastic model and estimate the return distributions of R
i;[t,t+h]and R
sys;[t,t+h]by applying Monte Carlo simulation techniques.
We set the crisis regime threshold C = − 25%, the leverage ratio parameter k = 3%, the VaR confidence level q = 5%, and the length of the SRMs’ forward looking period h = 60 days (a quarter of a year).
6For a detailed exposition of the implementation methodology we refer to Appendix 2.A.
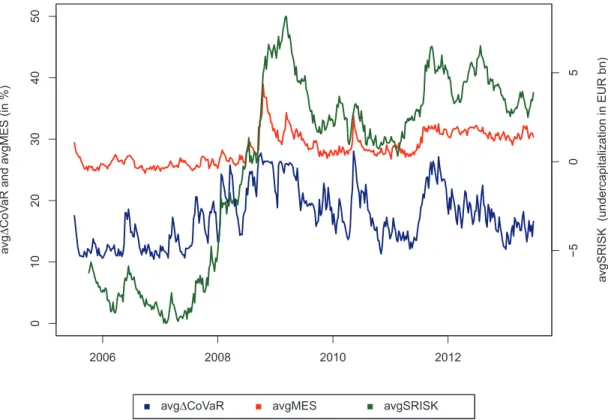
Finally, we compute time series of cross-sectional averages for the bank-level series of MES, SRISK, and ∆CoVaR in order to evaluate the measures’ ability to gauge the overall systemic tension in the banking system and to examine the determinants of the banking system’s aggregate level of systemic risk. We call these averaged measures avgMES, avgSRISK, and avg∆CoVaR.
2.4 Evaluation methodology
Evaluating the viability of SRMs as a tool for macroprudential supervision necessitates the development of a framework that can be readily applied to assess the SRMs’ ability of capturing the overall level of systemic risk in a banking system. In the following, we
6
To calibrate the threshold level C, we observed the performance of the STOXX Europe TMI Banks
Index during the most severe periods of the International Financial Crisis and the European Sovereign
Debt Crisis. In both periods the index dropped on average by around 25% within a three month time
window.
motivate our assessment criteria and provide an outline of the empirical data (i.e., the choice of variables) that our empirical analysis requires.
2.4.1 Assessment criteria
By definition SRMs are designed to measure the systemic importance of individual banks and/or the level of systemic risk in a predefined system. Since we are solely interested in the SRMs’ macro perspective, the evaluation of the latter, in particular, requires a concept of what systemic risk is. Generally, systemic risk can be regarded as the risk or danger of the occurrence of a systemic event, whereas the systemic event is tantamount to the materialization of systemic risk. In recent years, policy-making institutions have defined the term systemic risk in numerous ways. However, most of the definitions feature adverse effects of systemic events on the banking system and the macroeconomy. The International Monetary Fund (FSB, IMF, BIS, 2009) provides a useful working definition of systemic risk:
Systemic risk is the risk of excessive losses within all or parts of the financial system with imminent negative spillover effects to the real economy.
The above definition is twofold and features the two main preconditions that we will use as foundations for our assessment criteria that we derive in the following.
According to the IMF, systemic risk first materializes as banking system turmoil. The materialization of systemic risk in return implies that an indicator of systemic risk (or an SRM, respectively) should sharply increase before the onset of such an event. Moreover, an SRM should – to some extent – be capable of predicting the consequences of systemic risk materialization. Thus, we can formulate the following assessment criterion:
Criterion 1 SRMs should possess predictive power for the state of the banking system.
In addition to the distress that systemic events cause to the banking system, the IMF definition features imminent spillover effects to the real economy that could potentially result in an economic recession. Such spillovers from the banking system to the real economy typically manifest themselves in substantial drops in output and employment (Reinhart and Rogoff, 2009). Hence, increases in systemic risk (as indicated by SRMs) should have predictive power for such spillover effects:
Criterion 2 SRMs should possess predictive power for macroeconomic state variables.
The latter assessment criteria are crucial, because forward looking measures that possess
predictive power for the state of the banking system and the real economy are able to
2 Systemic risk measures and their viability for banking supervision 17 capture current systemic risk exposures. Consequentially, such measures may act as early warning indicators at the banking system level.
Measures fulfilling both criteria have to be negatively correlated with the general state of the banking system as well as the state of the real economy. Thus, a sharp increase in systemic risk (as indicated by the SRMs) would indicate a deterioration of the future state of the banking system and a decrease in macroeconomic activity. In contrast, SRMs that are uncorrelated with the state of the banking system and/or the real economy are incapable of effectively distinguishing between financial turmoil in the banking system with no macroeconomic effects, macroeconomic cycles with little effect on the banking system, and true systemic events.
However, our empirical evaluation of the SRMs’ ability to measure systemic risk ac- cording to the above definition and criteria requires a comprehensive measurement of the state of the banking system, especially the banking system’s level of financial distress, and it’s corresponding macroeconomic activity.
2.4.2 Selection of state variables
We assess the SRMs’ predictive power employing a set of aggregated bank-specific and macroeconomic variables, which we discuss briefly in the following.
Bank-specific variables
We measure the banking system’s aggregate default risk applying the variables leverage and Z-score. We define leverage as the ratio of market valued total assets over market valued equity. Market valued total assets is calculated as the sum of total book valued debt and market valued equity. The system-wide ratio of leverage therefore reflects institutions’
aggregate capital strength and crisis resilience. The Z-score gives the number of standard deviations that an institution’s return on assets needs to decline in order to trigger its bankruptcy, given its current capital asset ratio (Hannan and Hanweck, 1988; Boyd and Runkle, 1993). A lower Z -score at the banking system level therefore implies a higher propensity to systemic default. We calculate the measure as (roa
t+ car
t)/σ (roa), where roa denotes the return on assets, car the capital asset ratio, and σ (roa) the return on assets’ standard deviation over the sample period.
Furthermore, we capture the market’s view about institutions’ aggregate risk of finan-
cial distress employing the variable market-to-book (MTB). MTB is defined as market
valued equity divided by book valued equity. The ratio is primarily driven by future
earnings expectations, earnings uncertainty, and current debt burdens (Chen and Zhang,
1998; Fama and French, 1995). A low MTB ratio at the banking system level should thus coincide with high levels of systemic risk.
To additionally account for the banking system’s underlying profitability, credit risk, and liquidity risk, we include the following bank-specific control variables. Profitability is the ratio of net income over total assets. The variable proxies the financial institutions’
ability to generate profits efficiently throughout the business cycle. We employ the ratio of nonperforming loans (NPL) over total gross loans to control for the quality of the financial institutions’ on-balance-sheet credit exposures. A rise in NPL not only reduces current profits, but might also impede future credit lending due to an increase in risk aversion and binding regulatory capital constraints.
Lastly, we define loan-to-deposit (LTD) as total loans over total customer deposits and apply the latter to proxy for liquidity risk. A ratio of greater than one indicates that institutions are relying on (short-term) wholesale funding in addition to customer deposits in order to refinance loans. The resulting liquidity mismatch increases an institution’s dependence on capital-market-based funding. At the banking system level, a high LTD ratio may easily lead to an acute shortage of funding liquidity in times of crises.
For each of the previously outlined bank-specific variables we compute quarterly ag- gregate time series at the banking system level by consolidating the balance sheet data and market data (market valued equity) across all 84 sample banks.
7Macroeconomic variables
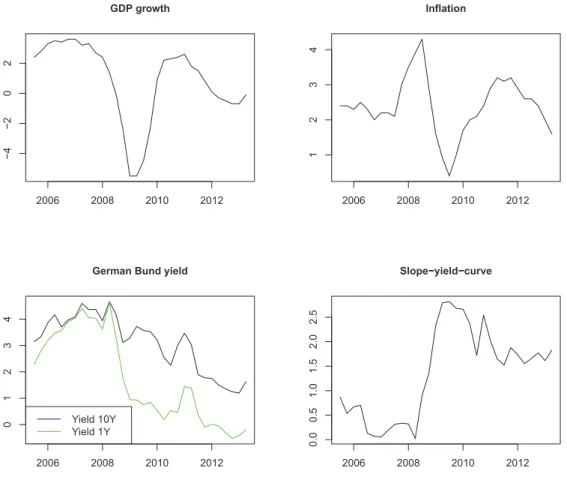
To be consistent with macroeconomic forecasting literature, we measure the state of the European Union’s real economy and its economic activity employing the variables pro- duction and real GDP.
Production represents the total industrial production excluding the construction sec- tor. By predominantly measuring current output levels, the macroeconomic variable thus serves as an ideal measure for economic activity. As a classic indicator of the economy’s overall state, real GDP is defined as nominal GDP deflated by the GDP deflator. In contrast to production, a country’s gross domestic product not only captures the market value of final goods but also the value of services produced within the economy. Thus, due to its definition that is much broader than production, we expect real GDP adjustments to be sluggish.
7
We collect aggregate harmonized time series data for NPL and the LTD ratio referring to the EU27
from the Worldbank and the EBF/EBA, respectively. Given the ratios’ sensitivity to accounting
standards, this approach minimizes the effects of differences in accounting definitions and thus allows
meaningful comparisons across time and countries.
2 S y st em ic ri sk m ea su re s a n d th ei r v ia b ili ty fo r b a n k in g su p er v is io n 19
Label Description Sampling
Data source frequency
Bank-specific variables
Leverage* market valued total assets / market valued equity, where
quarterly Datastream market valued total assets = book valued total debt + market valued equity
Z-score* roa
t+ car
t/sd (roa), where sd = standard deviation of the sample period,
quarterly Datastream car = capital asset ratio, and roa = return on equity
Market-to-book* market valued equity / book valued equity quarterly Datastream
Profitability* net income / book valued total assets (in %) quarterly Datastream
Nonperforming loans nonperforming loans / total gross loans (EU27, in %) annual Worldbank Loan-to-deposit total loans / total customer deposit (EU27, in %) quarterly/annual EBA/EBF Macroeconomic variables
Production EU Industrial Production Index excluding construction (EU27) monthly Datastream Real GDP real quarterly gross domestic product (EU27, in EUR bn ) quarterly Datastream Inflation Harmonized Index of Consumer Prices (HICP) (EU27, in %) monthly Datastream
Unemployment unemployment rate (EU28, in %) monthly Datastream
House prices EU House Price Index (EU evolving) quarterly Datastream
Credit private domestic credit to private sector (EU27, in % of GDP) annual Worldbank
Table 2.3 – Description of bank-specific and macroeconomic variables
The table shows the label, description, sampling frequency, and data source of the bank-specific and macroeconomic variables used in the regression
analysis. The time series of observations cover the period from July 2005 to June 2013. * The bank-specific variables leverage, Z-score, market-to-
book, and profitability represent quarterly time series for the aggregate of all 84 sample banks. We compute quarterly time series at the banking
system level for the latter by consolidating the balance sheet data and market data (market valued equity) across all sample banks.
We furthermore include a set of macroeconomic control variables. Inflation measures the steady increase in the general price level over time and acts as a proxy for a stable economy. Generally, a moderate inflation target is regarded as positive (Mundell, 1963;
Tobin, 1965). Higher inflation rates typically coincide with economic boosts and may dis- play signs of overheating. Contrary to that, low economic activity typically results in low inflation rates. Unemployment reflects the structural health of the economy. Lower levels of economic activity are associated with higher levels of unemployment, which became visible in the recent financial crises. In addition, unemployment rates are indicative for the propensity of future consumption spending.
Moreover, we use house prices to proxy for the state of the economy in two ways. First, the index simply measures the households’ wealth. Second, real estate is an important source of collateral that serves as a cushion for the losses from distressed debt. Finally, measured as a proportion of GDP, credit private is the total amount of domestic credit held by the private sector. We employ credit private to control for economic sustainability.
Table 2.3 provides a summary of all aggregated bank-specific and macroeconomic variables used in our subsequent analysis including their description, sampling frequency, and data source.
2.5 Empirical evidence
This section divides into three subsections. We commence with the investigation of the SRMs’ predictive power for the state of the banking system and the real economy in Section 2.5.1. Section 2.5.2 then investigates the determinants of the banking system’s overall level of systemic risk and Section 2.5.3 closes with critical remarks on SRMs.
2.5.1 SRMs’ predictive power
To be viable for the identification of systemic events and to be used as a tool for macro- prudential supervision, SRMs should possess predictive power for the state of the banking system and the real economy. Based on prominent working definitions of systemic risk, we formulated these prerequisites as assessment criteria.
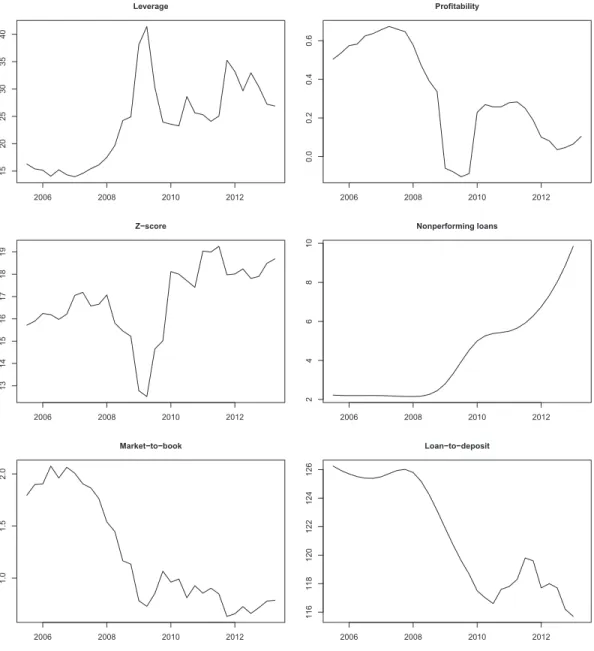
First of all, however, in order to develop an understanding about our explanatory
variables’ dynamics during the International Financial Crisis and European Sovereign
Debt Crisis, Figures 2.1 and 2.2 display the time series of the bank-specific and the
macroeconomic state variables that we apply in our regression analysis within the period
from July 2005 to June 2013.
2 Systemic risk measures and their viability for banking supervision 21
Leverage
2006 2008 2010 2012
152025303540
Z−score
2006 2008 2010 2012
13141516171819
Market−to−book
2006 2008 2010 2012
1.01.52.0
Profitability
2006 2008 2010 2012
0.00.20.40.6
Nonperforming loans
2006 2008 2010 2012
246810
Loan−to−deposit
2006 2008 2010 2012
116118120122124126