Cancer Medicine. 2020;9:1263–1275. wileyonlinelibrary.com/journal/cam4 | 1263
O R I G I N A L R E S E A R C H
Autoimmune diseases and immunosuppressive therapy in relation to the risk of glioma
Tareq M. Anssar 1 | Michael F. Leitzmann 2 | Ralf A. Linker 1 | Christoph Meier 3,4,5 |
Claudia Becker 3,5 | Susan Jick 4,6 | Katharina Sahm 7,8 | Michael Platten 7,8 |
Peter Hau 1 | Corinna Seliger 1,9
This is an open access article under the terms of the Creative Commons Attribution License, which permits use, distribution and reproduction in any medium, provided the original work is properly cited.
© 2019 The Authors. Cancer Medicine published by John Wiley & Sons Ltd.
1
Wilhelm Sander-NeuroOncology Unit and Department of Neurology, Regensburg University Hospital, Regensburg, Germany
2
Institute of Epidemiology and Preventive Medicine, Regensburg University Hospital, Regensburg, Germany
3
Basel Pharmacoepidemiology Unit, Division of Clinical Pharmacy and Epidemiology, Department of Pharmaceutical Sciences, University of Basel, Basel, Switzerland
4
Boston Collaborative Drug Surveillance Program, Lexington, United States
5
Hospital Pharmacy, University Hospital Basel, Basel, Switzerland
6
Boston University School of Public Health, Lexington, United States
7
Department of Neurology, Mannheim Medical Center, University of Heidelberg, Mannheim, Germany
8
DKTK CCU Neuroimmunology and Brain Tumor Immunology, German Cancer Research Center, Heidelberg, Germany
9
Department of Neurology, Heidelberg University Hospital, Heidelberg, Germany Correspondence
Tareq M. Anssar, Wilhelm Sander- NeuroOncology Unit and Department of Neurology, Regensburg University Hospital, Franz Josef Strauss-Allee 11, 93053 Regensburg, Germany.
Email: tareq.anssar@ukr.de Funding information Else Kröner-Fresenius-Stiftung
Abstract
Effectors from the immune system can modulate the course and possibly the early development of gliomas. We, therefore, hypothesized that autoimmune diseases as- sociated with increased immune-surveillance may also modulate the risk of human glioma. To test this hypothesis, we used data from the well-validated Clinical Practice Research Datalink (CPRD) GOLD from the UK to analyze the associa- tion of immune-related disorders or use of immunosuppressive drugs and the risk of glioma. We identified 3112 incident glioma cases diagnosed between 1995 and 2017.
We randomly selected up to 10 controls, matching them to glioma cases on age, sex, index date, general practice, and number of years of active history in the database prior to the index date. We performed conditional logistic regression analyses to es- timate Odds Ratios (ORs) of glioma among those exposed to allergies, autoimmune diseases, and immunosuppressive drugs. Overall, we found no materially altered as- sociation between a history of any autoimmune disease (OR 0.98, 95% CI 0.86-1.11), allergy (OR 0.97, 95% CI 0.89-1.05), or use of immunosuppressive drugs and the risk of glioma. However, subgroup analyses among younger patients found a statistically significant increased risk of glioma in patients with a history of inflammatory bowel disease (IBD) (OR 2.59, 95% CI 1.31-5.12). There was also an inverse association between asthma and risk of glioma in patients with longer survival (OR 0.73, 95%
CI 0.58-0.91) and between long-term duration diabetes and risk of glioma (OR 0.71, 95% CI 0.53-0.96).
K E Y W O R D S
autoimmune diseases, glioma, immunosuppressive therapies
1 | INTRODUCTION
Gliomas are primary brain tumours and glioblastoma is the most common type of glioma. 1 Despite standard therapy with resection, combined radio-chemotherapy, and adjuvant chemotherapy with tumor-treating fields, glioblastomas still have a median survival of only 20.9 months. 2 Ionizing radia- tion is the only known environmental factor associated with increased risk of brain tumors. 3
Current understanding indicates various interaction mech- anisms between the immune system and the central nervous system (CNS). Using specific lymphatic vessels, antigens and immune cells from the cerebral fluid drain into the deep cer- vical lymph nodes, thus interacting with the immune system. 4 Furthermore, in diseases such as autoimmune encephalitis, neurodegenerative diseases, and brain tumors, immune cells from the blood migrate to the CNS. 5-7 Antigen-presenting cells are predominantly located in perivascular spaces, allow- ing T-cell reactivation 8 which subsequently triggers immuno- logical events.
Despite good response rates to immunotherapy in a couple of solid tumor entities such as lung cancer or mel- anoma, 9,10 introduction of these therapeutics in neuro-on- cology has not yet improved survival in glioblastoma. 11 Therefore, further understanding of tumor biology and mechanisms of immune modulation in glioblastoma is crucial for the development of new immunotherapeutic approaches.
Autoimmune diseases (AD) are typically character- ized by the presence of autoreactive immune cells and the production of autoantibodies. 12 However, T-cells exert distinct effects in glioma and autoimmune disease.
In contrast to multiple sclerosis, regulatory T-cell (Treg) function is preserved in glioma and thus, Tregs are able to maintain peripheral tolerance in patients with glioma. 13 This raises the question of whether the activated immune system in autoimmune disorders may be able to induce an immune-response against transformed glioma cells that show “foreign” epitopes on their surface, 14 which could translate into a preventive effect against glioma develop- ment and a decreased incidence of gliomas in patients with history of AD.
A number of studies have investigated the risk of brain tu- mors in relation to immune-related conditions. Several stud- ies observed a reduced risk of glioma in patients with history of allergies 15-21 and autoimmune diseases, 15,22 while others found no significant associations. 16,23-25
In order to provide more data on these questions, we conducted a comprehensive examination of immune-re- lated disorders and intake of immunosuppressive drugs with regard to glioma risk, using primary-care data from the UK
2 | MATERIALS AND METHODS 2.1 | Data source
The Clinical Practice Research Datalink (CPRD) GOLD is a large longitudinal database, which encompasses patient information on over 11 million patients from around 670 general practices representative of the UK population with respect to sex, age, and ethnicity. The CPRD GOLD in- cludes medical records on over 11 million patients with ac- ceptable quality for research based on data quality checks. 26 The validity of information in the CPRD GOLD has been thoroughly documented and found to be of high quality for research purposes. 26,27
We received approval from the Independent Scientific Advisory Committee for Medicines and Healthcare products Regulatory Agency database research (ISAC, protocol num- ber 16_158R). The study protocol was made available for reviewers/editors.
Data for this study were derived from CPRD primary care data obtained under license from the UK Medicines and Healthcare products Regulatory Agency. The data are pro- vided by patients and collected by the NHS as part of their care and support. The interpretation and conclusions con- tained in this study are those of the authors alone.
2.2 | Study population 2.2.1 | Cases
As described previously 28-30 we used medical READ codes to identify cases. We defined cases as patients under 90 years of age, with newly diagnosed, incident glioma between 1995 and 2017. We defined the date of the first diagnosis of glioma minus 1 year as “index date”. We implemented this 1 year shift backwards in time in order to account for potential treat- ment of early symptoms during glioma development and be- fore diagnosis.
We applied the same other inclusion and exclusion crite- ria as in our previous glioma studies, which are described in detail there. 28-30
2.2.2 | Controls
The selection of controls is analogous to our previous gli-
oma studies. We randomly selected up to 10 controls with-
out a history of glioma in the CPRD and matched them to
glioma cases on age, sex, index date, general practice, and
number of years of active history in the CPRD prior to the
index date.
We applied the same exclusion criteria to controls as to cases and additionally excluded controls with a recent (1 year before index date) craniotomy as some of these patients might have an unrecorded glioma diagnosis.
2.2.3 | Exposures
The exposures of interest in this study were AD and other immune-related disorders identified from CPRD electronic records: The autoimmune diseases included were inflamma- tory bowel diseases (not specified, Crohn's disease, ulcerative colitis), Addison's disease, allergic enterocolitis, ankylosing spondylitis, antiphospholipid syndrome, autoimmune hemo- lytic purpura, different forms of vasculitis (including aller- gic purpura, Behcet's disease, Goodpasture syndrome, Churg Strauss disease, cryoglobulinaemic vasculitis, Takayasu ar- teritis, polyarteritis nodosa, microscopic polyangiitis, giant cell arteritis, granulomatosis with polyangiitis, other vascu- litis), autoimmune connective tissue diseases (lupus erythe- matodes, scleroderma, Sjogren's syndrome), thyroid gland diseases (autoimmune parathyroiditis, chronic thyroiditis, Grave's disease, Hashimoto's disease, other thyroiditis), bil- iary cirrhosis, chronic gastritis, Guillain Barré Bannwarth syndrome, coeliac disease, Jaccoud arthropathy, juvenile pemphigoid, myasthenia gravis, microscopic colitis, pem- phigus, pernicious anemia, sarcoidosis, polymyalgia rheu- matica, multiple sclerosis, psoriasis, rheumatic fever, Reiter's disease, thrombocytopenic purpura, type I diabetes, vitiligo, and rheumatoid arthritis (RA). Allergies in general were in- cluded as a single variable in our analysis. We also investi- gated associations between asthma, dermatitis, hay fever or other specific allergies and the risk of glioma separately.
We explored autoimmune diseases as a single variable, and separately for each specific disease entity. We also evaluated combined variables for inflammatory bowel diseases, thyroid gland diseases, vasculitis, and autoim- mune connective tissue diseases due to limitations of small numbers.
We further defined a single variable for T-cell mediated diseases, which included Addison's disease, Crohn's disease, multiple sclerosis, RA, coeliac disease, Hashimoto's disease, psoriasis, type I diabetes, and sarcoidosis. We considered a patient exposed to one of the above diseases if she or he had at least one Read code for that disease recorded before the index date. Using the first listed Read code for each dis- ease we calculated disease duration as the interval between the first record of each AD and the index date, and we cat- egorized duration as short, intermediate or long (<5, 5-10,
>10 years).
We also assessed exposure to immunosuppressive drugs that are frequently used to treat autoimmune diseases (systemic corticosteroids, inhaled corticosteroids, topical
corticosteroids, mesalazine/5-ASA, azathioprine, mercapto- purine, methotrexate, anti-TNF therapy, calcineurin inhibi- tors, interleukin inhibitors, other immunosuppressants). We defined patients who received no prescription for the drugs in question as nonusers (reference). We categorized expo- sure to immunosuppressive drugs based on the number of prescriptions of corticosteroids (0, 1-4, 5-9, ≥10) or other immunosuppressive drugs (0, 1-19, ≥20) before the index date.
2.3 | Statistical analyses
We conducted conditional logistic regression analyses to cal- culate odds ratios (ORs) with 95% confidence intervals (CIs) of glioma for exposure to autoimmune diseases, by duration of the disease and for the use of immunosuppressive drugs.
We used SAS version 9.4 (SAS Institute Inc) to conduct all analyses.
We evaluated the following covariates as potential con- founders: smoking status (unknown, current, past, never), body mass index (unknown, <18.5, 18.5-24.9, 25.0-29.9,
>30.0 kg/m 2 ), use of NSAIDs (none, 1-9 prescriptions, ≥10 prescriptions), statins (none, 1-9 prescriptions, ≥10 pre- scriptions), and estrogens (none, 1-9 prescriptions, ≥10 pre- scriptions). We only included variables that altered the risk of glioma by >10% in the final multivariate analyses. We performed subgroup analyses after stratification by glioma subtype, age, and sex.
We also tested linear trends of autoimmune disease duration and prescriptions of immunosuppressive drugs using a Wald test analogous to our previous descrip- tions. 29,30 When we investigated specific autoimmune diseases, we corrected for multiple testing controlling the False Discovery Rate at 5% according to the Benjamini- Hochberg procedure. 31
3 | RESULTS
3.1 | Basic characteristics of cases and controls
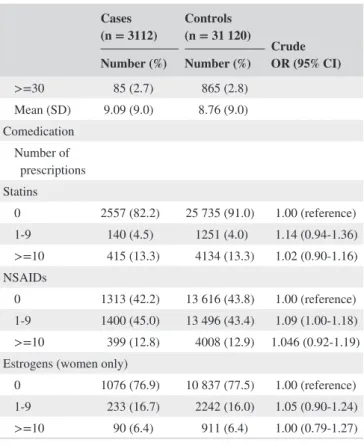
We identified 3112 patients with incident glioma and 31 120 matched controls who met the inclusion criteria. Mean (SD) length of history in the database before the index date was 11.6 years (±5.6 years). On average, there were 9.1 practice visits per year in cases and 8.8 in controls. See Table 1 for information on basic characteristics of cases and controls are.
We do not display cell sizes less than 5 in compliance with CPRD guidelines.
There were more male than female cases (55.0% male and
45.0% female), and the mean age was 54.7 years. There were
646 cases (20.8%) with lower grade glioma (WHO grade I/II/
III), 1348 cases (43.3%) with glioblastoma (WHO grade IV), and 1118 cases (35.9%) with glioma that was not further specified.
In univariate analyses, low BMI (underweight) was inversely associated (OR 0.36; 95% CI 0.21-0.62) to the risk of glioma compared to normal weight. Being a current smoker (OR 0.84, 95% CI 0.75-0.94) was also associated with a reduced risk of glioma compared to nonsmokers.
Heart failure (OR 0.56, 95% CI 0.38-0.81) and past myo- cardial infarction (OR 0.77, 95% CI 0.61-0.97) were in- versely associated to the incidence of glioma, whereas a history of stroke, chronic obstructive pulmonary disease, hyperlipidemia, deep vein thrombosis, coronary heart dis- ease, gout, and renal disease were not associated with an altered OR. Comedication with statins, NSAIDs, or estro- gens (women only) also showed no significant relation to glioma risk. When we stratified by sex, congestive heart failure was associated with a reduced risk in male patients (OR 0.54, 95% CI 0.33-0.88). In female patients with gli- oma, deep vein thrombosis was observed more often than in controls (OR 1.65, 95% CI 1.14-2.37). See Table 1 for details.
TABLE 1 Demographic characteristics in cases and controls
Cases
(n = 3112) Controls (n = 31 120)
Crude OR (95% CI) Number (%) Number (%)
Sex
Male 1713 (55.0) 17 130 (55.0)
Female 1399 (45.0) 13 990 (45.0)
Age class
0-39 620 (19.9) 6194 (19.9)
40-59 1011 (32.5) 10 093 (32.4)
>=60 1481 (47.6) 14 833 (47.7) Mean age (y)
Mean (SD) 54.7 (19.4) 54.7 (19.4) Length of history before index date (y)
Mean (SD) 11.6 (5.6) 11.6 (5.6)
BMI (kg/m
2)
<18.5 14 (0.5) 376 (1.2) 0.36 (0.21-0.62) 18.5-24.9 907 (29.2) 8815 (28.3) 1.00 (reference) 25-29.9 927 (29.8) 8986 (28.9) 1.01 (0.91-1.11)
>=30 532 (17.1) 5217 (16.8) 1.00 (0.89-1.12) Unknown 732 (23.5) 7726 (24.8) 0.88 (0.78-1.00) Smoking status
Smoker 472 (15.2) 5172 (16.6) 0.84 (0.75-0.94) Past smoker 738 (23.7) 7380 (23.7) 0.94 (0.85-1.03) Non-smoker 1482 (47.6) 13 781 (44.3) 1.00 (reference) Unknown 420 (13.5) 4787 (15.4) 0.71 (0.61-0.83) Glioma subtype
Lower grade glioma WHO
° I/II/III
646 (20.7) 6460 (20.8)
Glioblastoma
WHO ° IV 1348 (43.3) 13 480 (43.3) Not specified 1118 (35.9) 11 180 (35.9) Comorbidities
CHF 29 (0.9) 508 (1.6) 0.56 (0.38-0.81)
MI 82 (2.6) 1048 (3.4) 0.77 (0.61-0.97)
Stroke 105 (3.4) 1182 (3.8) 0.88 (0.72-1.08)
IHD 225 (7.2) 2392 (7.7) 0.93 (0.80-1.08)
Hyperlipidemia 305 (9.8) 3306 (10.6) 0.90 (0.79-1.03)
DVT 58 (1.9) 460 (1.5) 1.27 (0.96-1.67)
Gout 101 (3.3) 1133 (3.6) 0.88 (0.72-1.09) Renal disease 85 (2.7) 778 (2.5) 1.10 (0.87-1.38)
COPD 73 (2.4) 881 (2.8) 0.82 (0.64-1.05)
Number of practice visits
0-9 2159 (69.4) 22 473 (72.2)
20-29 204 (6.6) 1744 (5.6)
(Continues)
Cases
(n = 3112) Controls (n = 31 120)
Crude OR (95% CI) Number (%) Number (%)
>=30 85 (2.7) 865 (2.8)
Mean (SD) 9.09 (9.0) 8.76 (9.0)
Comedication Number of
prescriptions
Statins
0 2557 (82.2) 25 735 (91.0) 1.00 (reference)
1-9 140 (4.5) 1251 (4.0) 1.14 (0.94-1.36)
>=10 415 (13.3) 4134 (13.3) 1.02 (0.90-1.16) NSAIDs
0 1313 (42.2) 13 616 (43.8) 1.00 (reference) 1-9 1400 (45.0) 13 496 (43.4) 1.09 (1.00-1.18)
>=10 399 (12.8) 4008 (12.9) 1.046 (0.92-1.19) Estrogens (women only)
0 1076 (76.9) 10 837 (77.5) 1.00 (reference) 1-9 233 (16.7) 2242 (16.0) 1.05 (0.90-1.24)
>=10 90 (6.4) 911 (6.4) 1.00 (0.79-1.27) Note: Bold indicates significant value (P < .05).
Matching variables: calendar time (same index date), age (same year of birth), sex, general practice, and number of years of active history in the database prior to the index date.
Abbreviations: BMI, body mass index; CHF, congestive heart failure; CI, confi- dence interval; COPD, chronic obstructive pulmonary disease; DVT, deep vein thrombosis; IHD, ischemic heart disease; MI, myocardial infarction; NSAIDs, nonsteroidal anti-inflammatory drugs; OR, odds ratio; SD, standard deviation.
TABLE 1 (Continued)
3.2 | Multivariate models 3.2.1 | Autoimmune diseases
We observed 282 (9.06%) cases with a recorded history of any autoimmune disease. There was no association between patients with any “autoimmune disease” and glioma risk (OR 0.98, 95% CI 0.86-1.11). We also investigated combined variables for any inflammatory bowel disease (OR 1.28, 95%
CI 0.95-1.71), any autoimmune connective tissue disease (OR 1.10, 95% CI 0.50-2.41), any thyroid gland disease (OR 1.15, 95% CI 0.59-2.21), and any vasculitis (OR 1.07, 95%
CI 0.79-1.47), none of which were associated with risk of glioma.
When we analyzed the data for the various autoimmune diseases separately (Table 2), none of them were related to an altered risk of glioma. There were also no statistically signif- icant associations between Crohn's disease (OR 0.96, 95% CI 0.48-1.90), ulcerative colitis (OR 1.27, 95% CI 0.85-1.88), or inflammatory bowel disease not further specified (OR 1.27, 95% CI 0.81-1.98), and the risk of glioma. A statistically nonsignificant reduced risk of glioma of >20% was observed for type I diabetes, rheumatic fever, sarcoidosis, and coeliac disease. We observed a statistically nonsignificant increased risk for pernicious anemia, Hashimoto, Sjogren's syndrome, and vitiligo (Table 2).
Upon stratification by sex, we observed no divergent re- sults between males and females (data not shown).
3.2.2 | Allergies
Of all patients with glioma, 1219 (39.17%) had a history of some allergic condition (Table 2). We observed no altered glioma risk among patients with “any allergy” (OR 0.97, 95%
CI 0.89-1.05) or with any of the specific allergic conditions.
3.2.3 | Glioma subtypes
We also analyzed the different glioma subtypes separately to see if the results differed according to type (Table 3). For methodologic reasons (Read Codes do not always differenti- ate well between WHO grade I, II, and III glioma), we distin- guished between grades I/II/III (lower grade) and grade IV glioma.
In WHO grades I/II/III gliomas, IBD and specifically ulcerative colitis, were the only exposures that were asso- ciated with statistically significantly increased ORs for gli- oma (OR 2.15, 95% CI 1.17-3.96 for IBD, and OR 2.56, 95%
CI 1.22-5.37 for ulcerative colitis). When we took multiple testing into account, the results were no longer statistically significant.
TABLE 2 Risk of glioma in patients with immune-related disorders and autoimmune diseases
Cases
(n = 3112) Controls (n = 31 120)
Adjusted OR (95% CI) Number (%) Number (%)
Immune-related disorders
Diabetes 204 (5.6) 2295 (7.4) 0.86 (0.73-1.00) Allergies
Any allergy
a1219 (39.2) 12 291 (39.5) 0.97 (0.89-1.05) Asthma 342 (11.0) 3621 (11.6) 0.91 (0.81-1.03) Dermatitis 828 (26.6) 8093 (26.0) 1.02 (0.94-1.11) Hay fever 299 (9.6) 2843 (9.1) 1.04 (0.91-1.18) Other allergies 157 (5.0) 1660 (5.3) 0.93 (0.78-1.10) Autoimmune diseases
Any autoimmune
disease 282 (9.1) 2871 (9.2) 0.98 (0.86-1.11) Other combined variables
T-cell mediated 190 (6.1) 2113 (6.8) 0.89 (0.76-1.04) Connective tissue
disease 7 (0.2) 63 (0.2) 1.10 (0.50-2.41)
IBD 52 (1.7) 406 (1.3) 1.28 (0.95-1.71)
Thyroid gland
diseases 10 (0.3) 87 (0.3) 1.15 (0.59-2.21) Vasculitis—any
(including PMR) 46 (1.5) 423 (1.4) 1.07 (0.79-1.47) Vasculitis (without
PMR) 11 (0.4) 135 (0.4) 0.81 (0.44-1.49)
Specific autoimmune diseases Ankylosing
spondylitis 8 (0.3) 71 (0.2) 1.12 (0.54-2.33) Coeliac disease 6 (0.2) 82 (0.3) 0.73 (0.32-1.67) Crohn's disease 9 (0.3) 93 (0.3) 0.96 (0.48-1.90) Diabetes type I 5 (0.2) 82 (0.3) 0.59 (0.24-1.46) Hashimoto 5 (0.2) 22 (0.1) 2.30 (0.87-6.09) IBD-not specified 22 (0.7) 175 (0.6) 1.27 (0.81-1.98) Multiple sclerosis 9 (0.3) 85 (0.3) 1.06 (0.53-2.11) Pernicious anemia 15 (0.5) 104 (0.3) 1.46 (0.85-2.52)
PMR 35 (1.1) 288 (0.9) 1.20 (0.84-1.72)
Psoriasis 104 (3.3) 1136 (3.7) 0.92 (0.75-1.13) Rheumatic fever 5 (0.2) 75 (0.2) 0.66 (0.27-1.63)
RA 53 (1.7) 596 (1.9) 0.89 (0.67-1.18)
Sarcoidosis 6 (0.2) 81 (0.3) 0.72 (0.31-1.65) Sjogren's syndrome 5 (0.2) 31 (0.1) 1.54 (0.60-3.99) Ulcerative colitis 28 (0.9) 218 (0.7) 1.27 (0.85-1.88) Vitiligo 11 (0.4) 82 (0.3) 1.31 (0.70-2.46) Note: Adjusted for: smoking and BMI.
Matching variables: calendar time (same index date), age (same year of birth), sex, general practice, and number of years of active history in the database prior to the index date.
Abbreviations: CI, confidence interval; IBD, inflammatory bowel disease; OR, odds ratio; PMR, polymyalgia rheumatica; RA, rheumatoid arthritis.
a