Genetic and Proteomic Basis of Abiotic Stress Responses in Barley (Hordeum vulgare)
Inaugural‐Dissertation Zur
Erlangung des Doktorgrades
der Mathematisch‐Naturwissenschaftlichen Fakultät der Universität zu Köln
vorgelegt von
JAROD ROLLINS
aus Waterville, Maine Vereinigte Staaten von Amerika
Köln, 2012
Die vorliegende Arbeit wurde am Max-Planck-Institut für Pflanzenzüchtungsforschung in Köln in der Abteilung für Entwicklungsbiologie der Pflanzen (Direktor: Prof. Dr. G. Coupland) angefertigt.
Prüfungsvorsitzender: Prof. Dr. Martin Hülskamp
Berichterstatter: Prof. Dr. George Coupland Prof. Dr. Ute Höcker
Prüfungsdatum : Oktober 11th 2012
Abstract
Drought and heat stress are the two leading abiotic stresses that limit crop productivity. Understanding the range of responses that a model crop like barley can exhibit in different environments to avoid or tolerate stress will be crucial in unraveling the basis of abiotic stress resistance. The objectives of the present study were to identify i) morphological and physiological traits associated with abiotic stress resistance, ii) genetic loci linked to agronomic performance traits under drought, and iii) proteins differentially regulated in response to heat and drought stress.
A barley recombinant inbred line population derived from a cross between the Syrian landrace Arta and the Australian cultivar Keel was grown in a greenhouse under well watered conditions and subjected to drought treatment that began at anthesis and persisted until maturity. Using genotyping data from over 700 genetic markers, a multi‐environmental quantitative trait loci (QTL) analysis of morphological and physiological traits was performed. For the proteomic analysis, Arta and Keel were grown in a growth chamber under well watered conditions and subjected to drought, high temperature, or a combination of both treatments starting at anthesis. The leaf proteome of Arta and Keel were visualized and changes in protein spot abundance due to the stress treatments were quantified using difference gel electrophoresis (DIGE). Mass spectrometry was used to identify protein spots excised from the gels.
The drought treatment was characterized by morphological plasticity and stability on the physiological and proteomic level. In contrast, the heat treatment caused perturbations on the physiological and proteomic level which were more prominent than the morphological responses that occurred. The QTL analysis revealed nineteen loci for traits associated with agronomic and physiological performance under drought. The proteomic analysis identified 99 protein spots differentially regulated in response to the heat treatment, 14 of which were regulated in a genotype specific manner. Differentially regulated proteins with potential roles in the observed morphological and physiological changes under heat stress included photosynthetic proteins Rusbisco activase B and chlorophyll a‐b binding proteins in addition to the glycolytic enzymes fructose‐bisphosphate aldolase and glyceraldehyde‐3‐phosphate dehydrogenase. Of the stress responsive traits, significant differences in plant height, spike fertility, and photosynthetic performance were detected between Arta and Keel. Altogether, the detection of genetic variation in traits responsive to abiotic stress and in protein abundance represent unique stress adaption mechanisms which can be exploited in future crop breeding efforts.
Zusammenfassung
Trockenheit und Hitze sind die zwei führenden abiotischen Stressfaktoren, die sich limitierend auf den Ernteertrag auswirken. Ein Verständnis davon welche umfangreichen Reaktionen eine
Modelpflanze wie Gerste – wenn unterschiedlichen Umweltbedingungen ausgesetzt – aufweisen kann, um Stressfaktoren zu umgehen, beziehungsweise zu tolerieren, wäre entscheidend bei der Aufklärung abiotischer tressresistenz. Die Zielsetzung der vorliegenden Arbeit war die Identifizierung von i) morphologische und physiologische Reaktionen auf Stress durch Hitze und Trockenheit, ii) genetischen Loci, welche mit agronomischen Merkmalen bezüglich der Ertragsleistung unter trockenen Bedingungen, verbunden sind und iii) Proteinen, die als Reaktion auf Hitze und Trockenheit unterschiedlich reguliert werden.
Eine durch rekombinante Zucht erzeugte Gerstensorte, die eine Kreuzung aus der syrischen Landgerste Arta und der australischen Sorte Keel ist, wurde in einem Gewächshaus unter guten
Bewässerungsbedingungen gewachsen, und anschließend einer Trockenheitsbehandlung, beginnend mit der Anthesis und die bis zur Reife anhielt, unterzogen. Unter Verwendung von genotypischen Daten von über 700 genetischen Markern wurde eine Multi‐umweltbedingte‐Merkmal‐Loci Analyse (engl.: multi‐
environmental quantitative trait loci (QTL)) morphologischer und physiologischer Merkmale durchgeführt. Für die proteomische Analyse wurden die parentalen Linien Arta und Keel in einem Gewächshaus unter guten Bewässerungsbedingungen gewachsen und mit der Anthesis startend folgenden Bedingungen ausgesetzt: Trockenheit, erhöhten Temperaturen, oder einer Kombination dieser beiden Bedingungen. Das Blattproteom von Arta und Keel wurde visualisiert, und mittles 2D‐
Gelelektrophorese (engl.: difference gel electrophoresis (DIGE)) wurde eine Änderung in der Menge an Proteinflecken (protein spots) aufgrund der Stressbehandlungen quantifiziert. Für die Identifizierung der aus den Gelen herausgeschnittenen Proteinflecken wurde Massenspektronomie genutzt.
Die Trockenheitsbehandlung war durch morphologische Plastizität und einer Beständigkeit auf physiologischer und proteomischer Ebene charakterisiert. Im Gegensatz dazu hatte eine
Hitzebehandlung einen markanteren Störeinfluss auf die Pflanzenphysiologie und Proteinanreicherung als auf die Morphologie. Die QTL Analysen ließen 19 Loci erkennen für Merkmale, die mit einer
agronomischen und physiologischen Leistung in Zusammenhang stehen. Durch die Proteomanalyse der parentalen Linien ließen sich 99 Proteine (Proteinflecken) identifizieren, die als Reaktion auf die
Hitzebehandlung unterschiedlich reguliert wurden, 14 davon wurden in Abhängigkeit des Genotyps unterschiedlich reguliert. Der Großteil dieser unterschiedlich regulierten Proteine spielt eine Rolle im Stoffwechsel und der Photosynthese. Unterschiedlich regulierte Proteine mit möglichen Funktionen
verantwortlich für die beobachteten morphologischen und physiologischen Veränderungen als Reaktion auf Hitzebehandlung, schließen photosynthetische Proteine Rusbisco Aktivase B, Chlorophyll a‐b
bindende Proteine, als auch Glykolytische Enzyme wie Fructosebiphosphataldolase und Glyceraldehyd‐3‐
Phosphatdehydrogenase ein. Einige Merkmale, die Stressabhängig zu sein scheinen, wie z.B.
Pflanzengröße, Fertilität der Ähren und die photosynthetische Leistung, haben sich zwischen den zwei Genotypen unter Stressbehandlung deutlich unterschieden. Zusammenfassend erlaubt eine Erkennung der genetischen Variationen dieser stressabhängigen Merkmale sowie der Häufigkeit an Proteinen, dass diese Eigenschaften für spätere Züchtungen ausgenutzt werden.
Table of contents
Chapter One ‐ QTL Analysis of Agronomic Traits in Barley Under Water Limited Conditions ... 1
Introduction ... 1
Barley is a model crop with worldwide agricultural importance ... 1
Molecular responses to drought ... 2
Quantitative trait loci for drought resistance ... 4
Development dependent responses to drought ... 5
Materials and methods ... 6
Experimental overview ... 6
Plant material ... 6
Drought treatment ... 7
Physiological measurements ... 8
Morphological and agronomic measurements ... 8
Statistical analysis ... 9
Linkage mapping ... 9
Quantitative trait loci analysis ... 10
Results ... 10
Robustness of barley physiology despite drought ... 10
Reduction in grain yield and yield components due to drought stress ... 12
Evaluation of agronomic traits under drought stress ... 15
Phenotypic variation of traits due to genotype and drought conditions ... 16
Genetic correlations of traits to yield under control and drought conditions ... 17
QTL for agronomic traits ... 18
Discussion ... 23
Reduction of growth and yield in the absence of physiological stress ... 23
Genotype specific environmental responses ... 24
Clustering of QTL ... 25
Confirmed and novel QTL ... 26
Conclusion ... 28
Chapter Two ‐ Leaf Proteome Analysis of Barley Subjected to Drought and Heat Stress ... 30
Introduction ... 30
Molecular responses to abiotic stress ... 31
Quantitative proteomics ... 32
Materials and Methods ... 34
Experimental overview ... 34
Plant material ... 34
Drought and heat treatments ... 34
Physiological measurements ... 35
Morphological and agronomic measurements ... 36
Protein extraction ... 37
Fluorescent labeling of proteins ... 37
Two dimensional gel electrophoresis ... 38
Colloidal Coomassie Brilliant Blue staining ... 39
Gel image analysis ... 39
Protein identification ... 39
Annotation of identified proteins with gene ontology terms ... 40
Singular Enrichment Analysis ... 41
Statistical analysis ... 41
Results ... 42
Single and combined effects of drought and heat treatments on physiological traits over time ... 42
Single and combined effects of drought and heat stress on morphological traits ... 47
Phenotypic variation of traits due to main and interacting effects of the genotype and treatments 53 Phenotypic correlation of traits to grain yield under control and high temperature treatments ... 55
Mapping and characterization of the barley leaf proteome ... 56
Quantification of differentially expressed proteins ... 57
Differential regulation of proteins in response to heat treatments ... 60
Differential protein expression due to genotype ... 63
Interacting effects of genotype and heat on protein abundance ... 65
Discussion ... 67
Morphological traits were more plastic under drought than under high temperature ... 67
Physiological traits were negatively impacted by heat stress but not drought stress ... 72
Barley genotypes Arta and Keel respond uniquely to heat and drought treatments ... 75
Proteomic basis of morphological plasticity and physiological responses to heat stress ... 77
Conclusion ... 83
Tables ... 85
References ... 95
Appendix ... 107
Abbreviations ... 107
Acknowledgements ... 109
Erklärung ... 110
Lebenslauf ... 112
1
Chapter One QTL Analysis of Agronomic Traits in Barley Under Water Limited Conditions
Introduction
As the world population grows and weather patterns become more unpredictable, the limitation of water available for agriculture will have an increasingly larger impact on the world’s food supply [1]. To combat this problem is necessary to develop crops that are more resistance to drought. Drought resistance is the ability of a plant to maintain yield despite limitations in available water. The ability to maintain yield is achieved by plant responses to drought on the morphological, physiological and molecular level. The occurrence of drought is made complex by variations in its severity, duration, and timing [2]. Thus, the responses to drought are accordingly complex.
To date, studies concerned with the molecular basis of the complex responses to drought have been primarily performed in Arabidopsis (Arabidopsis thaliana). Such work has partially uncovered responses to drought and the signaling pathways that invoke them. Unfortunately, the majority of research in Arabidopsis has been limited to severe drought stress being applied in the early stages of plant development [3], which only simulates a portion of the stress that crops experience in the field.
Additionally, Arabidopsis is not considered a drought tolerant species [4] and may lack the response mechanisms to drought that tolerant species employ. However, barley (Hordeum vulgare) is a genetically diverse species adapted to marginal, drought prone, agricultural areas as well as temperate, favorable environments. In comparison to the work in Arabidopsis, our understanding of the genetic basis of drought resistance in barley is lagging behind.
Barley is a drought resistant model crop with established genomic resources that make it suitable for studies concerned with the genetic basis of drought tolerance. Quantitative trait loci (QTL) analysis has been used successfully in Arabidopsis [5] and rice [6] to locate genes participating in the drought response. QTL analysis has also been made possible in barley by the development of segregating populations and recombination maps. A QTL analysis of traits responsive to water limited conditions during anthesis will allow the genetic basis of drought resistance to be further unraveled.
Barley is a model crop with worldwide agricultural importance
Barley originated in the steep ecoclines of the Fertile Crescent where it was under a variety of selection pressures for thousands of years. Since its origin, wild barley (Hordeum spontaneum) has been
domesticated into numerous landraces due to selection for agronomic traits and has given rise to various
elite cultivars as a result of modern breeding programs. Barley is the fourth most important cereal crop, after maize, rice and wheat in terms of world production. In the year 2010, 123.4 million tons of barley were harvested worldwide from an area totaling 47.8 million hectares [7]. Top world producers of barley in 2010 were Russia (17.8 million tons), Germany (11.8 million tons), and Canada (11.6 million tons) [7].
The majority (~66%) of barley produced worldwide is used for animal feed and a small portion (2%) is used in the production of food stuffs for human consumption while the rest (~32%) is used for malt in the production of fermented beverages [8]. Additional to the agricultural importance of barley is the value of barley as a genetic model for other crops.
The value of barley as a model crop also lies in the genomic tools and research that have been established for it. The barley genome is diploid with seven pairs of chromosomes designated 1H to 7H with an estimated size of 5.1 Gbp [9]. Attempts to sequence the entire genome of barley have been initiated [10][11] and a gene‐based marker map of the barley genome has been completed [12].
Comparison of barley gene sequences and gene order to rice, sorghum and Brachypodium revealed high collinearity between the four genomes [13] and the comparison will aid in future efforts to assemble the complete genome of barley and more complex genomes such as wheat. In addition to the genomic tools available, microarrays for barley gene expression have been established based on a library consisting of 350,000 high‐quality ESTs [14]. Reverse genetics approaches to discovering gene function are also possible in barley thanks to the development of Targeting Induced Local Lesions in Genomes (TILLING) populations [15]. Despite the size and complexity of the barley genome, the above resources combined with the genetic diversity of barley make this species an ideal model for use in abiotic stress research.
Molecular responses to drought
Drought resistance mechanisms can be divided into escape, avoidance and tolerance. Drought escape is the completion of the life cycle before water deficits occur. An example of drought escape would be the completion of flowering and grain filling before the onset of seasonal drought. Drought avoidance is the ability of a plant to maintain a high water status despite experiencing water limited conditions. Drought avoidance mechanisms include: stomatal closure, inhibition of shoot growth, promotion of root growth, and the accumulation of osmolytes [16]. Drought tolerance is the ability to maintain cellular activity despite a decrease in water status. Drought tolerance mechanisms include the increased production of free radical scavengers, protein protecting molecular chaperones, and proteases [4].
One of the most immediate drought avoidance responses to water limitation is the closure of the stomata to reduce transpiration and avoid dehydration. Stomata closure is mediated by the hormone abscisic acid (ABA) in a pathway recently characterized thanks to the discovery of the PYR/PRL family of
3 ABA receptors. In brief, binding of ABA to the PYR/PRL receptor allows the receptor/ligand complex to inhibit the phosphatase PP2C which would otherwise dephosphorylate and inhibit the kinase SnRK2.6 [17]. Thus, in the presence of ABA, SnRK2.6 is free to phosphorylate and activate the anion channel protein SLAC1 found in guard cells. Once active, SLAC1 regulates the efflux of anions into the apoplast of guard cells resulting in membrane depolarization and subsequent stomata closure [18]. Drought
avoidance can also occur through a reduction in the growth rate of leaves and stems as the plant acclimates to water limited conditions. A reduction in the leaf cell number and cell size has been observed in Arabidopsis plants under osmotic stress [19][20]. However, despite the inhibition of above ground growth, roots can continue to elongate despite inhibition of shoot growth [21] in an attempt to access more soil water.
Maintaining a water potential more negative than that of the surrounding soil is crucial for the continued uptake of water into the plant. The accumulation of compatible solutes under drought helps maintain the positive water flow into the plant by reducing the water potential of the cell. Compatible solutes increase the osmolarity in the cell without disturbing ionic interactions and include amino acids (e.g. proline), quaternary amines (e.g. glycine and betaine) and polyols (e.g. mannitol and sorbitol) [22].
In addition to playing a role in drought avoidance, compatible solutes can assist in drought tolerance by acting as free radical scavengers [23] and chemical chaperones [24].
When attempts to avoid drought fail, the plant is left to tolerate the effects of the stress. Two of the major sources of damage during drought stress come from reactive oxygen species and misfolded proteins. Reactive oxygen species (ROS) such as super oxide anion, hydroxyl and singlet oxygen, are primarily formed due to the improper flow of energy during light harvesting [25][26] or due to oxidation of photorespiration products during the light‐independent reactions of photosynthesis [27]. Drought increases the production of ROS mainly through the limitation of available carbon dioxide as a final electron acceptor [28][29]. Once formed, ROS may oxidize and damage components crucial for cellular function such as proteins, membrane lipids, and nucleotides [30]. Prevention of damage by ROS is accomplished by the production of enzymatic and non‐enzymatic antioxidants which can scavenge ROS by converting them into less reactive forms. Scavenging is performed in part through the action of the enzymes superoxide dismutase, ascorbate peroxidase, glutathione reductase and catalase [22] as well as by the above mentioned compatible solutes. Despite an increase in ROS scavenging drought stress can still result in the damage of proteins which can cause them to denature and aggregate.
Misfolding of proteins during drought can occur due to low cellular water content in addition to damage by ROS. Low cellular water content can lead a to a smaller cytoplasmic volume which results in increased interactions between proteins and a of lack water molecules to form hydration shells around
proteins necessary to maintain proper folding and stability [31]. While some compatible solutes can temporally replace water in providing a hydration shell for proteins [32] the heat shock family of proteins can also act as molecular chaperones for proteins. The heat shock family includes members that are inducible by drought stress [33], and convey drought tolerance by preventing the denaturation of proteins, refolding misfolded proteins, or preventing the aggregation and subsequent accumulation of misfolded proteins [34]. Non‐functional proteins that cannot be refolded must be degraded via proteolysis. Proteolysis is increased in response to drought stress [35][36] and is thought to promote drought tolerance by removing damaged proteins and mobilizing nitrogen [37].
Together, small molecules such as compatible solutes and macromolecules such as enzymes comprise a large portion of the drought avoidance and drought tolerance responses known to date.
Drought avoidance is concerned with maximizing water uptake and minimizing water loss so as to maintain high plant water status. Drought tolerance is concerned with minimizing cellular damage incurred by ROS and protein denaturation.
Quantitative trait loci for drought resistance
Quantitative trait loci (QTL) analysis has proven to be a valuable method in discovering the genetic basis of quantitative traits. Quantitative traits, or continuous traits, are those that cannot be placed into discrete classes. The genes underlying quantitative traits have been successfully mapped and
subsequently identified using QTL analysis in a diverse set of organisms including: rat [38], mouse [39], cow [40], tomato [41], Arabidopsis [5] and rice [6]. The requirements for performing a QTL analysis are:
species that can be inbred to produce a segregating population, genetic markers distributed across each chromosome to generate a recombination map, and a trait with quantitative variation that can be phenotyped. QTL analysis is a statistical test performed for a genetic marker which determines if significant differences exist between the phenotype exhibited by progeny carrying one parental allele and progeny carrying another parental allele. The test is repeated for every marker in the recombination map and when a significant difference is found the QTL is considered to be linked to that marker. Since its inception, QTL analysis has evolved to include more sophisticated techniques such as simple interval mapping [42], composite interval mapping [43], and permutation testing [44] which have increased the resolution and reliability in detecting QTL.
QTL analysis has been used to identity chromosomal regions involved in drought stress
responses in barley since 1997 by Teulat et al. [45]. Since then, at least eleven studies using barley grown under water limited conditions in the greenhouse and field have been published which used only three mapping populations: Tadmor x Er/Apm [45][46][47][48][49][50][51][52], Arta x Hordeum spontaneum
5 41‐1 [53][54], and Steptoe x Morex [55]. From these studies, over 200 significant QTL for a variety of drought resistance related traits have been discovered. These traits, among others, include: relative water content, chlorophyll fluorescence parameters, grain yield, days to maturity, plant height, and kernel weight. These QTL are useful in mapping genes responsible for conveying drought resistance and can be applied in marker assisted breeding programs [56]. Of the QTL studies enumerated above, some have demonstrated the specificity of some QTL to one environment, for example, in a growth chamber experiment using the Tadmor x Er/Apm population QTL for relative water content and leaf number were detected under drought conditions but not well watered conditions [45].
Development dependent responses to drought
Responses to drought are dependent on when the stress occurs (i.e. which developmental stage the barley plant is in) [57], how severe the stress is [58], and how long it persists [59]. Of the eleven barley drought resistance QTL studies mentioned above, six were conducted in the field under low rainfall conditions and five were conducted in the controlled environment of a greenhouse or growth chamber.
In rainfed field studies, where the rainfall is not easily controlled, the timing, severity and duration of the drought differs between replications. Therefore, the average recorded phenotypes in rainfed studies are the integration of the varied responses to the different types of drought stress experienced by the population over the experimental replications. While QTL studies under rainfed field conditions provide valuable insight to the genetic basis of barley performance in the field, they provide less information on developmental stage specific responses to drought. In controlled environment studies, the timing of the stress event can be chosen and coinciding factors such as light intensity and humidity can be controlled.
In four of the five QTL studies conducted in controlled environments, the stress was applied at the four‐
leaf stage of development i.e. during vegetative growth. The remaining experiment, which was only concerned with chlorophyll fluorescence parameters, applied drought stress starting post‐flowering. A review of the literature revealed an absence of QTL studies in barley that characterized the
morphological and physiological responses to drought applied during flowering.
The objective of this study was to identify marker‐trait linkages in a barley RIL population, derived from the Syrian landrace Arta and the Australian cultivar Keel, under moderate drought applied during anthesis using quantitative trait loci analysis. Additionally, this study aimed to understand which morphological and physiological traits respond to drought stress and how they correlate with yield performance under well watered and drought conditions. These objectives were realized by measuring
grain yield and yield related traits at maturity in addition to morphological and physiological responses that occur during drought stress.
Materials and methods
Experimental overview
This chapter is concerned with the genetic basis of physiological and morphological changes in barley that occur in response to long term drought stress applied at anthesis. Control plants were well watered and maintained at a soil water content (SWC) of 50% while the SWC of drought treated plants was maintained at 15%. These treatments were applied to barley genotypes Arta and Keel and to a core population of 56 recombinant inbred lines (RILs) from a cross of the parental lines Arta and Keel.
Physiological traits were measured in parental lines one day and three days after the target SWC of drought treated plants was reached. Morphological measurements were made during grain filling and agronomic measurements were made after plant maturity. A list of all traits considered and the
abbreviations used in this text can be found in Table 1. The variance in each trait measured in Arta, Keel and the RIL population was attributed to effects of genotype, the treatment, or the interaction of two, by using a two way ANOVA. Phenotyping in the RIL population under each treatment was used to calculate genetic correlations between grain yield and the physiological, morphological and agronomic traits. By utilizing the recombination map available for the RIL population, Quantitative trait locus (QTL) analysis was performed using the collected phenotypic measurements to locate genetic loci containing potential drought resistance genes.
Plant material
Two Hordeum vulgare genotypes, Arta and Keel, were grown in well watered and water limited conditions in the greenhouse to evaluate their performance. Arta is a pure line selection from a Syrian landrace adapted to the driest areas in Syria. Keel is a feed‐quality cultivar from Southern Australia with good performance under dry conditions in Australia. A recombinant inbred line population (RIL)
generated at International Center for Agricultural Research in the Dry Areas (ICARDA) consisting of 188 F8 plants from the cross Arta x Keel (Arke) was available for genetic analyses. A subset of 54 individuals from the Arke population was selected to represent the maximal diversity in the population by using Core Hunter version 1.0b (CIMMYT)[60] set to optimize the modified Rogers distance.
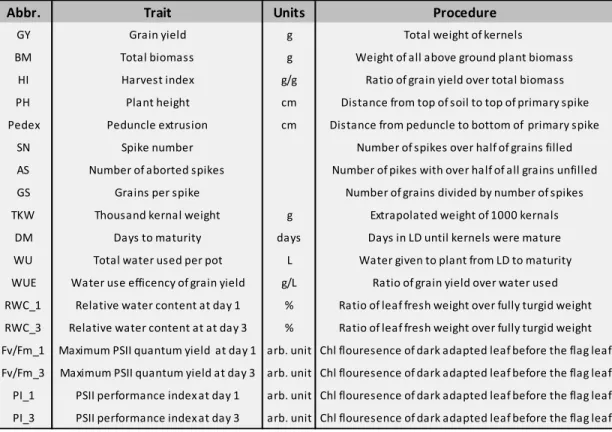
Table 1. Traits measured experimentally including the abbreviation used, units used and the procedure by which the measurements were taken.
Abbr. Trait Units Procedure
GY Grain yield g Total weight of kernels
BM Total biomass g Weight of all above ground plant biomass
HI Harvest index g/g Ratio of grain yield over total biomass PH Plant height cm Distance from top of soil to top of primary spike Pedex Peduncle extrusion cm Distance from peduncle to bottom of primary spike
SN Spike number Number of spikes over half of grains filled
AS Number of aborted spikes Number of pikes with over half of all grains unfilled GS Grains per spike Number of grains divided by number of spikes TKW Thousand kernal weight g Extrapolated weight of 1000 kernals
DM Days to maturity days Days in LD until kernels were mature WU Total water used per pot L Water given to plant from LD to maturity WUE Water use efficency of grain yield g/L Ratio of grain yield over water used RWC_1 Relative water content at day 1 % Ratio of leaf fresh weight over fully turgid weight RWC_3 Relative water content at at day 3 % Ratio of leaf fresh weight over fully turgid weight Fv/Fm_1 Maximum PSII quantum yield at day 1 arb. unit Chl flouresence of dark adapted leaf before the flag leaf Fv/Fm_3 Maximum PSII quantum yield at day 3 arb. unit Chl flouresence of dark adapted leaf before the flag leaf PI_1 PSII performance index at day 1 arb. unit Chl flouresence of dark adapted leaf before the flag leaf PI_3 PSII performance index at day 3 arb. unit Chl flouresence of dark adapted leaf before the flag leaf
Drought treatment
The response to drought stress was tested under controlled conditions in the greenhouse by
withholding water at the generative stage (Zadoks scale 49‐53) [61]. Plants were sown in 96 well trays, vernalized at 4°C for 5 weeks with an 8 h light/16 h dark short day (SD) photoperiod and then potted in four liter pots containing 1.8 kg of soil with three plants in each pot. The field capacity of 1.8 kg soil was calculated as the difference in weight between fully hydrated soil and dried soil. The soil was allowed to fully hydrate by flooding the pot with water and allowing any excess water to drain over 24 h while the pot was covered. Soil was dried by heating at 70°C for seven days. The soil water content (SWC) of potted plants was adjusted to 50% of the field capacity (FC) based on trial experiments concerned with finding the moisture content for optimum growth (data not shown). The pots were arranged in two random blocks in a climatically controlled SD greenhouse for 10 days before being moved to a
climatically controlled greenhouse with a 16 hr/8 hr long day (LD) photoperiod for the remainder of the experiment. In the mornings, evenings and during overcast days, supplemental lighting was used to ensure that the light levels were maintained at no less than 200 μmol photons m−2 s−1. Humidity of the greenhouse was maintained between 50% and 60%.
For the water stress treatment, the water content of the soil was reduced to 15% FC by withholding water in a controlled manner; all pots were weighed every day and then watered to match the weight of
7
the heaviest pot. Following this gravimetric method, the reduction of the water content of the soil was equal across all pots in the stress treatment. The SWC of 15% FC for the stressed plants and 50% FC for the control plants was maintained until maturity of the plants. The amount of water given to each four liter pot was recorded and used to determine the water use efficiency. To control for the added weight of the growing plants the volumetric water content of random pots were periodically checked using a TDR 100 soil moisture meter (FieldScout) fitted with 12 cm probe rods and set to standard soil mode. If the projected SWC was lower than the measured water content than additional water would be added to correct for the increased plant mass.
Physiological measurements
Samples were taken from control and drought treated plants one and three days after the target FC of 15% had been reached in drought stressed pots. The leaf directly under the flag leaf was used for both physiological measurements. Fast chlorophyll fluorescence induction kinetics was measured on every plant per pot using the Handy PEA chlorophyll fluorimeter (Hansatech Instruments). Fluorescence was induced using a 3000 μmol photons m−2 s−1 flash of light persisting for 1 s on leaves dark adapted with leaf clips for a minimum of 20 min. Care was taken to place the leaf clips so as to avoid taking
measurements that included the midrib. Chlorophyll fluorescence induction curves were analyzed using the PEA plus software version 1.02 (Hansatech Instruments) and the maximum quantum efficiency (Fv/Fm) and the Performance Index (PI) were calculated. The relative water content of the leaf (RWC) was calculated from one ~3 cm leaf cutting per plant and calculated according
to
100 [62]. Freshly cut leaves were immediately weighed to determine the fresh weight. The turgid weight was determined after submerging the leaf cuttings in distilled water in closed tubes and storing them overnight at 4 °C in the dark. Dry weight of the leaf cuttings was determined after drying the cuttings at 70 °C for 48 hours.
Morphological and agronomic measurements
Plants were considered to head when the spikelet had visibly emerged from the ear in the main tiller and was used as a developmental marker to apply the drought stress. Peduncle extrusion (Pedex) and plant height (PH) were recorded post‐anthesis by measuring the distance from the flag leaf collar to the bottom of the main tiller and the distance from the soil surface to the top of the spike, respectively. In cases where the spike remained booted in the leaf sheath, negative Pedex values were recorded. The number of grains on each primary spike (GS) was counted as well as the number of spikes per plant (SN).
The days until maturity (DM) was recorded for each pot from the time of transfer to LD until the majority
9 of the grains could no longer be dented by fingernail. Mature plants were harvested and the following measurements were taken per pot: above ground biomass dry weight (BM), total grain weight (GY), and 1000 kernel weight (TKW). Harvest index (HI) was calculated as the ratio of the total grain weight over the biomass above ground dry weight. The water used by the plants in each pot (WU) was recorded starting after the plants were potted in four liter pots. To control for the water lost due to evaporation alone, four additional pots were included in the experiment which contained 1.8 kg of soil but no plants and were watered to maintain SWC of either 50% or 15% FC. Water use efficiency (WUE) was calculated as the ratio of the grain yield over the water given to each pot.
Statistical analysis
Statistical analyses were conducted using SAS software version 9.1.3 for Windows (SAS Institute Inc, copyright 2003) using data from the parental barley genotypes and from the RIL population. The
command PROC MEANS was used to determine the mean, minimum and maximum values for Arta, Keel and the RIL population. A two way analysis of variation (ANOVA) was performed for each trait in Arta, Keel, and the RIL population with a general linear model using the PROC GLM command with the model:
Yij = Gi + Ek + Gi x Ek, where Gi is the fixed effect of the genotype, Ek is the fixed effect of the treatment, and Gi x Ek is the interaction of the two effects. Pearson correlation coefficients between all traits recorded in the RIL dataset under control conditions and stress conditions were generated separately using the PROC CORR command.
Linkage mapping
Arta, Keel and 188 RILs were genotyped with six gene specific PCR markers, 103 microsatellite (SSR) markers and 623 Diversity array technology (DArT) markers. DArT genotyping was carried out by Triticarte Pty. Ltd. (Australia). Markers with a segregation distortion higher than 20% in the 188 RILs were excluded from linkage map construction. As a first step SSR markers were assigned to barley chromosomes based on a previously published barley consensus map Alsop et al. [63] . Linkage groups of SSR‐, DArT‐ and PCR‐markers were defined using a LOD threshold of 3.0 using the mapping software JoinMap 3.0 (Kyazma B.V.). Genetic distances between markers were calculated using the Haldane mapping function of the software package. For the seven barley chromosomes (1H‐7H) 661 markers were assigned to 11 linkage groups with a total map size of 1147.9 cM and an average marker distance of 1.7 cM. Insufficient linkage was found between markers on chromosomes 1H, 2H and 7H, therefore they were assigned to the separate linkage groups 1Ha/1Hb, 2Ha/2Hb and 7Ha/7Hb/7Hc, respectively.
Linkage groups of chromosomes 1H, 2H and 7H were combined into a single linkage group per
chromosome with an arbitrary genetic distance of 20 cM added in between them. Minor changes in marker positions and marker order in the range of 1‐10 cM were detected when compared to the consensus map of Alsop et al. [63].
Quantitative trait loci analysis
The QTL analysis was conducted with MultiQTL version 2.5 [64]. The population type selected was “RIL selfing” and the multiple environment option was used to calculate significant effects across control and drought treatments. Simple interval mapping using the Haldane function was employed for each trait. A permutation test consisting of 1001 iterations was used to detect significant QTL (p < 0.05).
Results
Robustness of barley physiology despite drought
Physiological measurements in drought experiments are important for understanding the extent of stress experienced by the plant due to the treatment. Such measurements allow morphological changes in the treated plants to be put into context of how the plant is responding on the cellular level and can facilitate the comparison of results between different experimental setups. Two physiological
measurements are considered here: the leaf relative water content and the chlorophyll fluorescence induction curve. Leaf relative water content (RWC) is a measurement of the how much water is present in the leaf relative to the maximum amount of water the leaf can contain and is an indicator of the overall water status of the plant. After one day of drought treatment, the mean RWC dropped
significantly in the RIL population from 87.3% in control conditions to 81.2% in drought conditions (Table 2). However, no significant differences in the mean RWC of stressed Arta and Keel plants were detected as compared to controls. After three days of drought treatment, significant differences in mean RWC between conditions were seen in Arta and Keel with respective values of 96.5% and 95.9% in control conditions and 80.2% and 76.0% in drought conditions. Conversely, the mean RWC of the RIL population was not statistically different between conditions after three days of treatment.
The chlorophyll fluorescence induction curve is obtained by measuring the rise in chlorophyll fluorescence in photosystem II (PSII) from a dark adapted state where the reaction centers are fully oxidized to a light saturated state where the reaction centers are fully reduced. One of the parameters calculated from the induction curve is the maximum quantum efficiency of photosystem II which is the ratio of the difference in fluorescence between the fully reduced state (Fo) and the fully oxidized state (Fm) over Fm, this ratio is also known as Fv/Fm. The maximum quantum efficiency of
photosystem II (Fv/Fm) describes how often the primary plastoquinone acceptor (Qa) is reduced per photon absorbed and is an indicator of the status of the light harvesting complex of PSII. The other, more comprehensive parameter considered was the performance index (PI), which incorporates three
independent aspects of photosynthesis; the force of the light reactions, the force of the dark reactions and the efficiency of light trapping by the light harvesting complex.
Table 2. The mean, minimum (Min) and maximum (Max) values of the traits measured for Arta, Keel and the Arke RIL population either under control or drought conditions. Means that are not significantly (p<0.05) different share the same letter subscript.
Trait Min Max Min Max Min Max Min Max Min Max Min Max
GY 7.6 a 6.0 8.2 5.3 cd 3.2 6.7 5.4 c 2.4 9.8 3.7 bd 2.8 4.4 3.0 b 2.6 3.8 3.3 b 1.9 4.7
BM 14.2 a 11.9 15.5 10.0 cd 6.4 12.4 10.8 c 5.7 18.6 7.3 bd 5.7 8.5 6.0 b 5.0 7.5 6.9 b 4.2 9.6
HI 0.54 a 0.50 0.64 0.52 a 0.42 0.57 0.49 a 0.41 0.58 0.50 a 0.48 0.52 0.50 a 0.48 0.53 0.48 a 0.34 0.71 PH 54.4 a 50.3 57.8 50.7 ac 48.6 53.5 53.1 a 42.3 63.5 44.8 bc 39.4 49.2 42.8 b 39.7 45.6 42.8 b 31.4 55.0 Pedex 1.5 a ‐1.5 15.8 ‐4.6 bc ‐5.8 ‐2.5 ‐4.0 c ‐9.1 4.8 ‐6.8 bc ‐8.1 ‐4.6 ‐5.7 bc ‐10.3 0.9 ‐6.3 b ‐11.2 3.3
SN 8.9 a 5.0 10.3 7.5 ab 4.0 10.0 5.5 b 3.3 36.5 3.7 bc 3.0 4.0 3.5 bc 3.0 4.0 3.6 c 1.3 5.0
GS 14.1 ab 11.7 16.3 12.7 a 10.7 14.7 13.6 a 10.0 17.7 15.4 b 13.7 17.0 13.5 ab 12.3 14.3 12.8 a 10.0 16.7 TKW 55.0 b 50.8 58.1 54.0 ab 49.2 62.0 49.1 a 32.2 60.8 51.6 ab 48.3 53.9 53.8 ab 49.2 59.4 50.5 ab 41.7 60.2 DH 19.5 a 18.0 20.0 14.5 bc 13.0 20.0 16.5 ab 13.0 23.0 19.1 a 18.0 21.0 13.4 c 13.0 14.0 16.8 ab 13.0 22.0 DM 68.0 a 63.0 70.0 69.8 a 68.0 70.0 68.1 a 56.0 70.0 60.8 b 60.0 62.0 61.8 b 60.0 62.0 63.4 b 57.0 70.0 WU 12.88 a 11.54 13.59 9.58 c 7.34 11.48 10.50 c 6.75 14.39 7.22 b 6.44 7.90 6.08 b 5.20 6.57 6.31 b 4.32 8.35
WUE 1.8 b 1.5 2.1 1.6 ab 1.2 1.9 1.5 a 1.0 2.1 1.5 ab 1.3 1.7 1.5 ab 1.3 1.7 1.6 ab 1.1 1.9
RWC_1 87.2 abc 63.4 100.0 87.3 ac 62.0 100.0 93.1 a 78.8 100.0 81.6 bc 71.9 100.0 84.2 abc 64.7 100.0 81.2 b 69.5 95.6 RWC_3 96.5 a 78.3 100.0 95.9 a 64.7 100.0 89.4 b 75.2 100.0 80.2 bc 62.5 95.8 76.0 c 44.4 100.0 88.4 b 64.4 100.0 Fv/Fm_1 0.832 a 0.823 0.839 0.833 a 0.831 0.838 0.840 a 0.821 0.850 0.832 a 0.816 0.841 0.837 a 0.832 0.839 0.838 a 0.806 0.851 Fv/Fm_3 0.844 ab 0.841 0.847 0.842 ab 0.840 0.844 0.843 b 0.829 0.852 0.845 ab 0.844 0.846 0.844 ab 0.843 0.844 0.840 a 0.833 0.850
PI_1 3.4 a 2.9 4.0 4.1 a 3.9 4.431 3.9 a 1.7 4.9 3.1 a 2.6 3.6 4.1 a 3.8 4.4 3.8 a 1.863 4.768
PI_3 3.8 ab 3.5 4.2 4.3 ab 4.3 4.3 4.1 b 2.7 5.1 3.2 ab 3.1 3.3 4.2 ab 4.0 4.4 3.6 a 2.5 4.5
Control Arta Control Keel Control Arke RILs
Mean Mean Mean
Drought Arke RILs
Mean Mean Mean
Drought Arta Drought Keel
GY grain yield, BM biomass, HI harvest index, PH plant height, Pedex peduncle extrusion, SN spike number, GS grains per main spike, TKW 1000 kernel weight, DH days to heading, DM days to maturity, WU water use, WUE water use efficiency, RWC _1/3 leaf relative water content at 1 or 3 days after treatment start, Fv/Fm_1/3 at 1 or 3 days after treatment start, PI_1/3
performance index 1 or 3 days after treatment start.
The mean Fv/Fm of all plants was similar one day after the target SWC of 15% was reached, with values ranging from 0.832 to 0.840 (Table 2). Three days after the target SWC was reached, there was a significant difference in the mean Fv/Fm in the RIL population between control (0.843) and in drought (0.840) conditions. The mean Fv/Fm between treatments was not different for Arta and Keel after three days of treatment. The mean PI after one day of stress treatment was not different between Arta, Keel and the RIL population in either control and drought conditions with mean values ranging from 3.1 to 4.1 (Table 2). After three days at 15% SWC, mean PI values between treatments were not different for Arta and Keel while the RIL population showed a significant decrease in the mean PI from 4.1 in control conditions to 3.6 in drought stressed conditions. The PI values in the RIL population after three days at 15% SWC was normally distributed under control and drought conditions (Figure 1). It is notable that
11
under control conditions two RILs had PI values two standard deviations higher than either parental line which was indicative of transgressive segregation for this trait.
Altogether, these results show that the RWC, Fv/Fm and the PI of the plants were relatively unaffected by the drought treatment as seen in the slight reduction in the water status of the plants and in the intermittent decrease in the photosynthetic performance as compared to control.
0 5 10 15 20 25
3 3.5 4 4.5 5 5.5
Frequency
Performance Index
Control Drought
Figure 1. Distribution of the mean performance index three days after the SWC reached 15% in the RIL population under the two watering schemes. Under control conditions the mean performance index and standard deviation was 3.84±0.54 for Arta and 4.3±0.02 for Keel. Under drought conditions, the mean performance index and standard deviation was 3.22±0.12 for Arta and 4.21±0.30 for Keel.
Reduction in grain yield and yield components due to drought stress
When evaluating the performance of a crop plant the most important trait is yield. Grain yield is a complex trait which is dependent on yield component traits such as the ones measured here: number of spikes per plant, the number of grains per spike and the thousand kernel weight. The mean grain yield of Arta under control conditions (7.6 g) was significantly higher than that of Keel (5.3 g) and the RILs (5.4 g) (Table 2). However, the mean yield under drought stress conditions of Arta (3.7 g), Keel (3.0 g), and the RIL population (3.3 g) were not different from each other. Comparing yields between treatments revealed significant decreases in yield for Arta, Keel and the RIL population under drought conditions as compared to control conditions. By dividing the grain yield achieved under drought conditions by the yield achieved under control conditions one can obtain the yield tolerance index of each group (Figure 3). The highest yield stability was seen in the RIL population (0.60), the second highest in Keel (0.57), with Arta having the lowest index (0.48). The yield of the RIL population was normally distributed under
13 control conditions and under drought conditions (Figure 2). Four RILs had grain yield two standard deviations higher than either parent under control conditions and eight RILs were higher under drought conditions, which is indicative of transgressive segregation for yield in the RIL population.
To better understand how drought affects yield, the performance of individual yield components were also measured under control and drought conditions. There are also genetic components to yield component traits, for example, some genotypes may produce more grains by producing more tillers while other genotypes may favor having more grains per spike. Because the two genotypes used in this study are adapted to different drought prone areas it is possible that have adapted different strategies to maximize yield. The number of spikes developed under water limited conditions can indicate how well the plant has continued to grow despite a perceived limitation in available water. There was a significant decrease in the mean spike number for Arta, Keel and the RILs in drought conditions (3.7 and 3.5, and 3.6, respectively) as compared to control conditions (8.9, 7.5, and 5.5, respectively) (Table 2). The mean spike number under control conditions was not different between Arta and Keel but was significantly different between Arta and the RILs. Under drought conditions, the mean spike number was similar between Arta, Keel and the RILs. The mean number of grains per primary spike under control conditions for Arta (14.1), Keel (12.7) or the RILs (13.6) were not different from the number present in plants grown under drought conditions, respectively (15.4, 13.5, and 12.8). The number of grains per primary spike between conditions was similar for Arta, Keel and the RILs with mean values ranging from 12.7 to 14.1 under control conditions and from 12.8 to 15.4 under drought conditions (Table 2). The third yield component trait considered was the thousand kernel weight. Under control conditions, Arta had a higher mean thousand kernel weight than the RILs with respective values of 55.0 g and 49.1 g; the kernel weight of Keel was intermediate between the two (54.0 g)(Table 2). The mean thousand kernel weight was not different between Arta, Keel and the RILs under drought nor was it different between conditions for Arta, Keel and the RILs.
In summary, grain yield in Arta, Keel and the RILs was reduced due to the drought treatment and this appears to be due to a reduction in the spikes that developed during the drought treatment. It appeared that the reduction in grain yield between conditions was neither due to differences in the number of grains per spike nor due to reductions in the overall weight of individual grains. Arta produced more grain yield than Keel under control conditions but not under drought conditions. In addition to yield component traits, morphological and developmental traits classically associated with yield in an agricultural setting were considered. Many of these agronomic traits, such as plant height, peduncle extrusion, and days to maturity were seen here to be positively and significantly correlated to grain yield under control and drought conditions (Table 4).
0 5 10 15 20 25
2 3 4 5 6 7 8 9 10 11 12
Frequency
Yield (g)
Control Drought
Figure 2.Distribution of the mean grain yield weight per RIL under the two watering schemes. Under control conditions the mean grain yield per plant and standard deviation was 7.59±0.71 for Arta and 5.27±1.46 for Keel. Under drought conditions, the mean grain yield per plant and standard deviation was 3.66±0.49 for Arta and 3.03±0.04 for Keel.
0.2 0.3 0.4 0.5 0.6 0.7 0.8 0.9 1
Grain yield
Biomass
Spike number
Days to maturity Water use
PI_3 RWC_3
Arta Keel RIL population
Figure 3. Tolerance index of: grain yield , biomass , number of spikes per plant , days until maturity , water use (WU), the performance index (PI_3), and the relative water content (RWC_3) of Arta, Keel and the average of the RIL population. Units of each axis are the fraction of the trait value maintained under stress conditions as compared to control.