Matters arising
https://doi.org/10.1038/s41558-019-0534-5
Could Bitcoin emissions push global warming above 2 °C?
Lars Dittmar 1,3 and Aaron Praktiknjo 2,3
1Institute for Climate Protection, Energy and Mobility, Berlin, Germany. 2Institute for Future Energy Consumer Needs and Behavior,
RWTH Aachen University, Aachen, Germany. 3These authors contributed equally: Lars Dittmar, Aaron Praktiknjo. e-mail: lars.dittmar@ikem.de;
aaron.praktiknjo@rwth-aachen.de
SUPPLEMENTARY INFORMATION
In the format provided by the authors and unedited.
NAture CLimAte ChANge | www.nature.com/natureclimatechange
Supplement to
Could Bitcoin emissions push global warming above 2°C?
Lars Dittmar1*, Aaron Praktiknjo2*
1Institute for Climate Protection, Energy and Mobility. Email: lars.dittmar@ikem.de
2Institute for Future Energy Consumer Needs and Behavior, RWTH Aachen University. Email: aaron.praktiknjo@rwth-aachen.de
*Corresponding authors
The article by Mora et al. reports no results for Bitcoin’s electricity use. We used the R-script provided by the authors to reproduce their calculations and deduce their estimated electricity use for the year 2017.
We also created an Excel file that reproduces the results based on mean values1. The present document outlines the most important steps and results of the calculations.
Bitcoin electricity use 2017
Transactions of Bitcoins among users are grouped into so called ‘blocks’, which are each cryptographically linked to predecessor block up to the first (genesis) block. The cryptographical link between the Bitcoin blocks is based on the ‘proof-of-work’ (PoW) algorithm, which is a computing- intensive mathematical puzzle (hash function) to be solved in order to protect the Bitcoin blockchain from manipulation. As result, Bitcoin’s annual electricity consumption is defined as the sum of the product of the energy intensity of the mining hardware, i.e. the power consumption per hash solved, and the number of expected hashes solved over all blocks per year, equation (1)2:
𝐸𝐸𝐸𝐸𝐸𝐸𝐸𝐸𝐸𝐸𝐸𝐸𝐸𝐸𝐸𝐸𝐸𝐸𝐸𝐸 𝐶𝐶𝐶𝐶𝐶𝐶𝐶𝐶𝐶𝐶𝐶𝐶𝐶𝐶𝐸𝐸𝐸𝐸𝐶𝐶𝐶𝐶= � 𝐸𝐸𝐸𝐸𝐸𝐸𝐸𝐸𝐸𝐸𝐸𝐸𝐸𝐸𝐸𝐸𝐸𝐸𝐸𝐸𝐸𝐸 𝐼𝐼𝐶𝐶𝐸𝐸𝐸𝐸𝐶𝐶𝐶𝐶𝐸𝐸𝐸𝐸𝐸𝐸𝑖𝑖∙ 𝐸𝐸𝐸𝐸𝐶𝐶𝐸𝐸𝐸𝐸𝐸𝐸𝐸𝐸𝐸𝐸 𝐻𝐻𝐻𝐻𝐶𝐶ℎ𝐸𝐸𝐶𝐶𝑖𝑖 𝑛𝑛_𝑏𝑏𝑏𝑏𝑏𝑏𝑏𝑏𝑏𝑏𝑏𝑏
𝑖𝑖=1
(1) The expected number of hashes needed to find a solution is approximately 2³² as defined by the protocol2. However, Bitcoin is designed such that every 10 minutes on average, one block with
transactions is added to the blockchain. The block interval is held constant by an automatic adjustment of the difficulty to solve the hash function. Therefore, if miners increase the computational power of the network (hashrate), the difficulty increases and vice versa. This can be approximated by the relationship indicated in equation (2) 2
𝐸𝐸𝐸𝐸𝐶𝐶𝐸𝐸𝐸𝐸𝐸𝐸𝐸𝐸𝐸𝐸 𝐻𝐻𝐻𝐻𝐶𝐶ℎ𝐸𝐸𝐶𝐶 𝐶𝐶𝐸𝐸𝐸𝐸 𝐵𝐵𝐸𝐸𝐶𝐶𝐸𝐸𝐵𝐵=𝐷𝐷𝐸𝐸𝐷𝐷𝐷𝐷𝐸𝐸𝐸𝐸𝐶𝐶𝐸𝐸𝐸𝐸𝐸𝐸 ∙232=𝐵𝐵𝐸𝐸𝐶𝐶𝐸𝐸𝐵𝐵 𝐼𝐼𝐶𝐶𝐸𝐸𝐸𝐸𝐸𝐸𝐼𝐼𝐻𝐻𝐸𝐸 ∙ 𝐻𝐻𝐻𝐻𝐶𝐶ℎ𝐸𝐸𝐻𝐻𝐸𝐸𝐸𝐸 ∙ 232 (2)
Note that equation (1) and (2) imply that the number of transactions in a block do not affect the electricity consumption for mining that block. Electricity consumption is solely proportional to the expected hashes to be solved, which is governed by the interplay of difficulty and hashrate. Increases in throughput capacity, however, translate to a proportional decrease in electricity consumption per transaction. The maximum transaction rate for Bitcoin is constrained by the effective block size, the average transaction size and the block interval (see equation (3)).
𝑇𝑇𝐸𝐸𝐻𝐻𝐶𝐶𝐶𝐶𝐻𝐻𝐸𝐸𝐸𝐸𝐸𝐸𝐶𝐶𝐶𝐶𝐶𝐶 𝐶𝐶𝐸𝐸𝐸𝐸 𝐶𝐶𝐸𝐸𝐸𝐸𝐶𝐶𝐶𝐶𝐸𝐸= 𝐵𝐵𝐸𝐸𝐶𝐶𝐸𝐸𝐵𝐵 𝑆𝑆𝐸𝐸𝑆𝑆𝐸𝐸
𝐴𝐴𝐼𝐼𝐴𝐴. 𝑇𝑇𝐸𝐸𝐻𝐻𝐶𝐶𝐶𝐶𝐻𝐻𝐸𝐸𝐸𝐸𝐸𝐸𝐶𝐶𝐶𝐶 𝑆𝑆𝐸𝐸𝑆𝑆𝐸𝐸 ∙ 𝐵𝐵𝐸𝐸𝐶𝐶𝐸𝐸𝐵𝐵 𝐼𝐼𝐶𝐶𝐸𝐸𝐸𝐸𝐸𝐸𝐼𝐼𝐻𝐻𝐸𝐸 (3)
The key scaling parameters are the block size and block interval, which are specified by the Bitcoin protocol. All else remaining equal, both an increase in block size and a reduction of block interval lead to a higher transaction throughput, whereas electricity consumption stays constant.
Equation (1) and (2) also build the core of Mora et al.’s estimations for 2017. To estimate power consumption, they randomly sample 1,000 times from a self-compiled list of 62 devices with different energy intensities. All other input parameters are provided in the public Bitcoin ledger.
Executing the R-script of Mora et al. using their input data returns only their estimates for Bitcoin’s 2017 carbon emissions explicitly. We added additional lines of codes in order to track and report their implied values on electricity consumption. A summary of Mora et al.’s explicit and implied results data is given in Table 1.
Description Value Unit
Total number of expected hashes in 2017 1.91⋅1017 GHash Output data
for 2017
Carbon emissions 69.0 ± 0.42 MtCO2e
18.8 ± 0.10 MtC Implied avg. electricity per transaction 1 095.8 ± 6.4 kWh/tx Implied avg. electricity consumption 114.0 ± 0.68 TWh Implied avg. mining intensity 2.15 ± 0.01 J/GHash
Table 1: Input and output data for Mora et al.’s 2017 base year estimations
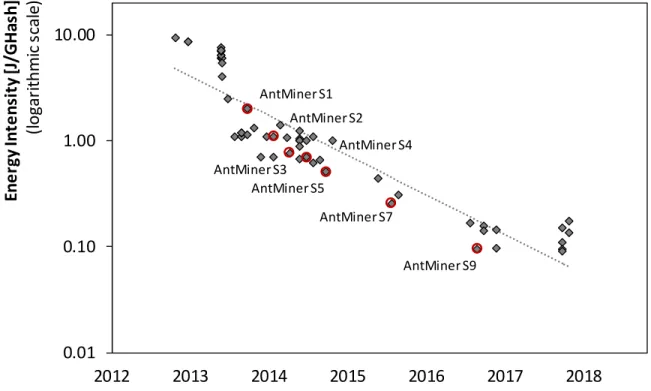
Figure 1 reveals that the Mora et al. include so-called legacy hardware with high energy intensities, underestimating the technology development and its dampening effects on energy intensities over time.
Irrespective of the time trend, there is also a substantial discrepancy between average energy intensity of their sample (amounting to 2.15 J/GHash) and those estimated by other researchers (e.g. 0.15 (ref.3) to 0.30 (ref.4,5) J/GHash). This implies that their 2017 estimates of 114 TWh electricity consumption for Bitcoin exceed other estimates by a factor of 7 to 14.
Figure 1: Evolution of Bitcoin Mining Hardware in Terms of Energy Intensity (based Mora et al. and ref.6 , see supplementary Excel file) – We labeled the miner generations (AntMiner) from Bitmain as references. Bitmain has a claimed sales share of about 70% in mining hardware4. The grey dotted line in the chart is a log-linear regression curve based on all miners in the sample. The regression results, ln(Energy Intensity) = -0.86 · Year + 1733.68, R2 = 0.83, suggest that the energy intensity of miners halves every 9 months. This is substantially faster than estimates for general purpose computers, referred to as Koomey’s law7. However, this is just an indicative value and needs a more thorough assessment.
Mora et al. present median, slow, and fast scenarios projecting Bitcoin adoption until the number of annual transactions reaches ~314.2 billion. In their median scenario, cumulative Bitcoin emissions surpass ~231.4 GtC within 16 years. In the same scenario, Mora et al. anticipate a Bitcoin adoption of
~16.8% within five years. Based on their assumptions for (frozen) electricity intensity and maximum number of transactions, this translates to an annual electricity consumption of ~57,800 TWh for Bitcoin alone. Global electricity consumption in 2017 was reported at ~22,200 TWh.8 Therefore, projections by Mora et al. imply an increase in global electric power capacity of ~3.63 within five years. In comparison, the 2012 global electricity consumption was reported at ~18,900 TWh, corresponding to an increase of global electric power capacity by a factor of ~1.17 from 2012 to 2017.
1 https://github.com/larsdittmar/BTC_Dittmar_Praktiknjo
2 K. J. O'Dwyer a. D. Malone, “Bitcoin mining and its energy footprint.” In 25th IET Irish Signals & Systems
Conference 2014 and 2014 China-Ireland International Conference on Information and Communities Technologies
3 Krause, M.J. and Tolaymat T. Quantification of energy and carbon costs for mining cryptocurrencies. Nature Sustainability 1, 711–718 (2018)
4 De Vries, A. Bitcoin’s growing energy problem. Joule 2, 801–805 (2018).
AntMiner S1 AntMiner S2 AntMiner S3
AntMiner S4
AntMiner S5
AntMiner S7
AntMiner S9
0.01 0.10 1.00 10.00
2012 2013 2014 2015 2016 2017 2018
Energy Intensity [J/GHash] (logarithmic scale)
5 Bitcoin Energy Consumption Index (Digiconomist, 30th October 2018 ); https://digiconomist.net/bitcoin-energy- consumption
6 Dittmar, L & Praktiknjo, Aaron. (2018). The Electricity Intensity of Bitcoin Mining. 41st International Conference of the IAEE in Groningen 2018, DOI:10.13140/RG.2.2.36097.30567
7 Koomey, J. G. Berard, S. Sanchez, M. Wong, H. Implications of historical trends in the electrical efficiency of computing, Annals of the History of Computing, IEEE 33 (2011) 46–54. DOI:10.1109/MAHC.2010.28
8 International Energy Agency, 2018. World Energy Outlook 2018, World Energy Outlook. OECD.
https://doi.org/10.1787/weo-2018-en