Research Collection
Master Thesis
Quantifying the effect of recurrent Rossby wave patterns on extremely hot summers in present-day and end-of-the-century climate
Author(s):
Schönenberger, Vera Pascale Publication Date:
2021-03
Permanent Link:
https://doi.org/10.3929/ethz-b-000479076
Rights / License:
In Copyright - Non-Commercial Use Permitted
This page was generated automatically upon download from the ETH Zurich Research Collection. For more information please consult the Terms of use.
Master Thesis
Quantifying the effect of recurrent
Rossby wave patterns on extremely hot summers in present-day and end-of-the-century climate
Vera Pascale Sch¨ onenberger 15-119-985
Supervised by:
Dr. Matthias R¨ othlisberger Mauro Hermann
29 March 2021
Abstract
Extremely hot summers have devastating impacts on society and ecology. Recurrent Rossby wave patterns (RRWPs) are among the atmospheric features that have been linked to extreme weather events involving persistent surface weather. In this thesis, the link between RRWPs and the occurrence of extremely hot summers in the Northern Hemisphere is investigated and quantified.
To this aim the synoptic evolution of RRWP events is studied in three case studies of extremely hot summers using ERA5 and CESM data. Next, the link between RRWPs and the occurrence of extremely hot summers is quantified in present-day (1990 - 1999) and end-of-the-century (2091 - 2100) climate using a grid point-wise logistic regression model. In order to differentiate between the effect of collocated and upstream RRWPs on the occurrence of extremely hot summers, two different model implementations are used. Finally, we compare the results of the logistic regression model between the present-day and end-of-the-century climate in order to assess potential changes in the link between RRWPs and extremely hot summers due to global warming. We find that the effect of RRWPs on the occurrence of extremely hot summers is significant in many regions in the Northern Hemisphere, e.g., in the western U.S. (odds’ increase of up to +16%), eastern Europe (up to +14%) and in the region of the Caspian Sea (up to +18%). However, in the end-of-the-century climate, this link is much weaker. Uncertainties about the causes of a weakening link between RRWPs and extremely hot summers remain, and are possibly linked to the increasing importance of thermodynamic processes or altered jet stream dynamics. To conclude, RRWPs have significant effects on the occurrence of extremely hot summers in the Northern Hemisphere and are therefore essential when studying seasonal heat extremes. Thus, RRWPs should be further investigated - especially in the context of global warming.
Contents
1 Introduction 1
1.1 Extremely hot summers and their drivers . . . 1
1.2 Recurrent Rossby wave patterns . . . 2
1.2.1 RRWPs and jet streams . . . 4
1.2.2 Changing Rossby wave characteristics and their significance for RRWPs . . . 5
1.3 Objectives . . . 8
2 Data & Methods 9 2.1 Data . . . 9
2.1.1 CESM . . . 9
2.1.2 ERA5 . . . 10
2.2 Methods . . . 10
2.2.1 The metricR . . . 10
2.2.2 Logistic regression . . . 11
3 Model verification 13 4 Case studies 17 4.1 Summer 1983 . . . 17
4.2 A CESM extremely hot summer in North America . . . 23
4.3 A CESM extremely hot summer in Europe . . . 27
5 Logistic model 31 5.1 Logistic model for the present-day period (1990 - 1999) . . . 31
5.2 Logistic model for the end-of-the-century period (2091 - 2100) . . . 34
6 Discussion 38
7 Conclusion 43
Acknowledgements 46
References 47
Appendices 55
A Percentiles for the climatology comparison 55
B Models using longitudinal ranges of 60° 57
C Models using the seasonal medianR as covariate 59
D Another CESM extremely hot summer in Europe 60
E Climatologies in the end-of-the-century period 63
1 Introduction
1.1 Extremely hot summers and their drivers
Extremely hot summers have severe impacts on society and natural ecology (Horton et al., 2016), for example wild fires (Shaposhnikov et al., 2014), crop failures (Wegren, 2011) and damages to infra- structure (Garc´ıa-Herrera et al., 2010). Furthermore, the recent example of an extremely hot summer in Europe in 2003 claimed the life of approximately 40’000 people (Garc´ıa-Herrera et al., 2010). Due to climate change, heat waves like those contributing to the extremely hot summer 2003 are expected to become more frequent and intense during the course of the 21st century (Meehl & Tebaldi, 2004).
Consequently, a good understanding of the meteorological processes driving seasonal heat extremes is important. However, these processes are so far not well-known.
In contrast to seasonal heat extremes, the processes behind single heat waves acting on synoptic times- cales are better understood (Fragkoulidis et al., 2018; R¨othlisberger et al., 2019). During recent heat waves unusually persistent surface weather has been observed (Black et al., 2004; Dole et al., 2011). In summer, persistent surface weather can foster heat waves by supporting a positive temperature anom- aly over a prolonged period of time (Kysel´y, 2008). Atmospheric blocking is a dynamical mechanism that can induce persistent surface weather (Buehler et al., 2011; R¨othlisberger & Martius, 2019) and has been associated with the Russian heat wave in 2010 (Barriopedro et al., 2011) and the European heat waves in 2003 (Black et al., 2004) and 2018 (Li et al., 2020). An atmospheric blocking event is characterized by a synoptic scale high pressure system with an amplitude large enough to disrupt the westerly flow (Schwierz et al., 2004). The hot temperature extremes related to the blocking-induced persistent surface weather occur at the same location as the atmospheric block (Pfahl & Wernli, 2012).
These extremes result from the warming by the subsiding air and the enhanced incoming radiation due to the clear-sky conditions within the atmospheric blocking (Pfahl & Wernli, 2012). Another dynamical mechanism that can foster persistent surface weather are high-amplitude stationary waves with zonal wavenumbers 6 - 8 (Kornhuber et al., 2017b; Petoukhov et al., 2013). Such stationary wave patterns have been linked to extreme weather events and observed during the heat waves in Russia in 2010, in the U.S. in 2011, and in Europe in 2003 (Kornhuber et al., 2017a; Petoukhov et al., 2013, 2016). How- ever, for an entire summer to be extremely hot, the longer-term phenomenon of recurrent Rossby wave packets (RRWPs) has been suggested (R¨othlisberger et al., 2019). RRWPs lead to persistently dry or wet conditions (Ali et al., 2021), and can also foster temperature extremes on the weekly to monthly timescales (R¨othlisberger et al., 2019). Atmospheric blocking, stationary waves and RRWPs are all as- sociated with persistent surface weather and surface extreme temperatures, but considered as three
different dynamical phenomena. However, the distinction between different phenomena is not always apparent and there is also the possibility of a co-occurrence of the three phenomena. For example, there are three different possibilities in which RRWPs and atmospheric blocking can co-occur: (i) the continuous amplification of the waves at the same longitude can foster atmospheric blocking down- stream; (ii) it is plausible that a stationary blocking can act as metronome for RRWPs downstream (R¨othlisberger et al., 2019), since it has often been observed that a wave train develops downstream of an atmospheric block (Altenhoff et al., 2008), and (iii) it is also possible that a combination of the above mentioned mechanisms occurs (R¨othlisberger et al., 2019).
1.2 Recurrent Rossby wave patterns
Rossby waves are upper-tropospheric synoptic-scale waves that fulfil the following dispersion relation:
ω=u0k− kβ
k2+l2, (1)
where ω is the angular frequency, u0 the zonal mean flow, k and l are the zonal and meridional wave numbers, and β is the northward gradient of planetary vorticity (Rossby, 1945). Rossby waves occur due to the (meridional) gradient of potential vorticity (PV) in the atmospheric background flow, which can sustain waves adhering to the above (Rossby wave) dispersion relation (Holton & Hakim, 2013). These Rossby waves can be thought of as PV anomalies propagating along the background PV gradient (Hoskins et al., 1985) and hence manifest themselves in numerous atmospheric variables, e.g., as undulations of the midlatitude jet streams, as geopotential height anomalies or, importantly, as surface temperature anomalies. Moreover, Rossby waves transport energy, moisture and momentum across large distances (Wirth et al., 2018). Since Rossby waves interact and steer transient weather systems in the lower troposphere (Rossby, 1939), the weather on synoptic timescales in the midlatitudes is predominately influenced by the frequent passage of upper-tropospheric troughs and ridges of Rossby waves, which usually makes for variable surface weather, with warm and cold, or wet and dry periods succeeding each other (Hoskins et al., 1985). Thus, to explain the occurrence of unusually persistent surface weather, it is important to consider synoptic-scale Rossby waves (R¨othlisberger et al., 2019).
In the midlatitudes, Rossby waves often occur in form of a Rossby wave packet (RWP), i.e., a Rossby wave with a zonally varying amplitude, which experiences a local maximum and then decreases at larger distances (Wirth et al., 2018). An RRWP consists of several such RWPs, whereby the troughs and ridges of the RWPs repeatedly amplify at the same longitude, which results in a sequence of transient RWPs that are in phase with one another (R¨othlisberger et al., 2019). The Hovm¨oller diagrams in Figures 1 a
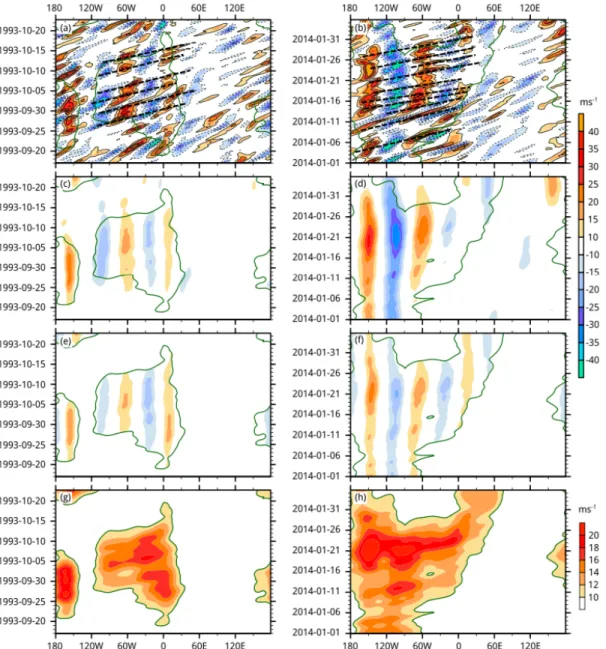
Figure 1: Steps for calculating metric R demonstrated on the example of RRWP events (a, c, e, g) in fall 1993 examined by Barton et al. (2016) and (b, d, f, h) in January 2014 examined by Davies (2015).
The Hovm¨oller diagrams show in colours (a, b) the 250-hPa meridional windvma(λ, t), (c, d) the time filtered versionvtf(λ, t), (e, f) the time and wavenumber filtered version vtf, wnf(λ, t), and (g, h) the metric R(λ, t). The green contour corresponds to R = 10m s−1 and the black dashed lines in (a) and (b) maps the aproximate trajectories of the RWPs in the RRWP. Taken from R¨othlisberger et al.
(2019).
and 1 b show two examples of RRWPs and how they are composed of several propagating RWPs. That such synoptic situations foster persistent surface weather has been summarised by R¨othlisberger et al. (2019) and Ali et al. (2021), and has been observed in relation to previous weather extremes. For example, the heat wave in Russia in 2010 was associated with an approaching sequence of wave packets and persistent surface weather (Fragkoulidis et al., 2018). Furthermore, recurrent synoptic-scale wave packages caused a long-lasting cold spell in the Midwest of the U.S. (Davies, 2015). And lastly, Barton et al. (2016) demonstrated the influence of RRWPs on temporally clustered precipitation events in the Alps.
1.2.1 RRWPs and jet streams
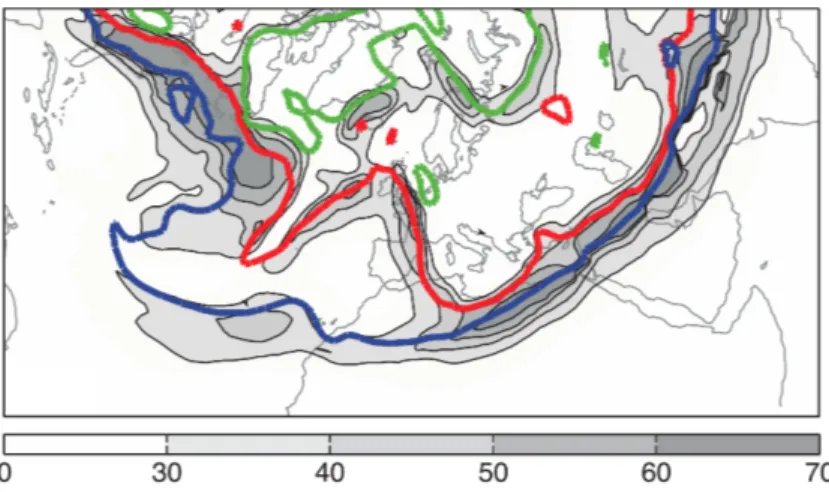
RWPs propagate along upper-tropospheric jet streams that serve as waveguide in order to avoid energy loss from meridional dispersion (Martius et al., 2010). Consequently, jet streams and their climatology are important when assessing the climatology of RRWPs. A jet stream is a narrow and fast-flowing band in the upper troposphere that shows large-amplitude meanders and circumnavigates almost the whole globe (Koch et al., 2006). The jet streams are most pronounced in winter and since the jet’s waveguidability increases with its amplitude (Wirth, 2020), RWPs are best sustained in winter. Studies by Chang and Yu (1999), Koch et al. (2006) and Martius et al. (2010) suggest that multiple jet streams can occur simultaneously in the same longitudinal band. According to Martius et al. (2010) three upper-tropospheric jets coexist on the Northern Hemisphere; the subtropical, extratropical and Arctic jet, which follow the intersection of the dynamical tropopause with the 340, 320 and 300 K isentrope, respectively. Figure 2 illustrates the courses of these three intersections together with the wind velocity at the dynamical tropopause on 20thJanuary 2001 at 12 UTC. Interestingly, the meridional alignment of the jets is very different depending on the geographical region. Over the western North Atlantic, the jets unite to one deep vertically aligned jet stream, while they split over the eastern North Atlantic until the extratropical and subtropical jet merge again over North Africa. Figure 2 only shows the Euro- Atlantic sector, the transient vertical superstition of the jets, however, is also a frequent feature over the Eastern Pacific (Riehl, 1962). Chang and Yu (1999) describe the course of the upper-tropospheric waveguide similarly to the setting in Figure 2 as one coherent waveguide over North America and a bifurcated waveguide over Europe and Asia. Moreover, Koch et al. (2006) conclude that deep jet events are more frequent over the eastern North American continent and the western North Atlantic than over Europe and North Africa, where usually shallow jet events occur. These findings are in accordance with vertically aligned jets over North America and the western North Atlantic and split waveguides over Europe and Africa.
Figure 2: Illustration of the wind velocity (shading, m s−1) at the dynamical tropopause (2-PVU isosurface) on 12 UTC 20th January 2001. The contours represent the intersection of the dynamical tropopause with the 340 (blue), 320 (red) and 300 K (green) isentropes, respectively. Taken from Martius et al. (2010).
RWPs are typically excited by baroclinic growth of an initial disturbances (Souders et al., 2014) and therefore closely tied to storm tracks (Blackmon et al., 1984). Storm tracks are regions in which extratropical cyclones are statistically most frequent in the midlatitudes (Hoskins & Hodges, 2002, 2005), i.e., the North Atlantic, North Pacific and Southern Oceans, and the Mediterranean Sea (Shaw et al., 2016). In storm tracks, the RWPs intensify in bursts along with cyclones as they propagate along the waveguide (Souders et al., 2014). The storm tracks reach their maximum intensity during winter when the surface baroclinicity is largest, and are weakest in summer when the baroclinicity is weakest (Chang et al., 2002). All in all, the jet stream dynamics including spatiotemporal maxima and linkages to the midlatitude storm tracks are of central importance when assessing the behaviour and possible modulations of RRWPs in the 21st century.
1.2.2 Changing Rossby wave characteristics and their significance for RRWPs
As a response to global warming, RRWPs might change in future in terms of frequency, amplitude and location. Since RRWPs are closely linked to the jet streams, findings of previous studies assessing possible changes in the jet stream climatology in the course of the 21st century are discussed here.
A mechanism that might change the climatology of jet streams and thereby also the Rossby wave propagation in the midlatitudes is the Arctic amplification, i.e., the phenomenon of surface temperature increasing twice as fast in the Arctic as compared to the Northern Hemisphere average (Barnes &
Screen, 2015; Serreze & Francis, 2006). Model evidence strongly suggests that the Arctic amplification can influence the midlatitude jet stream, however, it remains unclear how this mechanism works and
if the Arctic warming has influenced or will influence the jet stream (Barnes & Screen, 2015). Some climate models show a poleward shift of the jet stream and an associated decrease in the atmospheric blocking frequency as a response to the Arctic warming (Barnes & Polvani, 2013; Meehl et al., 2007;
Woollings & Blackburn, 2012). This poleward shift has been linked to the predicted large warming of the tropical upper troposphere and the associated increasing meridional upper-tropospheric temperature gradient (Held, 1993). However, many other studies claim that, similarly to a negative NAO phase, the jet stream weakens and shifts equatorward in winter as a response to the enhanced warming in the Arctic (Butler et al., 2010; Deser et al., 2010; Peings & Magnusdottir, 2014; Screen et al., 2013).
Moreover, the intensively discussed observational study of Francis and Vavrus (2012) suggests that the weakening of the meridional surface temperature gradient leads to slower moving Rossby waves of larger amplitude and larger north-south undulations. Consequently, persistent weather patterns and associated extreme weather events will become more frequent as the above-average warming of the Arctic progresses. Coumou et al. (2014) present similar findings and further argue a weaker meridional surface temperature gradient favours a double jet setting in the midlatitudes. This setting is more likely to occur in summer and can foster persistent weather patterns through resonant amplifications of planetary waves (Coumou et al., 2014). The contradictory results of the studies above is largely due to the uncertainty regarding the relative importance of the meridional temperature gradient at the surface and the upper-troposphere, respectively, for the jet stream modulation (Barnes & Screen, 2015). Although there have been some studies (Barnes & Polvani, 2015; Butler et al., 2010; Deser et al., 2015; Haarsma et al., 2014; Harvey et al., 2013) that assessed this issue, it is still uncertain which effect will ultimately have the larger influence on jet stream’s position (Barnes & Screen, 2015).
Peings et al. (2017) assessed the end-of-the-century atmospheric changes in the Climate Earth System Model (CESM) Large Ensemble, which the simulations used in this thesis are based on, by comparing a historic (1971 - 2010) to an end-of-the-century period (2081 - 2100). They find that the westerlies in the midlatitudes will be substantially weaker over the Asian and North Pacific, and the jet stream will be shifted poleward over the North American and Euro-Atlantic sector in end-of-the-century summers.
Furthermore, the waviness of the jet stream and the blocking frequency will increase over Asia and the North Pacific, while the opposite is true for North American and the Euro-Atlantic sector. Hot spells in Europe and Asia are expected to become more frequent, intense and persistent, as Meehl and Tebaldi (2004) conclude as well. Interestingly, Peings et al. (2017) suggests that in Europe, this change is not due to dynamical, but rather due to thermodynamic processes such as the soil moisture feedback.
In Asia, however, the dynamical processes seem to be driving the increase in the hot spell frequency, intensity and duration. As the CESM Large Ensemble simulates a strong Arctic amplification, Peings et al. (2017) suggests that the atmospheric response simulated in Asia might be following the mechanism
proposed by Francis and Vavrus (2012). However, to ultimately confirm this hypothesis there and in different locations further studies are needed.
Since the response of the jet streams to the Arctic amplification is highly debated, it remains uncertain how and if the climatology of RRWPs will change in the course of the 21st century. However, possible future changes in the jet stream’s intensity and position would certainly affect the climatology of RRWPs. According to Francis and Vavrus (2012) a weaker meridional surface temperature gradient would translate into Rossby waves of higher amplitudes, which would probably imply an increase in RRWP events. However, a weaker surface temperature gradient is also associated with weaker storm tracks in which RWPs typically amplify (Held, 1993; Souders et al., 2014). In CESM, the jet waviness increases (decreases) over certain longitude sectors in the end-of-the-century climate (Peings et al., 2017), which might imply a higher (lower) RRWP frequency in the respective sectors. Furthermore, the poleward shift of the jet stream in CESM (Peings et al., 2017) could be associated with changes in the spatial distribution of RRWP events.
1.3 Objectives
Overall, individual heat waves were studied extensively and have lead to an increased understanding of their dynamical (e.g., blocking) and thermodynamic (e.g., soil moisture coupling) drivers. However, the meteorological processes behind extreme temperatures on the seasonal timescale are less well- known. Considering that RRWPs can act on the weekly to monthly timescale, we hypothesize that they affect the occurrence of extremely hot summers in the midlatitudes. The aim of this master thesis is to quantify the link between RRWPs and extremely hot summers in order to better understand the dynamical processes behind them. Further we will assess if and how the effect of RRWPs will change due to climate change by studying this link in present-day (1990 - 1999) and end-of-the-century (2091 - 2100) climate simulations by CESM.
Specific research questions are:
1. How well are RRWPs represented in CESM as compared to ERA5 reanalysis?
2. How large is the effect of RRWPs on the odds of the occurrence of an extremely hot summer?
3. How is the link between RRWPs an the occurrence of extremely hot summers affected by global warming towards the end of this century?
These research questions will be addressed using ERA5 reanalysis data as well as CESM simulations (cf. Section 2 for a detailed description of the data, as well as our measure for RRWPs). First, a series of case studies of RRWPs in both data sets is performed (Section 4), then we extend the analysis with a grid point-wise logistic regression model. A discussion of our results is presented in Section 6 before summarising our main findings in Section 7.
2 Data & Methods
2.1 Data
2.1.1 CESM
For the investigation of the synoptic evolution of RRWPs and their effect on the odds of the occurrence of extremely hot summers, we use present-day and end-of-the-century simulations of the Community Earth System Model version 1 (CESM; Hurrell et al., 2013). In CESM, the atmospheric variables are available on 30 vertical levels and at approximately 1°horizontal resolution.
The simulations used in this thesis were produced using restart files from the CESM Large Ensemble project (CESM-LE) as described in R¨othlisberger et al. (2020). From the 35 original CESM-LE mem- bers (Kay et al., 2015) we reran the periods 1990 - 1999 (hereafter referred to as present-day) and 2091 - 2100 (hereafter referred to as end-of-the-century). This set of 35 ensemble members will be re- ferred to as macro ensemble for both periods. To further increase the number of seasons available for analyses we initialize a ”micro” ensemble with restart files generated from the original CESM-LE member 1 on 1st January 1980 for the present-day period, and on 1st January 2081 for the end-of- the-century period. These micro ensembles, each containing another 35 members, are initialized by addingO(10−13) perturbations to the temperature field at the respective starting date and are then integrated until 31st December 1999 for the present-day period and until 31st December 2100 for the end-of-the-century period. After 10 years of model integration, the ensemble spread in the micro en- semble is virtually indistinguishable from the macro ensemble spread (Fischer et al., 2013) and for both periods, the micro ensemble members can thus be regarded as additional 35 independent mem- bers, yielding a total of 70 ensemble member per period, i.e., 700 years of simulated data per period.
In both periods, the ensemble members provide 6-hourly output.
Extremely hot summers in the present-day and end-of-the-century period are defined as summers with a seasonal mean temperature greater than or equal to the 95th percentile of all summer mean values in the the 700 CESM members in the respective period. Further, the hot days of a specific summer season are defined as daily mean temperature anomalies of more than +1σ with respect to the local daily temperature distribution over the respective summer.
2.1.2 ERA5
In order to validate the CESM data we use ERA5, the latest reanalysis from the European Center for Medium-Range Weather Forecasts (ECMWF; Hersbach et al., 2020). ERA5 covers the time period 1979 to present by combining historical observations and modelling to produce global climate estimates. The data assimilation of ERA5 uses the current version of the Integrated Forecasting System (IFS Cycle 41rI) and provides hourly output at 0.5°horizontal resolution on 137 vertical levels up to 0.01 hPa. In order to apply the metricR on ERA5, first 6-hourly means of the meridional wind are calculated.
2.2 Methods
2.2.1 The metric R
We use the metric R introduced by R¨othlisberger et al. (2019) to identify RRWPs in this thesis.
This metric is calculated from the 6-hourly 250-hPa meridional wind averaged between 35°N and 65° N vma(λ, t), which is function of longitude λ and time t. R is computed in three steps, which are illustrated in Figure 1 at the example of the RRWP events described by Barton et al. (2016) and Davies (2015). First, a time filter with a width of 14.25 days, i.e., roughly two synoptic scale Rossby wave periods (Chang & Yu, 1999) is applied tovma(λ, t) to identify signalsvf t(λ, t) that last longer than synoptic timescales (Fig. 1 c, d). In a second step, vtf(λ, t) is filtered for synoptic wavenumber (4-15) signals by applying a Fourier series decomposition, since we are only interested in synoptic-scale waves. The resulting fieldvtf, wnf(λ, t) describes the contribution of synoptic-scale wavenumbers tovtf
(Fig. 1 e, f). In a final step, the metricR(λ, t) is computed as the envelope of the previously calculated fieldvtf, wnf(λ, t) according to the algorithm of Zimin et al. (2003):
R(λ, t) = 2
15
X
k=4
ˆ
vtf(k, t)e2πiklλ/N
, (2)
where ˆvtf(k, t) is the Fourier coefficient ofvtf for the wavenumberkand time stept, N is the number of longitudinal grind points, andlλ is the longitudinal grid point index for longitudeλ(Fig. 1 g, h).
According to the definition ofR, not only RRWPs could induce large values ofR, but also persistent stationary synoptic-wavenumber waves. However, R climatologically exhibits longitudinal variations and shows distinct maxima in regions where transient synoptic-scale wave packets occur most frequently and attain the largest amplitudes (Glatt & Wirth, 2014; Souders et al., 2014). This underlines that large
values ofRare linked to synoptic-scale RWPs and shows that hemispheric persistent stationary waves are not the primary cause of largeR values. Even so, the fact that persistent stationary hemispheric wave patterns can contribute toR has to be considered as a caveat of the metricR. Another caveat of this method are long lived and stationary RWPs that produce high R values, although they are not preceded or followed by other wave packets and therefore do not constitute an RRWP. However, based on several case studies R¨othlisberger et al. (2019) conclude that despite these caveats, prolonged periods (i.e., one or several weeks) of largeR values are a suitable measure to identify RRWP events.
We thus define an RRWP event/day as periods of dailyR ≥10 m s−1 in both data sets.
2.2.2 Logistic regression
To quantify the effect of RRWPs on the odds of the occurrence of extremely hot summers, we use a logistic regression as described in Wilks (2019). Logistic regression models are used when dealing with binary predictands. The formal form of a logistic regression model is:
ln p
1−p
=b0+b1x1+...+bKxK, (3)
wherexKare the predictors,bKare the logistic regression coefficients, and p and1−pp are the probability and the odds of the predictand being 1, respectively. We fit the logistic regression model to the data similarly to Mahlstein et al. (2012). First, we transform the occurrence of extremely hot summers into a binary variable at each grid point: 1 for the observation of an extremely hot summer and 0 for no observation of an extremely hot summer. Next, for each grid point, a logistic regression model of the following form is fitted to the time series:
ln p
1−p
=b0+b1x, (4)
wherexis the predictor, quantifying in some form the occurrence of RRWPs based on the metric R (the exact choice of the covariate is discussed below),b0andb1are the logistic regression coefficients, and p and 1−pp are the probability and the odds of the occurrence of an extremely hot summer being observed, respectively. For reasons elucidated in the case study section (Section 4), we fit the model in two different ways. In a first set-up, we quantify the effect RRWPs on the odds of extremely hot summers occurring collocated with the RRWPs (hereafter referred to as the collocated model). In a second set-up, we quantify the effect of RRWPs on the odds of the occurrence of extremely hot
summers further downstream (hereafter denoted the upstream model). In the collocated model, the predictorxis averaged over an collocated longitude range (±15°), whereas in the upstream model, it is averaged over the upstream longitude range from -50° to -20°. The longitudinal ranges in the two models correspond roughly to the extents of single upper-level troughs and ridges (30°) and since they do not overlap, collocated and upstream are clearly distinguishable. Each model is implemented in two distinct ways, with either the seasonal daily RRWP frequency or the seasonal meanR serving as predictor x, yielding a total of four distinct model implementations, each with just one of these four predictors as covariates. The influence of the different predictors on the occurrence of extremely hot summers will be quantified by the percentage change in the odds due to a unit change in the predictor.
First, the logistic regression coefficientb1 has to be estimated in order to obtain this measure. Next, the percentage change in the odds for each unit increase or decrease in the predictor can be calculated according to DeMaris (1995):
change in the odds = 100·(eβ1−1) (5)
We assess the significance of the odds changes in a two-step approach. First we test at each grid point whether the odds changes are significantly different from zero with a z-test. Then, in a second step, we control the number of falsely rejected null hypotheses by applying the false-discovery rate test of Benjamini and Hochberg (1995) to the field of p-values obtained from the first step, where we use a maximum false discovery rate of 0.1 as suggested by Wilks (2016).
3 Model verification
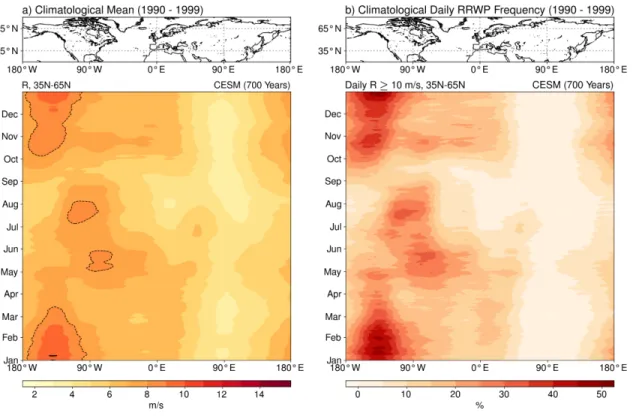
In this Section, we will assess how well CESM represents RRWPs in terms of location, season and frequency. To this aim we study the climatologies ofRand the RRWP frequency in CESM (700 years) and compare it to the corresponding climatologies in ERA5 (40 years). The climatologies ofRand the RRWP frequency are in general very similar (Fig. 3). Both show maxima over the North Pacific storm track from October to March. Over the North Atlantic storm tracks, the climatological mean ofRand the daily RRWP frequency in the CESM present-day simulations reach their maxima in November, however, these maxima (up to 7 m s−1and 30%) are much lower than the maxima seen over the North Pacific storm track (up to 10 m s−1 and 50%). In general, both variables show larger values in winter than in summer. The largest values outside of winter and autumn are found over North America and the western North Atlantic between May and August (up to 8 m s−1 and 35%). Furthermore, in all seasons, considerably lower values are observed over the eastern North Atlantic and Europe than over the North Pacific and North America.
Figure 3: Average of (a) the metric R and (b) the daily RRWP frequency over the 700 years of CESM present-day simulations. For both variables,Ris averaged between 35°N and 65°N and an RRWP day is defined as a day with anRvalue≥ 10m s−1. In (a), theR = 8 m s−1 andR = 10 m s−1contours are indicated by the dashed and solid black lines, respectively.
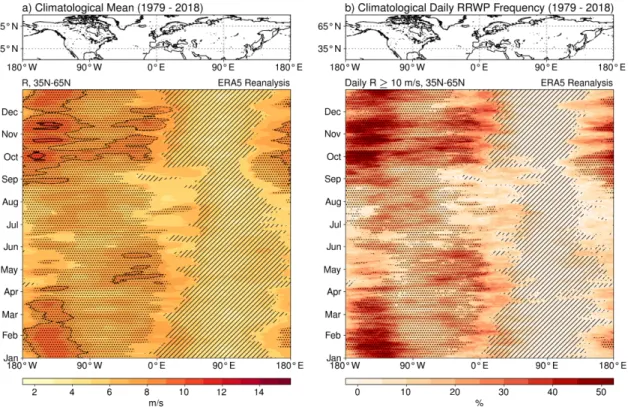
In order to further evaluate the climatologies ofR and the daily RRWP frequency in CESM, they are compared to the corresponding climatologies in ERA5 (Fig. 4). As in CESM, these climatologies are rather similar. Furthermore, both variables show distinct maxima over the North Pacific storm track in autumn, winter and spring (up to 10 m s−1and 50%). In contrast to CESM, similar large values are associated with the North Atlantic storm track (up to 9 m s−1and 45%). To increase the comparability of the two data sets of different period length (40 and 700 years, respectively), we (i) randomly choose four CESM members (40 years) and calculate their climatology 100 times; (ii) calculate the percentiles of the 100 samples; and (iii) asses whether the 40 year ERA5 average lies below the 5th or above the 95thpercentile of this set of samples, respectively, to estimate the significance of the differences. Both the climatological meanR(Fig. 4 a) and the daily RRWP frequency (Fig. 4 b) are significantly lower over the North Pacific and North America in CESM than in ERA5. Over central and eastern Asia, on the other hand,Rand the daily RRWP frequency show climatologically higher values in CESM than in ERA5. The climatologies of ERA5 and CESM agree best with each other over Europe. Temporally, the differences between the data sets are smallest in summer. Overall, CESM underestimatesRand the frequency in some regions and overestimates them in others according to the climatology comparison with ERA5. Globally, CESM seems to rather underestimate R and the frequency of RRWP events than overestimate them. In Figures A1 and A2, ERA5 is compared to the 10th, 25th, 90th, and 95th percentiles. However, since the 10th, 25th and 90th, and 95th lie close to the 5thand 95th, respectively, these additional comparisons do not differ much from those in Figure 4.
Since this thesis investigates the link between RRWPs and extremely hot summers, the temporal and spatial variability of RRWP events in summer is most important. In summer, both CESM and ERA5 show the largest daily RRWP frequencies over the North Pacific and North America (Fig. 5). Other local maxima are found over the North Atlantic and Europe, while the daily RRWP frequency over Asia is close to zero in both datasets and does not aquire values larger than∼25% in individual years.
Interestingly, the spread of the daily RRWP frequency in individual summers over North America and Europe is much larger in CESM than in ERA5. This results from some CESM members showing extremely high daily RRWP frequencies of 50 - 95% over North America, while they are more in line with the ERA5 summers over Europe. Furthermore, CESM shows a much more distinct peak and also significantly larger average RRWP frequencies over North America for some summers than ERA5.
However, these differences are most likely due to bias resulting from comparing 700 years to 40 years, since we know that CESM underestimates the daily RRWP frequency over North America (Fig. 4 b).
Overall, when comparing the climatologies ofR and the daily RRWP frequency between the ERA5 and CESM, the largest differences between the two data sets are found over North America and Asia, where CESM over- and underestimatesRand the daily RRWP frequency, respectively (Fig. 4).
Figure 4: Same as Fig. 3, but for ERA5 and the period 1979 - 2018. The hatched and stippled areas indicate when the climatological meanR(a) and daily RRWP frequency (b) in ERA5 deceeds the 5th percentile and exceeds the 95th percentile of the 100 CESM samples, respectively.
Figure 5: The seasonal frequency of RRWP days (dailyR ≥ 10 m s−1) in (a) all summers 1979 - 2018 in ERA5 (green), and (b) all 700 present-day summers in CESM (blue). The respective averages are shown in (a) grey and (b) black.
Globally, there are more regions in which CESM underestimatesRand the frequency of RRWP events.
Although CESM and ERA5 agree best in summer (Fig. 4), the daily RRWP frequency in summer still shows much larger longitudinal variation in its spread in CESM than in ERA5 (Fig. 5). Although there are some obvious discrepancies between CESM and ERA5, CESM overall shows plausible climatologies ofRand the daily RRWP frequency. Maxima of both variables are found over the North Pacific storm track in winter, which is in accordance with RWPs amplifying in the storm tracks that reach their maximum intensity in winter (Fig. 3; Chang et al. (2002), Souders et al. (2014)). Furthermore, over all longitudes,Rand the daily RRWP frequency show larger values in winter. This agrees with the higher intensity of the storm tracks (Chang et al., 2002), better waveguidablity of the jet stream (Wirth, 2020) and the increased amplitudes of RWPs associated with high surface baroclinicity in winter (Fragkoulidis & Wirth, 2020). To conclude, the climatologies ofR and the daily RRWP frequency in CESM is globally neither inherently under- nor overestimated, represent the seasonal variability in the surface baroclinicity and show the North Pacific as hot spot region. Therefore, it can be assumed that CESM represents RRWP events reasonably enough for the purposes of this thesis. Next, we investigate three extremely hot summers that are associated with RRWPs in both data sets.
4 Case studies
4.1 Summer 1983
In summer 1983, extreme temperatures and drought were observed in the U.S. particularly affecting the central and south-western U.S. (Chaston, 1984). According to R¨othlisberger et al. (2021) the North American summer of 1983 ranks fifth with regard to affected land area within all midlatitude extreme summer events in the ERA-Interim period. Interestingly, summer 1983 started off rather cold with June 1983 being the eighth coldest June in the 53 years of record (Ropelewski, 1984). However, hot temperatures then intensified over the course of July and August 1983, averaging at +1 - 2°C in July and at +3 - 4°C in August (Wendland et al., 1984) - the hottest August on record in the midwestern U.S. and south-central Canada (Ropelewski, 1984). Like in 1936 and 1980, a quasi-stationary upper- level ridge was responsible for the persistent hot and dry weather in summer 1983 (Chaston, 1984).
Since the extremely hot summer 1983 was a consequence of persistent atmospheric conditions, it is no surprise that this summer was linked to an RRWP.
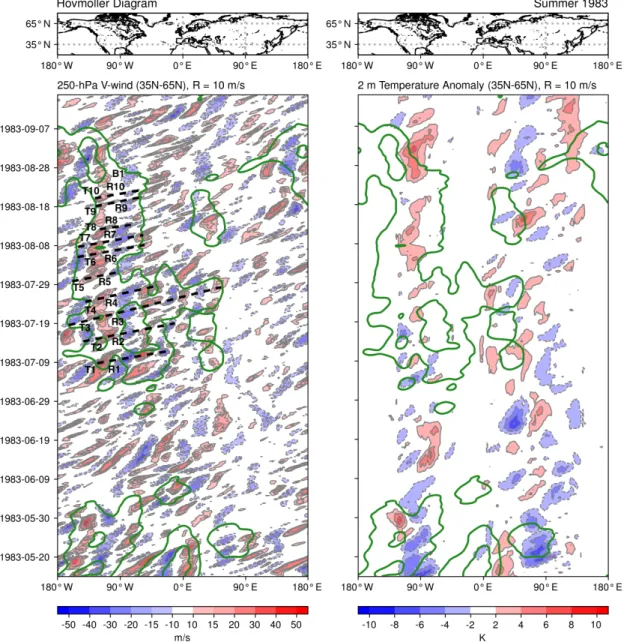
At least 10 RWPs propagated in phase over the U.S. in July and August 1983 (Fig. 6). The RWPs thereby recurrently amplified at the same longitudes over the North Pacific and the North American continent and consequently led to recurrent upper-level conditions. We identify a sequence of 10 upper- level troughs (T1 - T10) and ridges (R1 - R10) positioned over the eastern North Pacific and North America, respectively. These trough-ridge couplets were associated with positive temperature anomalies at the surface that occurred collocated with the upper-level ridges (Fig. 6). One process that fosters positive temperature anomalies within a trough-ridge couplet is the warm air advection related with the pressure gradient between an upper-level trough and ridge. In addition, the adiabatic subsidence below the ridge and the enhanced radiation due to the clear-sky conditions usually observed in the surface high beneath the ridge typically further increase the heating at the surface. Since the trough- ridge couplets repeatedly appeared over the same regions, the temperature anomalies were continuously reinforced and therefore persisted over several days or weeks. The recurrent upper level conditions over the North American continent also reflected in the highR values in July and August indicating an RRWP event (Fig. 6). After the passage of the 10 upper-level trough-ridge couplets, an atmospheric block (B1) appeared over the central U.S. associated with the typical dipole of positive meridional wind anomalies below, and negative anomalies downstream of the block, respectively (Fig. 6; Altenhoff et al.
(2008)). Since the scale of the blocking was within the synoptic (4 - 15) wavenumber range and because it persisted for several days, it produced large values ofR and is therefore identified as RRWP by the metricR.
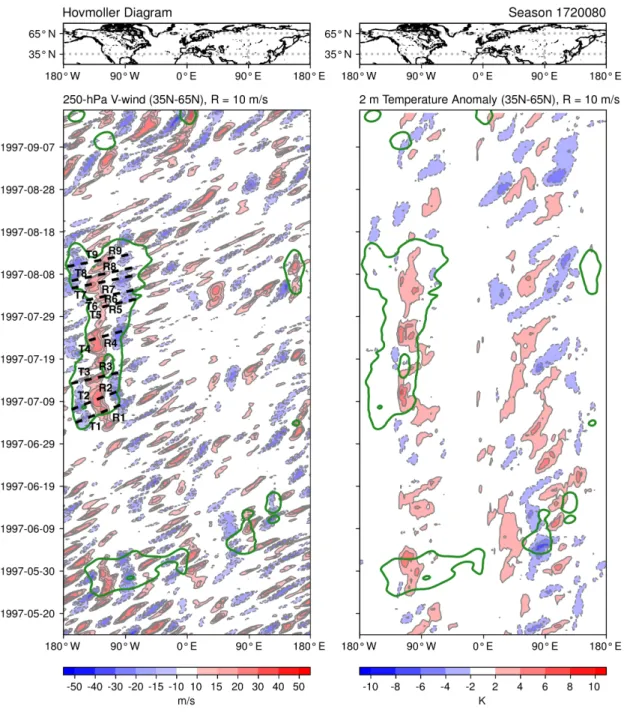
Figure 6: Hovm¨oller diagram of the 250 hPa meridional wind (left panel), 2 m temperature anomaly (right panel), respectively, averaged between 35°N and 65°N from 15th May to 15th September 1983.
The green contour corresponds toR= 10m s−1 and indicates RRWPs. In the left panel, at least 10 different RWPs (dashed lines) propagate over the U.S. in July and August leading to the recurrent amplification of 10 upper-level troughs (T1 - T10) and ridges (R1 - R10) over the western U.S. Further, in the end of August, an atmospheric block (B1) that is also associated with highRvalues is identified.
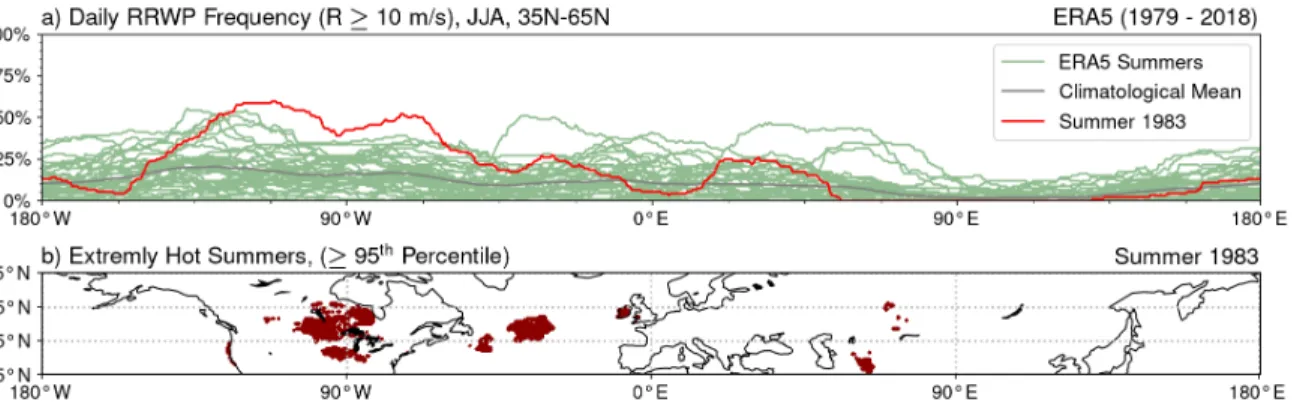
Figure 7 b displays the grid points experiencing an extremely hot summer in 1983, i.e., the grid points exhibiting one of their 5% hottest seasons in summer 1983. Note that we did not detrend the data, and thus an extreme summer so early in the record is remarkable. A large region in the Midwest and south-central Canada experienced an extremely hot summer in summer 1983, which is in agreement with the climatic reports of Chaston (1984), Ropelewski (1984) and Wendland et al. (1984) in which extreme temperatures were documented in the Midwest, the central U.S. and south-central Canada.
At the same time, the daily RRWP frequency over North America was (among) the highest over North American Continent in 1979 - 2018 (Fig. 7 a). The peak in the daily RRWP frequency was located over the western U.S. some degrees upstream of the region in the Midwest and south-central Canada, where the extremely hot summer occurred. However, in the Midwest, the daily RRWP frequency of summer 1983 was also considerably larger than the daily RRWP frequency of any other ERA5 summer.
Accordingly, it seems like the RRWP that coincided with the positive temperature anomalies in summer 1983 occurred upstream of and collocated with these anomalies.
Figure 7: Subfigure (a) shows the daily RRWP frequency in summers 1979 - 2018 (green lines), the climatological mean (grey line), and the daily RRWP frequency in summer 1983 (red line). An RRWP day is thereby defined as a day with anRvalue≥ 10 m s−1 averaged between 35°N - 65°N. Subfigure (b) shows all grid points experiencing one of their 5% hottest summers in 1983.
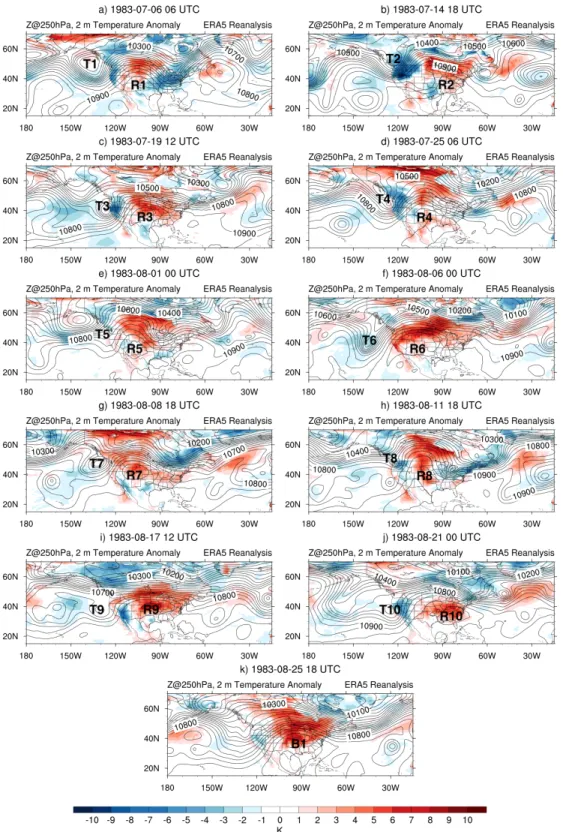
The synoptic evolution of the RRWP event in summer 1983 is displayed in Figure 8. On 6th July, the first upper-level trough-ridge (T1 & R1) couplet was located over the North Pacific and North America (Fig. 8 a). While T1 and R1 forced anomalously high temperatures in the Midwest and south-central Canada, the West Coast was more influenced by the cold air advection associated with T1 that was located over the eastern North Pacific. The temperature anomaly pattern forced by the first trough- ridge couplet, i.e., positive (negative) temperature anomalies located north-westward (south-eastward) to the ridge, was also induced by most of the other couplets (T2 & R2, T3 & R3, T4 & R4, T8 & R8, T9 & R9, T10 & R10) (Fig. 8 b, c, d, h, i, j). The positive temperature anomalies were mostly located in the midwestern, north-eastern U.S. and south-central Canada. However, due to the different orientation of R10, positive temperature anomalies were primarily induced in the south-eastern states (Fig. 8 j).
Figure 8: Instantaneous geotpotential height at 250 hPa (black contours) and the daily 2 m temperature anomaly (colours) during the RRWP event in summer 1983 with respect to the 1979 - 2017 climatology.
The subpanels (a - j) show selected time instances indicated in the title for each of the 10 trough-ridge couplets. Further, in late August, an atmospheric block (B1) was located over North America and also associated with highRvalues.
The atmospheric block B1 was much more consistent in its phasing than the trough-ridge couplets (not shown) and induced intense positive temperature anomalies in the midwestern U.S. and south- eastern Canada (Fig. 8 k). The temperature anomaly pattern induced by the trough-ridge couplets T5 & R5, T6 & R6 and T7 & R7 differed from the pattern of the other couplets, as it was not associated negative temperature anomalies south-eastward to the ridge (Fig. 8 e, f, g). Although the temperature anomaly pattern induced by the 10 upper-level ridges varied, all of them were associated with positive temperature anomalies in the midwestern U.S. and south-central Canada, where an extremely hot summer occurred in 1983 (Fig. 7 b). The upstream RRWP signal in summer 1983 was slightly stronger than the collocated RRWP signal, since all of the upper-level troughs and also some of the upper-level ridges amplified upstream of the region exhibiting an extremely hot summer (Figs. 7, 8). Since both an upstream and a collocated RRWP signal were prevalent in summer 1983, this case study serves as a first indication of a link between extremely hot summers and upstream and collocated RRWPs.
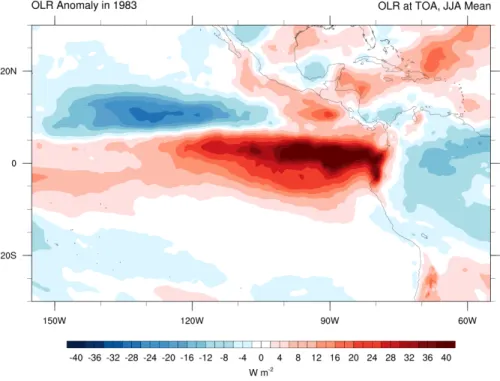
Figure 9: Seasonal mean anomaly in outgoing long wave radiation at the top of the atmosphere (OLR) in summer 1983 with respect to the 1979 - 2018 climatological mean.
Given the strong link of the RRWP with the extremely hot summer over the midwestern U.S. and south-central Canada in 1983, we have a closer look at a potential driver of that RRWP. In the preceding winter 1982/83, a strong El-Ni˜no-Southern Oscillation (ENSO) event occurred over the tropical Pacific (Quiroz, 1983). In summer 1983, a large positive out going long wave radiation (OLR) anomaly is visible in the Eastern Pacific (Fig. 9), implying lower than normal convection. Since typically not an El-Ni˜no
event, but a La-Ni˜na event, is associated with lower than normal convection in the Eastern Pacific (Rasmusson & Carpenter, 1982), this suggests the ending of the El-Ni˜no event and a transition to the La-Ni˜na phase. Interestingly, the Russian heat wave in 2010 has been linked to a preceding El- Ni˜no event in winter 2009/2010 followed by a rapid transition to a La-Ni˜na phase in summer 2010 (Schneidereit et al., 2012; Trenberth & Fasullo, 2012). According to Schneidereit et al. (2012) and Trenberth and Fasullo (2012) the La-Ni˜na signal in the tropical Pacific induced two quasi-stationary Rossby wave trains that propagated over the North Atlantic changing the stationary wave structure and supporting the persistent anticyclonic regime over Russia that fostered the heat wave. Moreover, Trenberth and Fasullo (2012) argue that this regime was additionally supported by a stronger than normal monsoon that interacted with the Rossby wave trains and resulted from the La-Ni˜na signal in the Indian Ocean. Since in summer 1983, a transition between the ENSO phases occurred in the tropical Pacific as in summer 2010, we hypothesise that the extremely hot summer occurring in North America could also be linked to the anomalous signals in the tropical Pacific. Similarly to summer 2010, the La-Ni˜na event in the tropical Pacific could have affected the stationary wave pattern that ultimately organised the transient RWPs into an RRWP, which then induced the extremely hot summer in the midwestern U.S. and south-central Canada.
4.2 A CESM extremely hot summer in North America
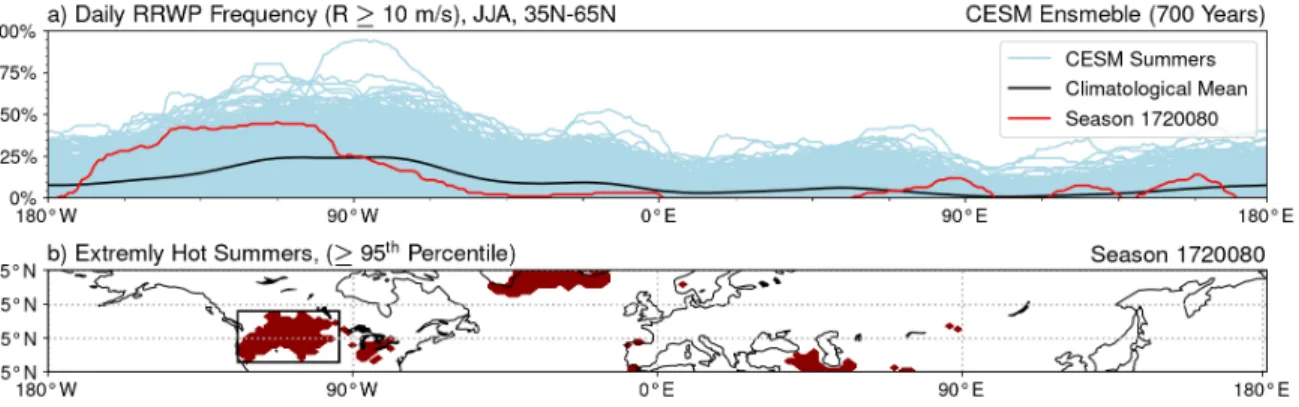
Season 1720080 corresponds to summer 1997 of the makro ensemble member number 8 (ma8). In this season, a large region in the western U.S. experienced one of their hottest 35 summers, i.e., the top 5%
of the 700 years CESM simulation (Fig. 10 b). The daily RRWP frequency in season 1720080 peaked over the western North American continent, but was also well above the CESM ensemble mean over the eastern North Pacific (Fig. 10 a). This implies that both upstream and collocated RRWPs might have had an influence on the occurrence of the extremely hot summer in the western U.S. In order to show the co-occurrence of the RRWPs and the extremely hot summer in a more quantitative manner, the percentage of hot days of season 17020080 coinciding with collocated RRWP days is calculated as follows: (i) we average the daily temperature in the central U.S. (black rectangle in Fig. 10 b) and (ii) calculate its seasonal mean in all 700 CESM members; next, (iii) we calculate the ensemble mean of the 700 seasonal means and its standard deviation; finally, (iv) hot days and collocated RRWP days in the western U.S. are defined as regionally averaged daily mean temperature anomalies of more than of more than +1σwith respect to the ensemble mean and regionally averaged dailyRanomalies equal or greater than 10 m s−1, respectively. The percentage of hot days coinciding with upstream an RRWP is calculated accordingly with the only difference that the daily R is averaged over the grid points 30°upstream of the black rectangle. According to these two calculations, 22 hot days were observed in season 1720080 and 100% of those days coincided with collocated and upstream RRWPs. Thus, in season 17020080, there is an apparent link between the extremely hot summer over the western U.S.
and collocated and upstream RRWP events.
Figure 11 shows two RRWP events occurring in season 1720080 over the U.S. Since the earlier of the two occurred mostly outside JJA, it will not be discussed here. The extreme temperatures coinciding with the RRWP event in July and early August, however, largely contributed to the extreme heat of season 1720080. During this RRWP event, at least nine RWPs propagated over the North American Continent (Fig. 11). The RWPs were associated with nine upper-level troughs (T1 - T9) and ridges (R1 - R9) that recurrently appeared over the North Pacific and the western U.S., respectively. Similarly to summer 1983, positive temperature anomalies are induced collocated with the upper-level ridges, which typically result from the temperature advection associated with the upper-level trough-ridge couplets and the adiabatic subsidence, and enhanced solar isolation below the upper-level ridges (Fig. 11).
Figure 12 displays the synoptic evolution of the RRWP event for season 1720080. The first two upper- level troughs (T1, T2) and ridges (R1, R2) appeared over the eastern North Pacific and North America, respectively (Fig. 12 a, b). Due to the similar phasing of the couplets, they induced the same temper- ature pattern with positive temperature anomalies located in the western U.S. Accordingly, the tem-
Figure 10: Same as Fig. 7, but for summer 1997 in CESM member ma8. Thus, the daily RRWP frequency of individual summers (blue/red) and their average (black) in (a) is shown for all 700 years.
The black rectangle marks the region of the extremely hot summer over the western U.S.
perature anomalies constantly reinforced and thus amplified with time. The next two trough-ridge couplets (T3 & R3, T4 & R4) also were very similar in structure and position and fostered amplified positive temperature anomalies in the western and north-western U.S. (Fig. 12 c, d). As R5, R6 and R7 had a larger extent than the previous ridges, they additionally induced positive temperature an- omalies in the midwestern and eastern U.S. (Fig. 12 e, f, g). R8, and R9 were again of smaller extent and located over the western U.S. (Fig. 12 h, i). Thus, trough-ridge couplets T7 & R7, T8 & R8 and T9 & R9 were associated with a temperature pattern similar to those of the first four couplets with positive temperature anomalies primarily located in the western and north-western U.S.
Season 1720080 was associated with one RRWP event, during which nine upper-level trough-ridge couplets propagate over the eastern North Pacific and North America. The positive temperature an- omalies induced by the nine trough-ridge couplets mostly were located in the western U.S., which is consistent with the occurrence of an extremely hot summer in this region (Fig. 10 b). In season 1720080, the RRWP frequency peaked collocated with the region experiencing an extremely hot sum- mer over the western U.S., but also showed elevated values over the eastern North Pacific (Fig. 10 a).
The collocated RRWP signal was stronger, because of the the upper-level ridges that occurred colloc- ated with the region experiencing an extremely hot summer generally were of larger amplitude and also vary less in their phasing than the upper-level ridges that lied upstream of that region (Fig. 11).
As a consequence, the upper-level ridges were associated with higher R values than the upper-level troughs and the collocated RRWP signal was slightly more prevalent than the upstream signal. How- ever, since the extremely hot summer in season 1730080 was also associated with an upstream RRWP signal, this case study implies a link between extremely hot summers and collocated and upstream RRWPs.
Figure 11: The same as Fig. 6, but for summer 1997 in ma8. Here, we identify nine recurrent RWPs (dashed lines) with associated upper-level troughs (T1 - T9) and ridges (R1 - R9).
Figure 12: The same as Fig. 8, but for T1 - T9 and R1 - R9 of the RRWP event in summer 1997 of member ma8.
4.3 A CESM extremely hot summer in Europe
Season 1620271 corresponds to summer 1996 in the mikro ensemble member number 27 (mi27) in which an extremely hot summer occurred in Europe (Fig. 13 b). In contrast to season 1720080, the peak in the daily RRWP frequency curve in season 1620271 was located upstream of the region exhibiting an extremely hot summer (Fig. 13 a). However, the daily RRWP frequency also showed elevated values around 0°E and 30°E. As in 1720080, the percentages of hot days that coincided with an upstream or collocated RRWP day in Europe (black rectangle, Fig. 13 b) is calculated. In season 1620271, 73% and 29% of the 15 observed hot days coincided with an upstream and collocated RRWP day, respectively, suggesting that the extremely hot summer in Europe during season 1620271 was predominately associ- ated with upstream RRWPs. In season 1620271, two RRWP events occurred over Europe (Fig. 14). The first event was associated with a quasi-stationary blocking inducing collocated positive temperature anomalies, which typically result from the subsidence and enhance solar isolation within a atmospheric block (Pfahl & Wernli, 2012). During the RRWP event in July, at least seven RWPs propagated in phase from North America to Europe and were associated with seven trough-ridge couplets (T1 & R1 - T7 & R7). As in the case studies of the North American continent, common meteorological reasoning suggests that these positive surface temperature anomalies resulted from warm air advection, subsid- ence, and enhanced solar radiation.
Figure 13: Same as Fig. 7, but for summer 1996 in CESM member mi27. Thus, the daily RRWP frequency of individual summers (blue/red) and their average (black) in (a) is shown for all 700 years.
The black rectangle marks the region of the extremely hot summer in Europe
Figure 15 shows the synoptic evolution of the two RRWP events occurring in season 1620271. On 1st June, an atmospheric block (B1) was located over the Iberian Peninsula associated with the typical dipole of positive meridional wind anomalies below, and negative anomalies downstream of the block, respectively (Figs. 15 a; Altenhoff et al. (2008)). As in the case study of summer 1983, the positive meridional wind signal was identified as RRWP by the metricR. The negative meridional wind signal,
Figure 14: The same as Fig. 6, but for summer 1996 in mi27. Here, we identify seven recurrent RWPs (dashed lines) upper-level troughs (T1 - T7) and ridges (R1 - R7). Further, in the beginning of June, an atmospheric block (B1) was located over Europe and also associated with highRvalues.
however, was weaker and therefore did not fit the criteria of an RRWP. Positive temperature anomalies primarily occurred in the Iberian Peninsula, France, the UK, and Ireland. During the RRWP event in July, seven upper-level troughs (T1 - T7) and ridges (R1 - R7) occurred over the eastern Atlantic and Europe, respectively (Fig. 15 b - h). Since the positive temperature anomalies were mostly found collocated with the upper-level ridges, their occurrence depended on the ridges’ position. R1 was the only ridge located over southern Europe and north-western Africa and therefore induced a different temperature anomaly pattern than the other ridges with the strongest temperature anomalies occurring in Spain and Italy (Fig. 15 b). Most of the other ridges were either located over central (R2) or eastern Europe (R3, R6, R7) inducing temperature anomalies in the respective regions (Fig. 13 c, d, g, h). As the upstream flanks of R2, R3, R6 and R7 were located over parts of southern and western Europe, the warm air advection associated with the pressure gradient between the upper-level troughs and ridges resulted in positive temperature anomalies in these regions. R4 and R5 are both located over central and eastern Europe and due to their large extent they were associated with positive temperature anomalies in southern, western, central and eastern Europe (Fig. 15 e, f).
The RRWP events of season 1620271 were characterized by either a quasi stationary omega block or the recurrence of trough-ridge couplets. The regions mostly affected by extreme temperatures associated with the RRWP events also appear in Figure 13 b as regions that exhibited an extremely hot summer in season 1620271. In contrast to the other two summers, summer 1620271 showed almost no collocated, but a very large upstream RRWP signal (Fig. 13). This difference is due to the largerRvalues associated with the upper-level troughs that recurrently amplified upstream of Europe over the eastern North Atlantic, while the upper-level ridges over central and eastern Europe produced a less recurrent signal (Fig. 14). As the two other case studies, the case study of season 1620271 also implies a link between extremely hot summers and upstream and collocated RRWPs. However, different to the other two case studies, the upstream RRWP signal is much stronger than the collocated one in season 1620271.
Motivated by the foregoing case studies, we now investigate the climatological effect of RRWPs (as inferred from the metricR) on the odds of extreme summer occurrences in the next section.
Figure 15: The same as Fig. 8, but for B1, T1 - T7 and R1 - R7 of the RRWP event in summer 1996 of member mi27.
5 Logistic model
In this Section, a logistic regression model is applied to the CESM data in order to quantify the link between RRWPs and the occurrence of extremely hot summers in the present-day and end-of-the- century period. From the case studies in Section 4, we learn that in extremely hot summers, collocated and upstream RRWPs can be observed. Therefore, we will investigate the change in the odds of the occurrence of extremely hot summers for the upstream and collocated models (cf. Section 2.2.2) if (i) one RRWP day more is observed or (ii) the seasonal mean R is increased by 0.1 m s−1. Further we test the sensitivity of these results to the longitudinal range and the intraseasonal variability of R. Appendices B and C include additional models assessing a longitudinal range of 60° and using the seasonal median R as predictor, respectively. The results of the 60°-models are very similar to those of the 30°-models with the only difference that in the 60°-models, the effects of RRWPs are generally stronger and more extensive (cf. Figs. B1 - B4). Using the season medianR as covariate in the collocated or upstream model yields similar, but slightly weaker and less extensive, responses as the seasonal meanR (cf. Figs. C1 - C2).
5.1 Logistic model for the present-day period (1990 - 1999)
The change in the odds of the occurrence of an extremely hot summer due to the appearance of collocated RRWPs are shown in Figure 16. For both covariates, the strongest positive link between collocated RRWPs and extremely hot summers is found in the region of the Urals and the Caspian Sea (up to +18%). Further, the effect of collocated RRWPs is large over the western U.S. (up to +16%).
This is in accordance with the findings of the case study of summer 1720080 in which several upper- level ridges recurrently appeared over the western U.S. and induced collocated temperature extremes (cf. Section 4.2). Moreover, collocated RRWPs have a positive effect on the occurrence of extremely hot summers in some midwestern areas (up to +8%), which is consistent with the findings of the case study investigating summer 1983 (cf. Section 4.1). Interestingly, the distance between the regions showing significant responses to RRWPs over North America and the western North Atlantic is roughly 30°, which corresponds to the distance between upper-level troughs and ridges in Rossby waves. This suggests that RWPs over North America amplify in a preferred phase and that the resulting RRWPs significantly affect the occurrence of extremely hot summers in the collocated regions. Furthermore, an RRWP over the western North Atlantic increases the odds of the occurrence of an extremely hot summer over the western North Atlantic and in Greenland by up to 10%. Over the eastern North Atlantic and the Iberian Peninsula, the collocated daily RRWP frequency and seasonal meanRdecrease
the odds of the occurrence of an extremely hot summer by up to 14% and 16%, respectively. This is accordance with the results of the case studies of summer 1620271 and 1020300 (cf. Section 4.3 and Figs. D1 - D3) in which the upper-level troughs over the eastern North Atlantic induced negative temperature anomalies in the Iberian Peninsula through northerly advection.
Depending on the choice of the covariate the results in the collocated model differ (Fig. 16). When discussing the differences between the covariates, it is important to consider that the observation of +1 RRWP day with a daily meanRof 10 m s−1 equals an increase in the seasonal meanRof 0.11 m s−1. Accordingly, a daily meanR of larger than 10 m s−1, e.g.R = 15 m s−1, results only in a +1 RRWP day signal, while the seasonal meanRincreases by approximately 0.16 m s−1. Thus, in regions, where a +1 RRWP day signal results in a larger change in the odds than an increase of 0.1 m s−1 in the seasonal meanR, the daily mean Ris mostly larger than 10 m s−1. Conversely, in regions, where an increase of 0.1 m s−1 in the seasonal meanR has the larger effect on the occurrence of an extremely hot summers than a +1 RRWP day signal, the daily meanR is generally smaller than 10 m s−1. In the collocated model, the largest differences between the two covariates are visible over the eastern North Atlantic, Europe and Asia (Fig. 16). Using the seasonal meanR as covariate yields larger areas of significantly negative and positive changes in the odds over the eastern North Atlantic, central Asia, eastern Europe, and the Urals. Thus, increases in the seasonal meanRare linked to more widespread extremely hot summers than increases of in the daily RRWP frequency. However, in small regions in Asia and over the eastern Atlantic, the changes in the odds are larger for the daily RRWP frequency (up to +/- 20%) as compared to the seasonal meanR (-8% to +14%). This suggests that in a few and spatially confined regions,Ris climatologically very high and therefore the effect of increases in the daily RRWP frequency on the occurrence of extremely hot summers is larger than for the seasonal meanR. In most regions of Eurasia, however,Ris climatologically rather low (Fig. 3 a), which results in larger areas of significant changes in the odds when using the seasonal mean R as covariate as compared to the daily RRWP frequency (Fig. 16).
As in the collocated model, both upstream covariates show an effect of upstream RRWPs in the north- western U.S. (up to +8%) demonstrating that extremely hot summers in the U.S. are also linked to upstream RRWPs (Figs. 16, 17). However, the change in the odds is smaller in the upstream than in the collocated model (up to +16%). This is consistent with the case study investigating an extremely hot summer in the western U.S. in which the collocated RRWP signal was slightly stronger than the upstream RRWP signal (cf. Section 4.2). Moreover, the effect of upstream RRWPs is significant in areas of the Midwest (+6%), where the extremely hot summer 1983 occurred (cf. Section 4.1). Since in summer 1983, both upstream and collocated RRWP signals were observed, the results of the case study of summer 1983 and of the logistic regression agree well with each other. Furthermore, upstream
Figure 16: The change in the odds of the occurrence of an extremely hot summer for (a) one additional collocated RRWP day, and for (b) an increase of + 0.1 m s−1in the collocated longitudinally averaged seasonal meanR. Only significant effects are displayed in colour.
RRWPs increase the odds of the occurrence of extremely hot summers over the western North Atlantic by up to 8%, while they decrease them in the eastern U.S. and over the eastern Atlantic by up to 6% and 14%, respectively. Globally, however, the link between upstream RRWPs and extremely hot summers is less strong as compared to collocated RRWPs (Figs. 16, 17). Especially in Asia, less strong and extensive responses are shown for the upstream model (up to +/- 14%) than for the collocated one (up to +/- 20%) implying that extremely hot summers occurring in Asia are rather linked to collocated than upstream RRWPs. Another difference to the collocated model are the the positive responses (up to +14%) found in eastern and southern Europe. This is consistent with the case studies of season 1620271 of season 1020300, which are associated with a large upstream RRWP signal (cf. Section 4.3 and Figs. D1 - D3). Furthermore, in the upstream model, the differences between the two covariates are much smaller than in the collocated model (Fig. 17). The most notable differences are the negative response over Japan, only visible for the seasonal meanR, and the more extensive negative response over the eastern North Atlantic to increases in the seasonal meanRthan in the daily RRWP frequency.
As in the collocated model, the differences between the covariates result from their different sensitivity to low R values. However, since the upstream and the collocated model consider different longitude ranges, in the upstream model, the largest differences between the covariates are found in more eastern regions than in the collocated model.
Figure 17: Same as Fig. 16, but for the upstream range (-50°to -20°).
5.2 Logistic model for the end-of-the-century period (2091 - 2100)
The link between extremely hot summers and collocated RRWPs is globally less significant in terms of spatial extent and strength of the impact in the end-of-the-century than in the present-day period (Figs. 16, 18). Both covariates show less regions where collocated RRWPs have a significant effect on the occurrence of extremely hot summers. In the western U.S. and the region of the Caspian Sea, the effect of the collocated RRWPs on the odds of the occurrence of an extremely hot summers decreases to maximal +12% and +8%, respectively. Furthermore, the spatial extension of the responses in the eastern and western U.S., and over the western North Atlantic are less far-reaching than in the present-day period. In Eurasia, much less regions showing a significant effect of RRWPs are found in the end-of-the-century as compared to the present-day period. Using the daily RRWP frequency as covariate only yields two regions with significant responses to collocated RRWPs over the Eurasian continent: a negative response (up to -18%) over the eastern Atlantic that is also present in the present-day period and a positive response (up to +20%) in Siberia, which only appears in the results of the end-of-the-century model (Fig. 18 a). As in the present-day period, more extensive responses are found in Eurasia for the seasonal mean R than for the daily RRWP frequency (Fig. 18 b) due to the climatologically lowRvalues (Fig. E1). Using the daily RRWP frequency, however, yields the larger changes in the odds implying that in some spatially distinct regions,Ris climatologically high (Fig. 18 a). Another interesting observation is that all responses to collocated RRWPs are located at more northern locations in the end-of-the-century periods as compared to the present-day period (Fig. 18).
Figure 18: Same as Fig. 16, but for the end-of-the-century period.
The upstream model shows even less regions, where RRWPs have a significant effect on the occurrence of extremely hot summers in the end-of-the-century, than the collocated model (Figs. 18, 19). Still, the results of the collocated and upstream models are more similar in the end-of-the-century than in the present-day period (Figs. 16, 17, 18, 19). As in the present-day period, the most extensive effect of upstream RRWPs on the occurrence of extremely hot summers is found in the western U.S., however, it has decreased to maximal +8% and is less extensive than in the present-day period (Figs. 17, 19).
Moreover, the signals over the eastern U.S. and western North Atlantic are much less far-reaching as compared to the present-day period. Conversely, in Greenland, a response to upstream RRWPs is visible (up to +6%) that was not present in the present-day period. Furthermore, the response to upstream RRWPs in eastern Europe is both less extensive and strong (up to +8%) in the end-of- the-century period as compared to the present-day period. For the daily RRWP frequency, almost no effects of upstream RRWPs are visible over Eurasia (Fig. 19 a). Using the seasonal meanRas covariate yields more extensive responses over Europe and Asia, which again reflects the higher sensitivity of the seasonal meanRtowards smallRvalues (Fig. 19 b). However, compared to the present-day period there are less regions found where the effects of upstream RRWPs is significant (Figs. 17, 19 b). Although the link between upstream RRWPs and the occurrence of extremely hot summer is generally weaker in the end-of-the-century period, the spatial extent of the negative response to increases in the seasonal mean R in central Asia has increased (Fig. 19 b). Also, there is a positive response to upstream RRWPs in north-eastern Asia, which was not the case in the present-day period (Figs. 17, 19). As in the collocated model, a poleward shift of the responses to upstream RRWPs can be observed for the end-of-the-century period.