IHS Economics Series Working Paper 221
November 2007
Food Markets in Russia: Dynamics of Their Integration
Konstantin Gluschenko
Alexandra Khimich
Impressum Author(s):
Konstantin Gluschenko, Alexandra Khimich Title:
Food Markets in Russia: Dynamics of Their Integration ISSN: Unspecified
2007 Institut für Höhere Studien - Institute for Advanced Studies (IHS) Josefstädter Straße 39, A-1080 Wien
E-Mail: o ce@ihs.ac.at ffi Web: ww w .ihs.ac. a t
All IHS Working Papers are available online: http://irihs. ihs. ac.at/view/ihs_series/
This paper is available for download without charge at:
https://irihs.ihs.ac.at/id/eprint/1807/
Food Markets in Russia:
Dynamics of Their Integration
Konstantin Gluschenko, Alexandra Khimich
221
Reihe Ökonomie
Economics Series
221 Reihe Ökonomie Economics Series
Food Markets in Russia:
Dynamics of Their Integration
Konstantin Gluschenko, Alexandra Khimich November 2007
Institut für Höhere Studien (IHS), Wien
Institute for Advanced Studies, Vienna
Contact:
Konstantin Gluschenko
Institute of Economics and Industrial Engineering Siberian Branch of the Russian Academy of Sciences pr. Laventieva 17
630090 Novosibirsk, Russia : +7-383-3302548 email: glu@nsu.ru
Alexandra Khimich
Higher School of Economics Moscow, Russia
email: sashah@ngs.ru
Founded in 1963 by two prominent Austrians living in exile – the sociologist Paul F. Lazarsfeld and the economist Oskar Morgenstern – with the financial support from the Ford Foundation, the Austrian Federal Ministry of Education and the City of Vienna, the Institute for Advanced Studies (IHS) is the first institution for postgraduate education and research in economics and the social sciences in Austria.
The
Economics Series presents research done at the Department of Economics and Finance andaims to share “work in progress” in a timely way before formal publication. As usual, authors bear full responsibility for the content of their contributions.
Das Institut für Höhere Studien (IHS) wurde im Jahr 1963 von zwei prominenten Exilösterreichern –
dem Soziologen Paul F. Lazarsfeld und dem Ökonomen Oskar Morgenstern – mit Hilfe der Ford-
Stiftung, des Österreichischen Bundesministeriums für Unterricht und der Stadt Wien gegründet und ist
somit die erste nachuniversitäre Lehr- und Forschungsstätte für die Sozial- und Wirtschafts-
wissenschaften in Österreich. Die Reihe Ökonomie bietet Einblick in die Forschungsarbeit der
Abteilung für Ökonomie und Finanzwirtschaft und verfolgt das Ziel, abteilungsinterne
Diskussionsbeiträge einer breiteren fachinternen Öffentlichkeit zugänglich zu machen. Die inhaltliche
Verantwortung für die veröffentlichten Beiträge liegt bei den Autoren und Autorinnen.
Abstract
In the context of integrated market, a price of any product in regions depends on its demand in a national market rather than in a regional one. Applying the econometric model based on this theoretical statement, the paper assesses to degree the markets of some food products are integrated. The fact that since nearly 1994 the growth of segmentation in such markets changes to the tendency of their integration has been observed. We conclude that there is an integrated food market in Russia; and its integration has been just the same as that one in the countries of developed market economy.
Keywords
Price dispersion, market integration, food markets, Russia, Russian regions
JEL Classification
K49, P22, P37, R19
Contents
1. Introduction 1
2. Modell 2
3. Data 3
4. Results 4
5. Conclusion 11
References 13
I H S — Gluschenko, Khimich / Food Markets in Russia — 1
1. Introduction
A market is deemed as integrated, if there are no impediments to the movement of goods between its spatial segments (regions of a country, cities, etc.), except for the only, “natural”
one: their remoteness from one another. The issue of integration of Russian markets occupied attention of economists almost from the very beginning of market reforms in the country; see, e.g., Gardner and Brooks (1994), Goodwin, Grennes, and McCurdy (1999), and Berkowitz, DeJong and Husted (1998), to name a few.
It comes as no surprise, since this issue in its essence means whether the reforms lead to creation of common Russia-wide goods market or we deal just with a collection of loosely bound regional markets, in which case a “single economic space” is out of question. Of course, one might have hardly expect that the Russia-wide market began to take shape from the very early years of transition. Instead, it was the direction of the movement that was of importance. And the papers cited found encouraging (although very weak) indications of formation of the common market.
Berkowitz and DeJong (2001) as well as Gluschenko (2003) analyze the evolution of integration of the Russian goods markets over a longer time span, up to the end of 1990s.
These papers deal with aggregated markets represented by both the CPI basket and the basket of 25 staples. The aggregating weights in these baskets reflect proportions of covered goods in households’ expenditures. Thus, the estimates of the degree of market integration are aggregated as well. They capture some general trend of a set of markets for individual goods, “weighting” each market according to its importance from the viewpoint of consumption. However, the market for an individual good can have peculiar features, deviating to a greater or lesser extent from the “averaged” behaviors. Therefore, analyzing markets for individual goods is of no lesser interest.
This paper analyzes evolving integration of markets for four disaggregated goods – potatoes, beef, sugar, and sunflower oil – during 1992-2000. We use the same model as in Gluschenko (2003), so providing comparability of results in our paper with those obtained in the paper cited for the aggregated market of 25 staples. In turn, this allows an understanding of the extent to which the evolution of market integration in disaggregated markets conforms with the general trend.
The rest of the paper is organized as follows. The next section presents a theoretical and econometrical framework for the analysis. In Section 3, the data used are described.
Empirical results are presented in Section 4. Section 5 concludes.
2 — Gluschenko, Khimich / Food Markets in Russia — I H S
2. Modell
In an integrated market, prices of tradable goods should be equal across its spatial segments (hereafter, regions) accurate to transportation costs. That is, the weak version of the law of one price should hold. Due to unimpeded movement of the goods, any inter-regional price difference above the transportation costs that is caused by a change in demand in some region is immediately eliminated by commodity arbitrage. In other words, from the viewpoint of an individual region, the supply is perfectly elastic.
Thus, given the integrated market, the change in demand for the good in some region has no effect on the regional price of the good: the price is determined by interaction of demand and supply in the entire national market. If one observes such an effect, this suggests that there are impediments to inter-regional trade, i.e., the market is segmented. The extent of this effect can quantitatively characterize market segmentation (or integration): the greater the dependence of local price on local demand, the higher segmentation (or the weaker integration).
It is this idea that model in Gluschenko (2003) rest on. The problem is that data on the quantities demanded are, as a rule, unavailable. However, assuming income per capita to be the only (apart from the price) determinant of demand, the difference in per capita income between regions can be used instead of difference in demand. Let P
rbe the price of the good in region r, I
rthe per capita income in r, D(⋅) the demand function, and S(⋅)the supply function. Having solved the market equilibrium equation D(P
r, I
r) – S(P
r) = 0 with respect to P
r, we have the price as a function of the per capita income. Under some additional assumptions, this function can be represented as P
r= k I
rβ. Then the logarithm of the ratio of prices in regions r and s (for convenience, they are arranged so that P
r≥ P
s) takes the form ln(P
r/P
s) = βln(I
r/I
s).
This equation is a model of the law of one price in its strict version which requires prices to be exactly equal in every pair of regions. To obtain the law in the weak version which allows prices to differ by the value of transportation costs, the price ratio needs to be “cleaned” from these costs: ln(P
r/P
s) – lnT
rs= βln(I
r/I
s) or ln(P
r/P
s) = βln(I
r/I
s) + lnT
rs, where T
rsis transportation costs as the percentage of the price of the good. Assuming that they depend on distance between regions, L
rs, as lnT
rs= α + γlnL
rs, we get ln(P
r/P
s) = α + βln(I
r/I
s) + γlnL
rs. Coefficient β is the elasticity of difference in prices vis-à-vis difference in per capita income. As Gluschenko (2003) proves, β is nonnegative. It is the magnitude of β that measures market integration: a smaller value of β means stronger integration, β = 0 implying integrated market.
Taking account of random shocks, ε
rs, in the latter equation, the following econometric model
is arrived at:
I H S — Gluschenko, Khimich / Food Markets in Russia — 3
ln(P
r/P
s) = α + βln(I
r/I
s) + γlnL
rs+ ε
rs. (1)
Here, α, β, and γ are coefficients to be estimated. Coefficient γ is the elasticity of difference in prices vis-à-vis distance, and α is simply a scale factor which depends on the unit of measurement of distance. Regression (1) is estimated across cross-section of N×(N–1)/2 observations for every region pair, where N is the number of regions in a sample. Having estimated β for every point in time t from time span t = 1,…, T under consideration, we get an evolving pattern of integration of a relevant market (an “integration trajectory”, as Berkowitz and DeJong, 2001, call it).
3. Data
Subjects of the Russian Federation are taken as regions, being represented by their capital cities. Since complete data are not available for a number of regions, the spatial sample covers Russian 74 regions of all the 89. Omitted are all (the 10) autonomous okrugs, the Republic of Ingushetia, the Chechen Republic, the Jewish Autonomous Oblast, as well as the Moscow and Leningrad oblasts (since their capital cities, Moscow and St. Petersburg, are by themselves the subjects of the Russian Federation). This sample yields 2,701 (=74×73/2) region pairs, i.e., spatial observations.
Estimations are also run over two more samples. The first one is Russia excluding difficult- to-access regions. It is produced from the basic sample by removal of the Murmansk, Magadan, Kamchatka, and Sakhalin oblasts and Republic of Sakha (Yakutia). This is worthwhile since these regions cannot participate in bilateral arbitrage because of poor transport accessibility; hence, they can hardly be completely integrated with the national market in the foreseeable future. This sample covers 69 regions, yielding 2,346 region pairs.
The second additional sample is the European part of Russia excluding its northern territories (hereafter referred to as simply European Russia). This part of the country has relatively favorable conditions for arbitrage among its regions for lack of such frictions like very long distances between regions, underdeveloped transport infrastructure, etc. Thus, one might a priori believe European Russia to be more integrated than the remainder of the country without difficult-to-access regions. We deal with this sample in order to verify whether such a belief is true. European Russia includes all regions of the European part of Russia except for the Republic of Komi, Arkhangelsk and Murmansk oblasts, and regions missing in the basic sample (the Nenets Autonomous Okrug, Republic of Ingushetia, Chechen Republic, and Moscow and Leningrad Oblasts). This sample covers 51 regions which yield 1,275 region pairs.
We use data on prices of the following four goods: potatoes, first-grade beef (except for
boneless beef), white granulated sugar, and sunflower oil. Prices were observed in capital
4 — Gluschenko, Khimich / Food Markets in Russia — I H S
cities of Russian regions. The time series cover January 1992 (for sunflower oil, February 1992) through December 2000 with monthly frequency. Missing observations are reconstructed with the use of linear interpolation. The data were obtained directly from the Russian Statistical Agency, Goskomstat.
The income index is the monetary income per head in a given region. The income data have monthly frequency. They also were obtained directly from Goskomstat.
Distances between regions are mostly the shortest distances between capital cities of regions by rail train. These are drawn from the Tariff Manual (1965) and updated as well as supplemented with highway, sea and river distances for regions having no railway communication with the use of modern geographical atlases. (The distance matrix was compiled by Alexei Abramov, Novosibirsk State University.)
4. Results
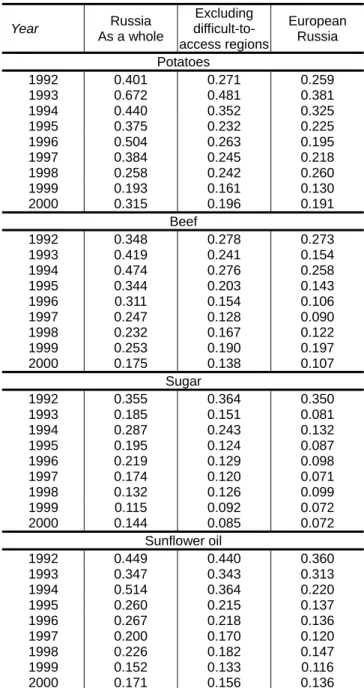
Table 1 characterizes price dispersion in the country. The data in it are standard deviations of
regional prices normalized to the Russian average, P
r/P
0. To save space, we tabulate price
dispersion only for December of each year in the time span under consideration. The
average Russian price P
0is a weighted average over regions (the weights are proportions of
regional population in the total population of the country). It thus deviates from the arithmetic
mean. However, the deviation is minor, therefore the mean relative price may be
approximately taken as 1. Then the tabulated data are interpreted as average relative
deviations from the average Russian price.
I H S — Gluschenko, Khimich / Food Markets in Russia — 5
Table 1. Price dispersion as of the end of year
Year Russia
As a whole
Excluding difficult-to- access regions
European Russia Potatoes
1992 0.401 0.271 0.259 1993 0.672 0.481 0.381 1994 0.440 0.352 0.325 1995 0.375 0.232 0.225 1996 0.504 0.263 0.195 1997 0.384 0.245 0.218 1998 0.258 0.242 0.260 1999 0.193 0.161 0.130 2000 0.315 0.196 0.191
Beef
1992 0.348 0.278 0.273 1993 0.419 0.241 0.154 1994 0.474 0.276 0.258 1995 0.344 0.203 0.143 1996 0.311 0.154 0.106 1997 0.247 0.128 0.090 1998 0.232 0.167 0.122 1999 0.253 0.190 0.197 2000 0.175 0.138 0.107
Sugar
1992 0.355 0.364 0.350 1993 0.185 0.151 0.081 1994 0.287 0.243 0.132 1995 0.195 0.124 0.087 1996 0.219 0.129 0.098 1997 0.174 0.120 0.071 1998 0.132 0.126 0.099 1999 0.115 0.092 0.072 2000 0.144 0.085 0.072
Sunflower oil
1992 0.449 0.440 0.360 1993 0.347 0.343 0.313 1994 0.514 0.364 0.220 1995 0.260 0.215 0.137 1996 0.267 0.218 0.136 1997 0.200 0.170 0.120 1998 0.226 0.182 0.147 1999 0.152 0.133 0.116 2000 0.171 0.156 0.136
As expected, difficult-to-access regions sufficiently contribute to price dispersion in Russia as a whole. When they are removed, the dispersion of prices greatly decreases, by 10% to half.
In European Russia, price dispersion is smaller than in Russia excluding difficult-to-access
regions. The maximum of price dispersion falls within the interval between 1993 and 1994
(apart from a surge in December 1992 in the case of sugar). Taking Russia excluding
difficult-to-access regions, the deviation from the average Russian price equaled in that time
from circa 25% for sugar to almost 50% for potatoes. And this is on average; individual price
differences reached several times. Thus, potential arbitrage opportunities were great, but
remained unrealized.
6 — Gluschenko, Khimich / Food Markets in Russia — I H S
A turn happened in 1994–1995, when increase in inter-regional price gaps changed to price convergence. Since then the general trend became that of progressively more decrease of price dispersion in the country, albeit some deviations from this trend occurred from time to time. By December 2000, the dispersion of prices for potatoes decreased 2.5 times as compared to the maximum over the time span considered (without account for difficult-to- access regions), 2 times for beef, 2.9 times for sugar (to the 1994 maximum), and 2.3 times for sunflower oil. For Russia as a whole, these figures were 2.1 times for potatoes, 2.7 times for beef, 2 times for sugar, and 3 times for sunflower oil.
Thus, a crude analysis based on considering behavior of price levels suggests a similar pattern for all the four markets. The increase of market segmentation was intrinsic for the early years of transition. Since 1994-1995, such a trend changed to improvements in integration. In general terms, this pattern coincides with that obtained by Berkowitz and DeJong (2001) and Gluschenko (2003).
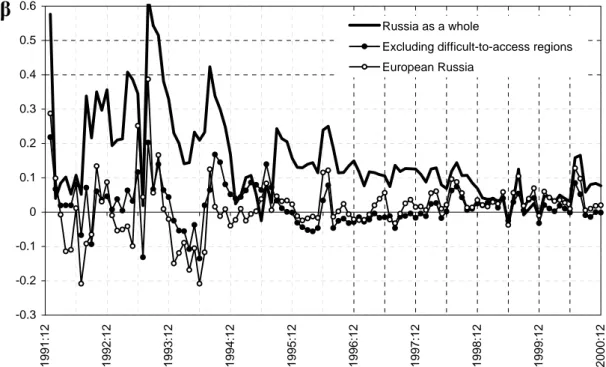
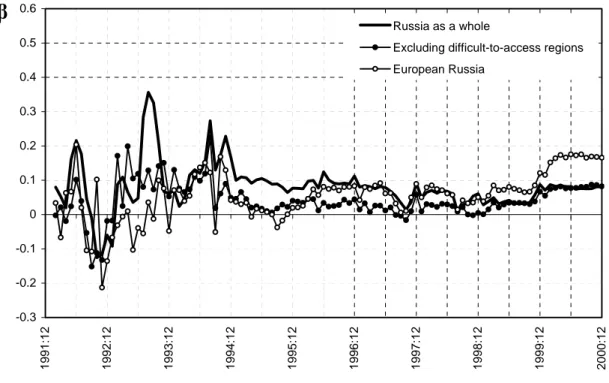
Let us consider more subtle features of the evolution of integration in discussed markets that are captured by estimates of model (1). Since the tabulated results are very cumbersome, we present them graphically. Figure 1 plots integration trajectories for the market for potatoes. This market yields the greatest values of β that exceed 0.6. This predetermines the plotting scale in the later figures; it is taken the same across the figures to provide comparability of trajectories in different markets.
Figure 1. Evolving integration of market for potatoes
-0.3 -0.2 -0.1 0 0.1 0.2 0.3 0.4 0.5 0.6
1991:12 1992:12 1993:12 1994:12 1995:12 1996:12 1997:12 1998:12 1999:12 2000:12
Russia as a whole
Excluding difficult-to-access regions European Russia
β
I H S — Gluschenko, Khimich / Food Markets in Russia — 7
A peculiarity of the market for potatoes is that its part excluding difficult-to-access regions as well as the submarket of European Russia became practically integrated since as early as the second half of 1996 (apart from sporadic deviations). It is somehow surprising when taken into account that the flow of long distance traffic of potatoes fell dramatically as compared with the pre-transition times. Besides, Table 1 suggests that prices for potatoes have the greatest dispersion among goods under consideration. Apparently, arbitrage in this market occurs between adjacent regions, and price equalization spreads to the entire market through region chains. Nor is there a contradiction between high price dispersion and strong integration of the market: estimates of model (1) suggest that the dispersion of prices for potatoes in the market of Russia excluding difficult-to-access regions is mainly caused by transportation costs.
As to the Russia-as-a-whole market for potatoes, the evolution of its integration qualitatively coincides with the evolution of integration of the entire food market (represented by the basket of 25 staples) in Gluschenko (2003). The only salient difference is that after the August 1998 financial crisis in Russia the entire market for potatoes became rather strongly integrated. A reason seems to be the exclusion of foreign potatoes from markets of difficult- to-access regions (where imported potatoes had a ponderable share) as a consequence of the crisis and strong competition among domestic suppliers of potatoes to these markets.
A peculiarity of integration trajectories in the market for potatoes is a yearly surge of market segmentation in July-August. Most likely, this is caused by inflow of new potatoes to the market; they are mainly sold where produced, so being in essence a nontradable good. It is thus reasonable that the price is determined by demand in a given region (which, in turn, depends on local incomes). Moreover, by summer, last year’s potatoes become non- transportable. In next months, mass inflow of this year’s harvest eliminates this effect.
Interestingly, the integration trajectory in European Russia is fairly close along the whole its length to that in Russia excluding difficult-to-access regions (especially since the second half of 1994).
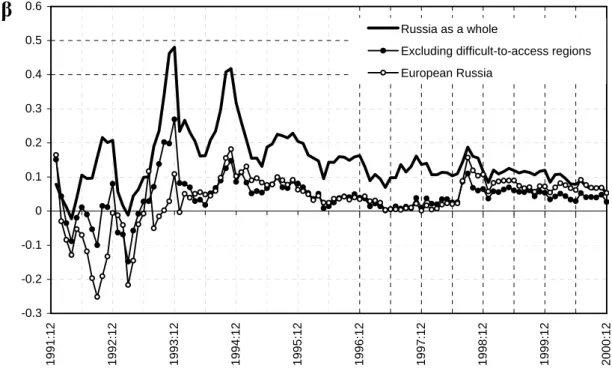
Figure 2 plots results for the beef market. All the tree trajectories are both qualitatively and
quantitatively very similar to those obtained by Gluschenko (2003) with the use of data on
the cost of the 25 staples basket. There is, however, a sufficient distinction. The beef
markets in Russia excluding difficult-to-access regions and European Russia were almost
completely integrated during about the beginning of 1977 through July 1998. In the post-
crisis times, the values of β stabilized at the level of about 0.1 in Russia as a whole and 0.05
in Russia excluding difficult-to-access regions; these values agree with those for the
aggregated market for 25 staples. Improvements in integration of market of Russia as a
whole are seen during 2000. This suggests that difficult-to-access regions were becoming
more integrated with the market of the rest Russia. However, it is vague whether this process
is a stable trend or a transient phenomenon. Curiously, there are no seasonal peculiarities
on the integration trajectories in the beef market.
8 — Gluschenko, Khimich / Food Markets in Russia — I H S
Figure 2. Evolving integration of market for beef
-0.3 -0.2 -0.1 0 0.1 0.2 0.3 0.4 0.5 0.6
1991:12 1992:12 1993:12 1994:12 1995:12 1996:12 1997:12 1998:12 1999:12 2000:12
Russia as a whole
Excluding difficult-to-access regions European Russia
β
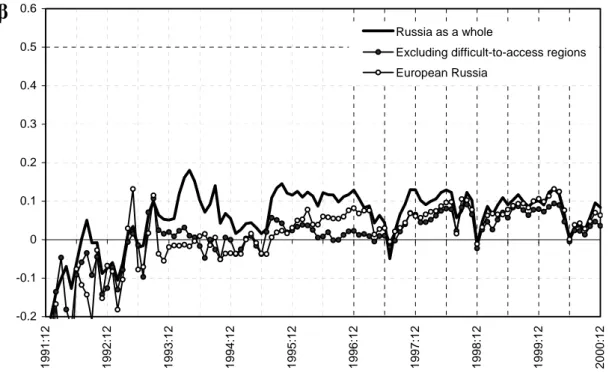
Figure 3 demonstrates the evolving pattern of integration in the market for sugar. It differs sufficiently from the patterns for the markets discussed above as well as for the aggregated market of 25 staples. First, there are no indications of substantial segmentation in the early years of transition that is peculiar to other markets. Second, beginning as early as the second half of 1993, the degree of integration of the sugar market remains more or less stable.
The sugar market of Russia excluding difficult-to-access regions can be deemed as close to
completely integrated during the beginning of 1994 through the middle of 1997. Since the
beginning of 1998, the degree of segmentation increased to 0.08–0.09. Integration of market
of Russia as a whole is even more stable, its degree of segmentation only slightly (circa by
20–30%) exceeding that in Russia excluding difficult-to-access regions. Along with this,
recurrent, 1.5–2 years apart, jumps to a sufficient improvement in integration occur.
I H S — Gluschenko, Khimich / Food Markets in Russia — 9
Figure 3. Evolving integration of market for sugar
-0.2 -0.1 0 0.1 0.2 0.3 0.4 0.5 0.6
1991:12 1992:12 1993:12 1994:12 1995:12 1996:12 1997:12 1998:12 1999:12 2000:12
Russia as a whole
Excluding difficult-to-access regions European Russia
β
Features of integration in the sugar market owe to its specificity. This market is a complex structure in which suppliers of raw stuff, producers and suppliers of final product are interlaced with one another, in particular, by contracts regarding goods made on commission, vertical integration, etc. Such a structure is very far from the competitive market; a considerable share of the market is controlled by regional and inter-regional oligopolies (Avdasheva and Rozanova, 1999). Besides that, domestic market agents permanently struggle with foreign suppliers in this market, which results, from time to time, in taking protectionist measures. For example, a 25-percent custom duty for deliveries of sugar from Ukraine was introduced in the middle of 1997. Probably, it was this duty that caused increase in market segmentation in the second half of that year.
In the last years of the period under consideration, the value of β in the sugar market (a
“typical” level is concerned, transient surges apart) is in approximate agreement with that in the aggregated market of 25 staples. Along with this, integration of the sugar market has to be regarded as fairly strong, since the dispersion of prices for sugar in Russia (excluding difficult-to-access regions) during 1999–2000 practically coincides with that in the US. (The latter is calculated from ACCRA, 1992-2000).
Figure 4 plots integration trajectories for the sunflower oil market. In general terms, their
shapes are similar to those in the aggregated market of 25 staples. However, a number of
sufficient differences take place.
10 — Gluschenko, Khimich / Food Markets in Russia — I H S
Figure 4. Evolving integration of market for sunflower oil
-0.3 -0.2 -0.1 0 0.1 0.2 0.3 0.4 0.5 0.6
1991:12 1992:12 1993:12 1994:12 1995:12 1996:12 1997:12 1998:12 1999:12 2000:12
Russia as a whole
Excluding difficult-to-access regions European Russia
β
As early as since the beginning of 1995, the degree of integration of the sunflower oil market became fairly high. In Russia as a whole, β is for the most part equal to about 0.1. The degree of segmentation in the aggregated market of 25 staples decreased to such a value only after the August 1998 crisis. If one considers Russia excluding difficult-to-access regions, the value of β oscillated around the level of 0.025 during 1995–1999 – less than half as much as β in the market of 25 staples in 1999–2000. However, the degree of segmentation of the sunflower oil market increased to about 0.08 in this part of the country in 2000, so exceeding the value for the aggregated market. We failed in finding reasons for this anomaly.
Rather surprisingly, since the first half of 1999, integration of market of the entire country became practically the same as in Russia excluding difficult-to-access regions. One more feature is that beginning in the second half of 1996, the degree of market segmentation in European Russia is approximately twice that in Russia excluding difficult-to-access regions (with qualitative similarity of the integration trajectories). Considering the fact that the European part of the country accounts for more than 95% of both harvest of sunflower seeds and production of vegetable oils (calculated from Goskomstat, 2001, pp. 440–441, 492), such a phenomenon seems fairly puzzling. So far, we also fail to explain it.
Discussing the evolution of integration, we passed over in silence the very early stage, the
first year or the year and a half of transition. Negative values of β occur on this segment of
I H S — Gluschenko, Khimich / Food Markets in Russia — 11
the integration trajectories. This implies that, on average, a reverse dependence of prices in a region on incomes takes place: the lower incomes (and demand), the higher prices. The reason of this pathology is in that assumptions on which the model used bases (explicitly or implicitly) did not hold in markets of that time. In brief, these assumptions are as follows: (a) market agents are free to price; (b) they behave rationally, aiming to maximize their profit; (c) there is equilibrium in the market; (d) consumers’ incomes are a determinant of demand.
Recalling 1992–1993, there was nothing like this in the Russian market at that time. All the four goods under consideration were subject to price regulations. Neither producers nor traders had experience of market pricing; moreover, many of them, being state-run, had no stimuli for rational pricing. Therefore markets, just appeared as such, were highly disequlibrium. High and unpredictable inflation aggravated the situation. On the one hand, it disoriented sellers who had no time to understand the conjuncture and to grasp market laws.
On the other hand, demand was determined in a sizable measure by inflationary expectations and rush spending of savings rather than by consumers’ current incomes.
Besides, intermediate bargains in the market were extremely chaotic; goods passed through many intermediaries, which made pricing chaotic as well.
Thus, initial segments of the trajectories are either very unreliable or have no economic meaning (depending on a good and market’s geography). Only when a market takes features which, in fact, make possible to reasonably use this term itself, the model starts working and we can confide in its estimates. Unfortunately, it is impossible to point such a moment (which is, in addition, its own for each market). Therefore, we have no choice but to judge by the results obtained themselves: this moment occurs when estimates become reasonable. Certainly, it is not the best way, but there is no a different one.
5. Conclusion
The analysis of integration of markets for individual food goods suggests that the evolution of integration is, in general, in agreement with that in the aggregated markets. The pattern obtained implies that segmentation of regional markets changed to a trend to improvement in integration since about 1994. Yet the evolution of integration in some markets, while not contradicting to the general pattern, has sufficient specificity.
It is peculiar to markets for highly-processed goods (sugar and sunflower oil), while the behavior of markets for unprocessed (potatoes) or low-processed (beef) goods is very similar to that of the entire food market. It is very interesting to consider individual episodes of drastic changes in the degree of integration that owe to the specificity of markets (especially, that for sugar) and events happened in it, but this would take plenty of room.
Besides, it is not clear for a number of episodes what events, processes, and forces were
12 — Gluschenko, Khimich / Food Markets in Russia — I H S
involved in them; a detailed examination is needed of what went on in a particular market and around it. It is worth noting as well that some episodes can be artifacts caused by errors in the data used. We have corrected obvious errors; however, their presence itself sets us suspecting that there are hidden errors which cannot be corrected, lacking primary data.
In general, the results of this study jointly with results in Gluschenko (2003) suggest that common markets for food goods started taking shape in Russia since 1994–1995 (in some cases, even earlier). Making bold to extend the results for a few goods markets to the entire set of food markets (resultps in Berkowitz and DeJong, 2001, and Gluschenko, 2003, give grounds for this, though), we can conclude that the common Russia-wide market for foods does exist, and that it took shape as early as by the end of the first decade of transition.
Certainly, it differs from markets in countries with long-standing market economies. There are considerable forces working against integration in the Russian food market, such as regional protectionism, state intervention, organized crime, etc. Market infrastructure can be hardly characterized as sufficiently developed. Nonetheless, there are no fundamental distinctions between Russia’s food market integration and that in long-standing market economies. One is entitled to dispute about whether Russia has become a normal middle-income capitalist country as a result of market transformations (Shleifer and Treisman, 2005), or it has not (Rosefielde, 2005), considering its economic (and political) system as a whole. But as far as goods market integration is concerned (at least, regarding foods), one may unambiguously agree with Shleifer and Treisman (2005) that Russia is a quite normal country.
Since the late 1990s, Russia’s market integration is similar to that in the US. A comparison of price dispersion in markets for the same goods in Russia (excluding difficult-to-access regions) and the US (the latter calculated from ACCRA, 1992-2000) provides an evidence.
As mentioned above, price dispersion in the Russian sugar market in 1999–2000 coincides with that in the US sugar market. Over the same period, dispersions of prices for potatoes in Russia and the US are close to each other, except for the second half of 2000, when the Russian figure becomes about half as much again as the US one. (Taking account of considerable climatic differences across Russian territories, this seems quite natural; just the reverse, it is surprising that price dispersions coincided during one and a half year.) Dispersion of prices for beef in Russia in 1999–2000 was circa half as much again as in the US, the gap diminishing during 2000.
So, the common food market exists at present time in Russia. Its integration does not
fundamentally differ from that in developed countries including the US, goods market in
which is the most integrated in the world, according to a widespread opinion (see, e.g.,
Parsley and Wei, 2002).
I H S — Gluschenko, Khimich / Food Markets in Russia — 13