research paper series
Globalisation, Productivity and Technology
Research Paper 2007/18
R&D and exporting: A comparison of British and Irish firms
by
Sourafel Girma, Holger Görg and Aoife Hanley
The Authors
Sourafel Girma is an Associate Professor and Reader in Industrial Economics at Nottingham University Business School, University of Nottingham. Holger Görg is an Associate Professor and Reader in International Economics in the School of Economics, University of Nottingham and an Internal Research Fellow in GEP. Aoife Hanley is an Associate Professor in Industrial Economics at Nottingham University Business School.
Acknowledgements
This work contains statistical data from ONS which is Crown copyright and reproduced with the permission of the controller of HMSO and Queen's Printer for Scotland. The use of the ONS statistical data in this work does not imply the endorsement of the ONS in relation to the interpretation or analysis of the statistical data. We are grateful to participants at a workshop at Nottingham University for helpful comments. Holger Görg gratefully acknowledges financial support through the Leverhulme Trust (Programme Grant F114/BF).
R&D and exporting: A comparison of British and Irish firms
by
Sourafel Girma, Holger Görg and Aoife Hanley
Abstract
This paper investigates the two way relationship between R&D and export activity. In particular, we concern ourselves with the question whether R&D stimulates exports and, perhaps more importantly, whether export activity leads to increasing innovative activity in terms of R&D (learning by exporting).
We use two unique firm level databases for Great Britain and the Republic of Ireland and compare the results for these two countries. We find that previous exporting experience enhances the innovative capability of Irish firms. Conversely, no strong learning-by-exporting effects are found for British firms. Arguably the differences between Ireland and Britain are attributable to different, cross-country exporting patterns where Irish firms have a greater interface with OECD markets.
JEL classification: F14, F23
Keywords: learning effects, exporting, innovation, R&D
Outline
1. Introduction
2. Background on R&D and exporting 3. Data description
4. R&D and exporting in the UK and Ireland 5. Methodology
6. Results 7. Conclusion
Non-Technical Summary
Theory and existing empirical work tells us that superior R&D capability leads firms to export. A less explored aspect of R&D and exporting is to what extent exporters learn from foreign competition in export markets and as a result improve their domestic R&D activity. While ample empirical evidence exists supporting a link from R&D or innovation to exports, the evidence so far for a causal effect of exporting on innovation in micro level data is weak with the exception of a few recent studies.
In this paper we investigate the possible two-way relationship between exporting and R&D. Specifically, using firm level data for two countries we explore whether R&D activity stimulates exports and whether exporters demonstrate learning effects from their exporting activity through improving R&D activity post exporting. We recognize the interdependence of exporting and R&D by modelling the decisions to export and to invest in R&D simultaneously in a bivariate probit framework. This is the first analysis to look these relationships within a simultaneous framework using data for developed economies.
A further contribution of our paper is that we investigate this issue separately using firm level data for two countries, and we draw comparisons between the results. Specifically, we look at the Republic of Ireland and the UK and use two unique datasets for our estimations. The country dimension highlights an important difference: while we find that exporting stimulates R&D activity in the case of Irish firms, there is no strong evidence for direct learning-by-exporting effects for UK exporters.
There are some potential explanations for why our results differ for Ireland and the UK. To begin with, the economies are different in terms of the role of exporting. The UK represents a large economy with a lower share of exporters (relative to total firms) than Ireland. We have some prior evidence that UK exporters are ‘better’ firms i.e. of self-selection. Ireland represents a comparatively small and open economy. Evidence for self-selection of Irish exporters is mixed. It is unclear how self-selection impacts on learning as its predicted effects are ambiguous. With self-selection, the ability to learn is stronger while in its absence the need to learn is stronger.
Another potential reason for the significantly higher impact of exporting on Irish R&D capability is that a higher proportion of Irish high-technology sector exports go to OECD country markets. Irish firms might be forced to work harder at producing innovative outputs given the relative sophistication of such markets.
We also see that Irish domestic exporters in our sample have a comparatively higher R&D spend than their British counterparts, indicating that they have higher absorptive capacity to assimilate the knowledge that is being transferred from exporting.
1 Introduction
Theory and existing empirical work tells us that superior R&D capability leads firms to export. The argument goes that the prospect of coming head to head with foreign competition preselects only the fittest of firms: firms who have already ‘raised their game’
on the domestic market. In other words, the most innovative domestic firms, those with differentiated products and using cutting edge technology become exporters (Grossman and Helpman, 1995; Bleaney and Wakelin, 2002).
A less explored aspect of R&D and exporting is to what extent exporters learn from foreign competition in export markets and as a result improve their domestic innovation activity.
Clearly exporters compete on export markets, become aware of and invest in foreign technologies and respond to the diverse needs of sophisticated foreign customers. In this case, exporters assimilate a foreign technology and upgrade their “knowledge base” at home. The conjectured effect of exporting on innovation is therefore positive. However while ample empirical evidence exists supporting a link from innovation to exports, the evidence so far for a causal effect of exporting on innovation in micro level data is weak with the exception of recent studies by Aw et al., 2007 and Salomon and Shaver (2005) using data for Taiwan and Spain, respectively.
In this paper we investigate the possible two-way relationship between exporting and innovation. Specifically, using firm level data for two countries we explore whether R&D activity stimulates exports and whether exporters demonstrate learning effects from their exporting activity through improving R&D activity post exporting. Similar to Aw et al.
(2007) we recognize the interdependence of exporting and R&D by modelling the decisions to export and to invest in R&D simultaneously in a bivariate probit framework. This is the first analysis to look these relationships within a simultaneous framework using data for developed economies.1
1 Aw et al (2007) use a similar approach in their analysis of Taiwanese firm level data. However, they are unable to distinguish whether a firm invests in R&D or in training, while we focus particularly on R&D.
Arguably, the decision to invest in R&D may be distinct from that of investing in training and, hence, it is important to distinguish those. Also, our data are a continuous annual panel, while Aw et al. have panel data separated by 5 year intervals.
A further contribution of our paper is that we investigate this issue separately using firm level data for two countries, and we draw comparisons between the results. Specifically, we look at the Republic of Ireland and the UK and use two unique datasets for our estimations. For Britain we link the BERD database at the ONS with the standard published data from Companies House obtainable through FAME. BERD contains among other things information on R&D expenditures. For Ireland we use data from the Annual Business Survey (ABS) available from the State agency Forfás. The country dimension highlights an important difference: while we find that exporting stimulates R&D activity in the case of Irish firms, there is no strong evidence for direct learning-by-exporting effects for UK exporters.2
There are some potential explanations for why our results differ for Ireland and the UK. To begin with, the economies are different in terms of the role of exporting. The UK represents a large economy with a lower share of exporters (relative to total firms) than Ireland. We have some prior evidence that UK exporters are ‘better’ firms i.e. of self- selection (See Girma et al., 2004a). Ireland represents a comparatively small and open economy. Evidence for self-selection of Irish exporters is mixed.3 It is unclear how self- selection impacts on learning as its predicted effects are ambiguous. If exporters have strong ex-ante R&D capability (i.e. self-selection is strong), exporters possess good absorptive capacity and assimilate foreign technologies more easily, however, there is less need for them to do so. In the absence of self-selection, the average firm may be technologically less advanced than in the case of self-selection. However, domestic exporters farther from the technology frontier may have a greater need to learn from foreign firms. Hence, with self-selection, the ability to learn is stronger and in its absence the need to learn is stronger.
Another potential reason for the significantly higher impact of exporting on Irish R&D capability is that a higher proportion of Irish high-technology sector exports go to OECD country markets (OECD, 2005). Irish firms might be forced to work harder at producing
2 The firm level data for the UK do not cover Northern Ireland (which is left out of the analysis). Hence, we use UK and Great Britain interchangeably throughout the text.
3 Ruane and Sutherland (2005) use a random effects methodology on a panel of Irish firms reveal self- selection of exporters. Furthermore, they find no evidence of learning-by-exporting effects. On the other hand, Girma et al (2004b) analysing ex ante productivity differentials on Irish data using a first order stochastic dominance methodology, find no significant differences in plant performance between domestic exporters and non-exporters.
innovative outputs given the relative sophistication of such markets. We also see that Irish domestic exporters in our sample have a comparatively higher R&D spend than their British counterparts, indicating that they have higher absorptive capacity to assimilate the knowledge that is being transferred from exporting.
We set up our paper in the following way. We first provide some background on the literature of R&D and exporting. We provide a brief description of our data before commenting on differences between Ireland and Britain in terms of exporting, R&D profiles, and the composition of our data. This is followed by the Methodology section and then our Analysis. Finally we conclude with a synopsis of our main findings.
2 Background on R&D and exporting
There is a well established theoretical literature describing the relationship between innovation and exporting. However, it matters whether being innovative causes a firm to export, whether exporting makes a firm more innovative or whether the causal relationship runs in both directions. The strongest consensus in the theoretical literature is that exporting is often a byproduct of innovative activity by domestic firms. In other words, there is general agreement in the literature that higher innovation rates spur exporting behaviour.
Effect of innovation on exporting
Specifically, the early theoretical literature posits a unidirectional relationship, running from innovation to exports (Vernon, 1966; Krugman, 1979). The intuition behind these early product-cycle models is that product differentiation and or innovation translates into competitive advantages that allow a firm to compete in international markets. A more recent generation of neo-technology models also supports this causal link (Greenhalgh, 1990; Greenhalgh and Taylor, 1994). More recently, Grossman and Helpman (1995) model the macroeconomic situation where firms improve the quality of their products (synonymous with innovation). The result is an outward shift in the country’s export demand curve.
In tandem with the theoretical literature, there have been a number of studies showing how innovation fosters exports. Specifically in the case of the UK and Ireland, studies showing the positive impact of innovation on exporting include Bleaney and Wakelin (2002), Wakelin (1998) and Love and Roper (2001).4 Bleaney and Wakelin (2002) find that firms are more likely to export if they are in a sector with a high R&D intensity (R&D to sales ratio). Wakelin (1998) uncovers a statistically significant positive correlation between innovation (measured in terms of number of innovations) and exporting. She interprets the positive relationship between innovation and exporting as suggestive of the role of innovation in supporting export growth. Love and Roper (2001) find that plants with in- house R&D capability are more likely to export.
Effect of exporting on innovation
There is a parallel theoretical literature which documents how we expect firms to learn from internationalisation i.e. among other things, the effect of exporting on innovation.
The intuition goes that being exposed to a richer source of technology on export markets, could lead firms to improve their knowledge base. Hence a firm’s export propensity can help it to raise its R&D capability and innovate. This literature investigates so called learning by exporting effects.5 The concept of learning-by-exporting is consistent with theories of endogenous innovation and growth (Romer, 1990; Grossman and Helpman, 1991; Young, 1991). Specifically, Hobday (1995) develops a technology-gap model to illustrate how innovation rates are accelerated by foreign consumer demand and accordingly, a firm’s exporting activities. He shows how knowledge is cumulative and its progression is mapped onto a firm’s growth trajectory. The outcome of the model is that exporting pulls forward a firm’s technology and accordingly innovative capacity.
As noted in the introduction empirical evidence for learning effects is weak. Harris and Li (2005) in a comprehensive review of the literature argue that this is a problem compounded by the frequent use of data which is too highly aggregated to be useful. Specifically, they argue that aggregate data hampers the estimation of innovation transmission mechanisms
4 Work for other countries includes Lachenmaier and Wößmann (2006) for Germany using an instrumental variables approach controlling for endogeneity of exports to R&D. They find that increases in innovation induce German manufacturing exports to rise by 7 percent. Barrios et al (2003) using Spanish data find that R&D intensity is one of the most important determinants of a firm’s exporting decision. Sterlacchini (2001) examines Italian data and shows the importance of R&D for the export decision.
5 Alternatively called learning by competing effects
(e.g. calculation of firm productivity rates). Aggregate data is also not appropriate when researchers need to disentangle issues of reverse causation (i.e. effect of innovation on exporting).
The convention when looking for learning effects is not to measure them directly but rather to use some proxy variable as a measure for learning, examples being a firm’s productivity rate or average variable costs. Recent studies using a learning proxy include Baldwin and Gu (2003), Girma et al. (2004a). More recently, Salomon and Shaver (2005) have broken the mould by advancing the idea that using innovation as a proxy for learning provides a
“more direct appraisal of the phenomenon”. They add that firms should be able to improve their knowledge bases through their exporting activities. Specifically, exporting is a strategic action whereby a firm can improve its competitiveness.6
In line with the Salomon and Shaver (2005) assertion that a direct rather than indirect measure for innovation be used when appraising learning effects, Aw et al. (2005) use Taiwanese data to analyse a firm’s decisions to export and invest in R&D and/or training.
They apply a bivariate probit framework that recognises the interdependence of the exporting and R&D/training decisions. They find that exporting firms not investing in R&D or training have lower productivity rates than firms investing in R&D. They conclude that exporting firms, in particular, need to produce effective R&D or training in order to generate efficiency gains. Accordingly, they observe learning by exporting effects in Taiwanese firms. However, as pointed out in the introduction, one drawback of the study is that it does not distinguish between R&D and training expenditures.
Effect of exporter country and export market on export/ innovation relationship
Another strand of related literature informs us that the degree of competitiveness in foreign export markets is very important in driving domestic exporters to better performance (innovative or efficiency based performance). Arguably, firms that lie below the international technology frontier have the highest potential to benefit from technology transfers. However, this conclusion comes with the proviso that firms must possess sufficiently advanced internal R&D allowing them to absorb the knowledge. Specifically,
6 Salomon and Shaver find that exporting is related to ex post increases in innovation using Spanish patent applications data.
in a macroeconomic study MacGarvie (2005) finds that domestic R&D capability is important and that knowledge is internalised more readily when countries share a common language or are technologically “proximate”.
In a similar vein, Barrios et al. (2003) note that exporting spillovers are most likely to arise when Spanish firms trade with OECD member countries than non-OECD countries. In the former case the technology gap between the average Spanish exporter and competitor firms in the OECD markets was wider. Ruane and Sutherland (2005) furthermore argue that the nature of the foreign market is a key driver of learning-by-exporting effects. They distinguish between UK (local) and non-UK (global) markets for Irish exporters noting that the former represents less of a challenge to exporters and hence presenting less scope for learning effects.
3 Data Description
Our empirical analysis on the link between R&D and exporting is based on two unique firm level databases for the UK and Ireland. We collected data from a number of sources. The access to R&D data for the UK was not straightforward because the R&D data contained in the BERD database which is held at the UK Office for National Statistics needed first to be linked to published Companies House data (FAME) covering UK firms in order to be able to link R&D to other firm characteristics.7 FAME is a known published data source made available via Bureau van Dijk. The version of data that we use is FAME C. Fame C comprises a sample of UK firms having fixed assets, or current assets or current liabilities in excess of £150,000. As such it is a version of FAME that widens the lens to consider such smaller and possibly younger firms at the periphery in addition to the standard selection of larger firms captured in less comprehensive versions of FAME.
The result was a unique dataset containing information on R&D expenditures for UK firms.
As with many linking exercises, some information is lost. Coverage for the two databases overlapped only for the period 1996 to 2003, which is why our UK data is confined to this
7 BERD does not include firm from Northern Ireland, hence our UK sample effectively only relates to Great Britain and excludes Northern Ireland.
period. Overall the linked UK data covers about a third percent of all official R&D expenditures captured by Government.8
The micro-data that we use for the Republic of Ireland is collected by Forfás, the Irish policy and advisory board with responsibility for enterprise, trade, science, and technology and already contains information on R&D expenditures. Specifically, our data source is the Annual Business Survey of Economic Impact (ABSEI), covering the period from 2000 until 2004. This is an annual survey of plants in Irish manufacturing with at least 10 employees, although a plant, once it is included, is generally still surveyed even if its employment level falls below the 10 employee cut-off point.9 The survey was started in 2000 and the response rate is estimated by Forfás to be around 55 to 60 percent of the targeted population per year. This data set provides information on exports and R&D expenditure at the plant level, as well as other important firm characteristics.
Note that while the British data cover the period 1996 to 2003, the Irish data are only available from 2000 onwards. In order to maximise number of observations for the British sample we use the full data for Britain and the 2000 to 2003 period for Ireland.
4 R&D and exporting in the UK and Ireland
We start by looking at some aggregate statistics for our two variables of most interest:
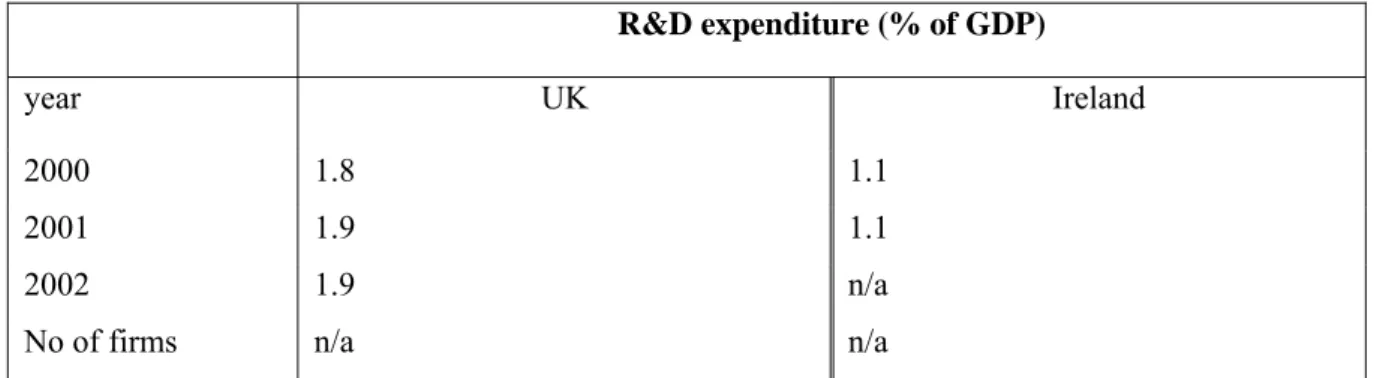
R&D intensity and export intensity for Ireland and the UK. We see from Table 1 that commercial R&D as a percentage of overall GDP was higher in the UK than in Ireland between the years 2000 and 2002. Commercial R&D expenditure in the UK was almost double that in Ireland. It should be pointed out that these pooled data may mask the peripheral role of R&D expenditure for foreign firms operating in Ireland as noted by Cassidy et al. (2005). The status of Ireland as an ‘export platform’ for such firms means that the R&D function is frequently derogated to elsewhere in the foreign MNE group: the result is comparatively low average commercial R&D for Ireland internationally.
8 For the period 2000 to 2002 the amount of R&D activity captured was 32.7%, 22.3% and 18.4%
respectively.
9 The Irish data is at the plant level, while the British data is at the firm level. This is not a problem for our analysis as most firms in Ireland are single plant firms (even among foreign multinationals).
Table 1: Aggregate R&D expenditure
R&D expenditure (% of GDP)
year UK Ireland
2000 1.8 1.1
2001 1.9 1.1
2002 1.9 n/a
No of firms n/a n/a
Source: World Bank Statistics
Table 2 describes the breakdown of exports from Ireland and the UK by destination country. For the Irish data, a comparatively higher proportion of exports in the high- technology sector finds its way to OECD countries. In 2000, over 50 percent of exports in the high-technology sector found their way to OECD countries. For the UK, the corresponding figure was just over 37 percent. For the UK, a comparatively high proportion of exports from the medium/ high technology sector is destined for OECD countries, with over 35 percent of exports in this category in 2000 going to OECD countries. The corresponding value for Irish firms in this category was 31 percent. If the destination of exports is indeed important for spillovers (Barrios et al, 2003) or to raise the efficiency of domestic exporting firms when faced with more dissimilar markets (Ruane and Sutherland, 2005), it follows that we may expect some dissimilarity in the impact of exporting for these two countries on their R&D and innovation profile i.e. differences in learning-by-exporting effects.
Table 2: Destination of Exports Export shares to OECD countries (%)
High-technology Medium/high-technology Low-technology Ireland 2000 50.2 31.0 15.9 2001 58.2 23.8 15.0 2002 57.9 27.5 12.0
UK 2000 37.4 35.3 14.4 2001 40.3 33.2 13.9
2002 38.5 34.8 14.5
Source: OECD (2005), OECD Science, Technology and Industry Scoreboard, OECD, Paris.
We now leave the aggregate data and turn to the specific data in our panels for the two economies. Table 3 shows that within the British sample, approximately 12 percent are foreign non-exporters, 31 percent foreign exporters, 13 percent are domestic non-exporters with a final 45 percent of the sample comprising domestic exporters.
Table 3: Observations by nationality and export status
Britain Ireland
Non-exporter exporter Non-exporter exporter Foreign 11.9% 30.5% 1.5% 26.1%
Domestic 12.8% 44.8% 17.9% 54.5%
Total number of observations for Britain: 10,361 Total number of observations for Ireland: 8,364 British Source: linked BERD / FAME data deposited at ONS
Irish Source: Annual Business Survey at Forfás.
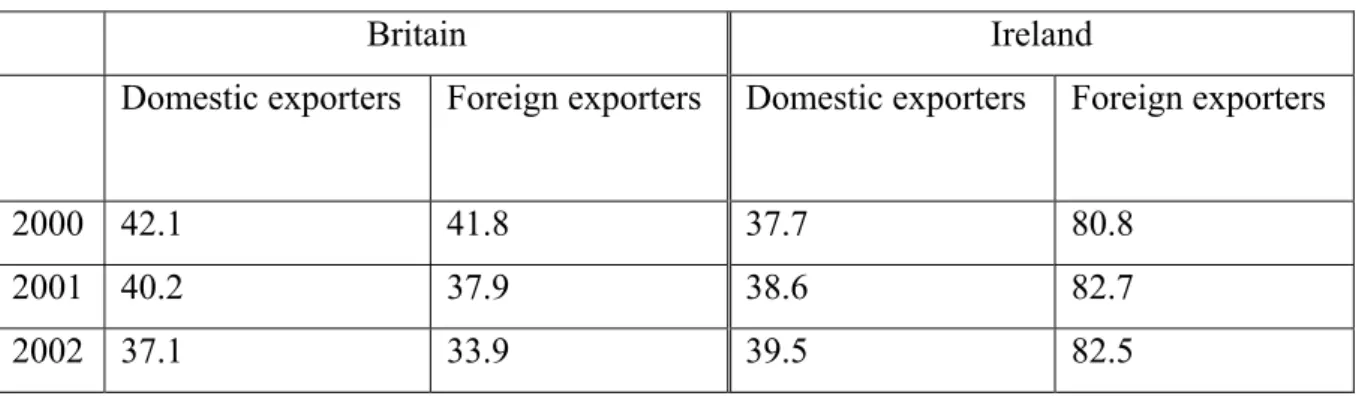
What is arguably more interesting that examining the composition of the samples by nationality and export status is to examine the question: how does being a British, foreign firm affect a firm’s export intensity? Table 4 looks at such ownership/ exporting associations in the data. We see that foreign exporters in Britain exported on average 41.8 percent of their sales in 2000 compared with 80.8 percent for foreign exporters in Ireland.
Table 4: Average export intensity by nationality (in percent)
Britain Ireland
Domestic exporters Foreign exporters Domestic exporters Foreign exporters
2000 42.1 41.8 37.7 80.8
2001 40.2 37.9 38.6 82.7
2002 37.1 33.9 39.5 82.5
Calculated as total exports over total turnover by firm type
British data source: linked BERD / FAME data deposited at ONS Irish data source: Annual Business Survey at Forfás.
The same higher pattern for Irish foreign firms is repeated in 2001 and 2002. Domestic exporters in both economies appear to export a similar percentage of their sales, approximately 40 percent. The most telling fact about Table 4 is that it shows clearly the export platform status of Ireland: foreign firms use Ireland as an export base whereby they export the lion’s share of production.10
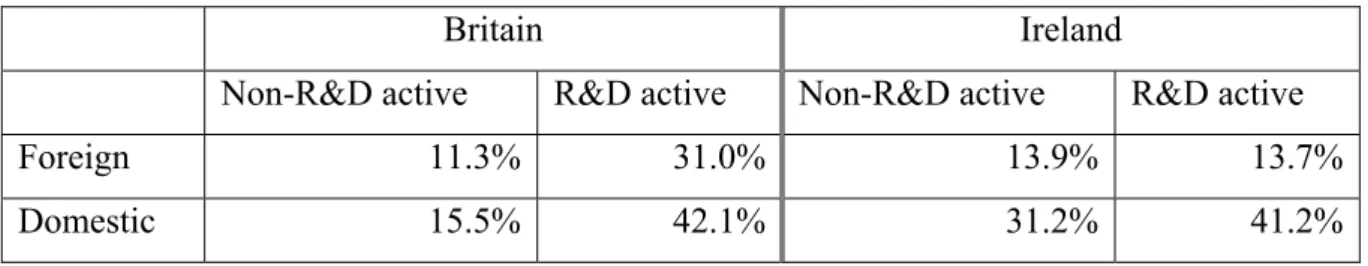
Table 5 decomposes the two panels by research status. Our British sample shows a comparatively higher showing of R&D active foreign firms. This is in line with expectations and earlier comments, where foreign multinationals operating out of Ireland carry out the R&D activity elsewhere in the group (Love and Roper, 2001). We have a sizeable set of R&D non-active firms in our Irish sample compared to that for Britain (31.2 percent vs. 15.5 percent).
Table 5: Observations by nationality and R&D status
Britain Ireland
Non-R&D active R&D active Non-R&D active R&D active
Foreign 11.3% 31.0% 13.9% 13.7%
Domestic 15.5% 42.1% 31.2% 41.2%
Total number of observations: 10,361 Source: linked BERD / FAME data deposited at ONS
Total number of observations for Ireland: 8,364 Irish Source: Annual Business Survey at Forfás
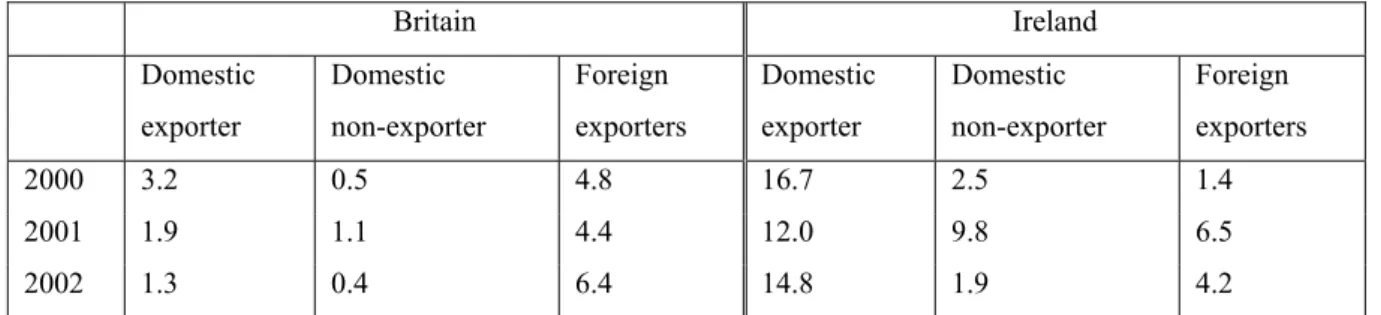
We move from the raw breakdowns of R&D in our samples to our first stab at analysing the association between R&D and foreign ownership in Table 6. What stands out is the comparatively high R&D intensities for Irish domestic exporting firms compared to their British counterparts. In 2000, for instance, Irish domestic exporters’ R&D spend made up 16.7 percent of their total sales compared to an overall spend of 3.2 percent for British firms. This pattern was repeated for successive years. What seems clear across both
10 This pattern is also evidenced by Love and Roper (2001).
countries is the heavier involvement of domestic exporters in R&D than domestic non- exporters. This may well be result of underlying sectoral variation in the data where traditionally high-technology industries such as Pharmaceuticals with high export propensities are also R&D intensive.
Table 6: Average R&D intensity by nationality and export status (in percent)
Britain Ireland
Domestic exporter
Domestic non-exporter
Foreign exporters
Domestic exporter
Domestic non-exporter
Foreign exporters
2000 3.2 0.5 4.8 16.7 2.5 1.4
2001 1.9 1.1 4.4 12.0 9.8 6.5
2002 1.3 0.4 6.4 14.8 1.9 4.2
Calculated as total R&D expenditure over total turnover by firm type Source: linked BERD / FAME data deposited at ONS
Foreign non-exporters are omitted from this table as their numbers are too few in the Irish sample
In this section where we summarise the data, we look finally at the breakdown of our data by exporting and R&D status in Table 7. The bulk of our firms in both panels are R&D active exporters, standing at 54.6 percent and 48.8 percent of all firms in the British and Irish samples respectively.
Table 7: Observations by export and R&D status
Britain Ireland
Non-R&D active R&D active Non-R&D active R&D active
Non-exporter 6.2% 18.5% 13.4% 6.1%
exporter 20.7% 54.6% 31.8% 48.8%
Total number of observations: 10,361
British Source: linked BERD / FAME data deposited at ONS Total number of observations for Ireland: 8,364 Irish Source: Annual Business Survey at Forfás
5 Methodology
We have demonstrated in our motivation to our paper how R&D has been shown to be one of the main determinants of the export decision. Analogously, firms can expect to improve their R&D capability through the process of exporting (learning-by-exporting effects).
Similar to Aw et al (2005) we formulate the export and R&D decision interdependently as a bivariate probit. More specifically, we estimate the probability of a firm being an exporter in time t as a function of a number of firm characteristics:
Prob(Expt = 1) =
f(lagged export status, lagged R&D status, lagged firm characteristics) (1)
Similarly, the probability that a firm undertakes R&D in time t is modelled as
Prob(R&Dt = 1) =
f(lagged R&D status, lagged export status, lagged firm characteristics) (2)
The dependent variable in equation (1) is a dummy variable equal to one if the firm is an exporter in the current year, zero if not. The explanatory variables in this equation are chosen based on the related literature on the determinants of exports (e.g., Bernard and Jensen, 2004; Girma et al., 2004a). Following this literature, we include the lagged export status, i.e., a dummy variable equal to one if the firm was an exporter in year t-1 in order to account for the importance of sunk costs. Other lagged firm characteristics in equation 2 are lagged productivity, lagged average wages, lagged employment and a dummy variable indicating the nationality of the firm (whether foreign or domestic). We now describe the rationale for including this set of covariates.
Lagged productivity as a measure of firm efficiency is in line with existing work (Barrios et al., 2003; Bernard and Jensen, 2004; Aw et al., 2007). Lagged average wage is included as a proxy for employee skill intensity, again in line with existing work (Bleaney and Wakelin, 2002; Bernard and Jensen, 2004; Ruane and Sutherland, 2005).11 Employment
11 The intuition for using average wage as a skills proxy rests on Mincer’s (1974) human capital earnings function who shows a regression relationship between earnings, education and experience based on human
size features in existing work as a covariate in estimating exporting and/or R&D propensity (Love and Roper, 2001; Lachenmaier and Wößmann, 2006; Barrios et al., 2003; Ruane and Sutherland, 2005). We include the nationality of firms although fewer existing studies have been able to incorporate this measure (Love and Roper, 2001; Girma et al., 2004b). The intuition behind including ownership status is that domestic firms have arguably more to gain in terms of knowledge transfer from their export activities since foreign MNEs, by default, are already globally engaged.
Equation 2 models the determinants of firms’ probability of undertaking R&D. The dependent variable is a dummy equal to one if it has any positive R&D expenditure in t, zero if not. The explanatory variables include a dummy indicating the R&D status of the firm in the previous period (equal to one if R&D active in t-1) in order to allow for persistence in the R&D decisions of firms. Other firm characteristics included are the same as in the export decision equation, as these are arguably all important in the R&D decision as well.12 Also, to test for the importance of previous export activity causing new R&D expenditure we include a dummy equal to one if a firm was an exporter in the previous period t-1.
In this set up it is likely that the error terms of the two equations are correlated, not least since the dependent variable in each equation is among the right hand side variables in the other equation. In order to take account of this relationship – the variables are jointly determined – the model needs to be estimated simultaneously. We do this using a bivariate probit estimation technique, which estimates a two equation probit model using maximum likelihood techniques (see, e.g., Greene 2000 for a description).
6 Results
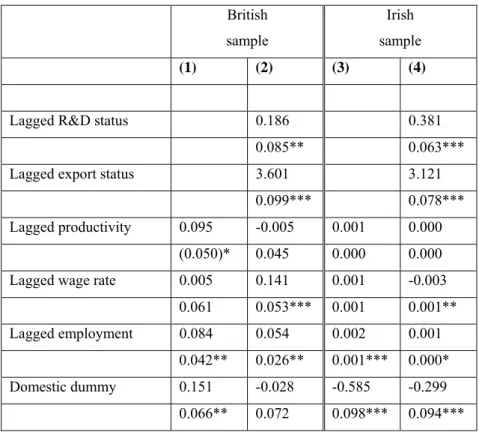
Table 8 outlines our results for the pooled panels. Evidence of self-selection would be detected in the exporting decision equation by a positive signed coefficient on lagged productivity. We find that ex ante more productive firms are not significantly more likely to export in Ireland (Columns 3 and 4). This same pattern is not quite true for British firms
capital theory. Willis (1999) provides a good review of this literature showing the positive role of human capital in determining wage rates.
12 See, for example, Hall (2002) for an overview of determinants of firms’ R&D activities.
where lagged productivity is significant, at least when lagged R&D and export status are excluded from the estimations (Column 1). However, once R&D and export status are included in the British estimations, selection effects disappear (Column 2).13
Larger firms are more likely to export, in both Britain and Ireland. Not surprisingly, when lagged export and R&D status is added in columns (2) and (4) for the British and Irish samples respectively, we find that there is persistence in exporting activity. Once a firm exports, it is more likely to do so in successive years. Furthermore, innovative firms are indeed more likely to export. This finding is in line with the idea that innovation strengthens the competitive base of a firm and enables it to successfully enter export markets. There is also the suggestion that Ireland is an export platform for foreign firms going by the negative sign on the domestic dummy. The effects of the average wage on the export decision for either British or Irish firms are not clear as the coefficient is not robust to the inclusion of lagged variables in column (2) or (4).
Panel B presents the results for the R&D equation. Positive learning-by-exporting effects are seen for Irish firms alone, judging by the positive coefficient for export status (Column 4). British firms report a negative and statistically insignificant sign for export status (Column 2). Testing for differences in the size of the coefficients for Britain and Ireland respectively gives a t-test statistic of -65.19 which is clearly significant.14
Commenting on the relationship between the other covariates and R&D we find that lagged size is statistically correlated with R&D activity for both British and Irish firms. For British firms the probability of undertaking R&D falls with increasing size.15 For Irish firms, this situation is reversed, with higher R&D probabilities attaching to larger firms.
Only for Irish firms do we see a significant positive impact of average wage on the probability of undertaking R&D. This variable is insignificant for British firms.
Taken together, these results suggest that there is persistence in innovative activity, but that there is no statistically significant evidence to suggest that there are direct ‘learning-by-
13 It is obvious that the latter two variables are correlated with productivity in the British sample.
14 Testing the differences in the coefficients under the assumption of different populations (unpaired t-test)
15 A similar negative relationship between size and R&D activity was reported by Love and Roper (2002) for a sample of UK manufacturing plants.
exporting’ effects on R&D activity for British firms. Conversely, Irish firms demonstrate
‘learning-by-exporting’ effects.
The nature of the non-linear simultaneous estimation technique implies that we cannot interpret the regression coefficients straightforwardly. In order to get an idea of the economic significance of the variables included in the model we can calculate the effect of a change in one of the lagged dummy variables on the joint probability that a firm exports and undertakes R&D.16 We calculate marginal effects for our R&D and exporting dummy variables from our estimations in columns 2 and 4 of Table 9 for Britain and Ireland respectively. We first turn to the British firms in our sample. We can determine that the probability of jointly exporting and undertaking R&D for a firm that was an exporter in the previous year is 64 percent higher than for a non-exporter. Also, the probability of jointly doing both is 34 percent higher for a firm that undertook R&D in t-1 than for one that did not. For Irish firms, the probability of jointly exporting and undertaking R&D is 52 percent higher for an exporter. The probability of jointly doing both is 80 percent higher for a firm that undertook R&D in t-1 than for one that did not. Hence, as suggested by the coefficients in the probit estimation, even when taking into account possible feedback mechanisms in the simultaneous estimation we find much stronger effects of previous export activity on current R&D for Irish than for British firms.
[Table 8 here]
The estimations thus far assume that domestic and foreign firms react in the same way to changes in firm characteristics. This may, however, not be a reasonable assumption, not least given the recent insights into the causes and consequences of firm level heterogeneity (e.g., Helpman et al., 2004; Girma et al., 2004a) and the possibility that foreign multinationals use the country as an export platform – this is particularly an issue in the case of Ireland (Barry and Bradley, 1997). In order to allow the determinants of exporting and R&D to vary across ownership groups we therefore split our sample into domestic and foreign-owned firms and we estimate the above empirical model separately for these two sub-samples. In all other respects, the empirical model is the same as that underlying the
16 These marginal effects are calculated based on the coefficients and evaluating covariates at their mean.
Greene (1996) derives the marginal effects for a conditional mean function in a bivariate probit model.
results in Table 9. The results of this exercise are reported in Tables 9 and 10 for domestic and foreign owned firms, respectively.
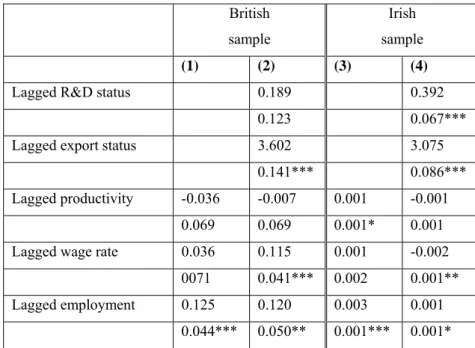
Table 9 reports our estimations having excluded foreign firms. This time we do not see evidence of self-selection for either British or Irish firms.17 However, R&D appears to play a major role in determining the probability of exporting in Ireland, going by the large and significant coefficient on lagged R&D status. Again, consistent with what we saw earlier in the pooled regressions, there is persistence in exporting (a positive sign on lagged export status).
Panel B allows us to look for learning-by-exporting effects. From columns 2 and 4, we see that the size and significance levels of the lagged export status coefficient suggests large and significant direct learning-by-exporting effects for Irish domestic exporters. The coefficient sign, although positive for British firms, is statistically insignificant – in line with the estimations for the full sample in Table 8. We calculate a t-test statistic of -38.93 for the difference in the size of the coefficients in both countries, again a significant value.
Like in our pooled regressions, there are cross-country differences in the role of size on the R&D decision. In Britain there are diminishing returns to size on the probability of undertaking R&D. In Ireland, firm has a positive effect on the R&D decision (columns 1 and 3).
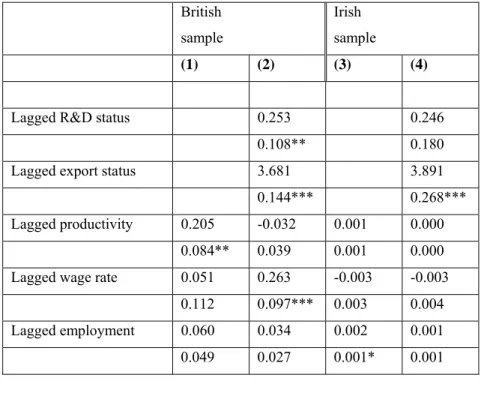
On a final note, we would not expect to see positive or significant learning-by-exporting effects for foreign firms exporting out of either Britain or Ireland and this is borne out in results contained in Table 10.18 This is because MNEs are expected to have by default sourced their technology from abroad. They have nothing new to learn from the exporting experience.
We look at Panel B of Table 10, focussing on the R&D decision. Similar to what we have seen in the previous 2 estimations, R&D capability seems biased towards large firms in Ireland compared to a bias towards smaller firms in Britain, going by the opposing signs on
17 The coefficient of lagged productivity is positive but small and weakly significant for Ireland when lagged R&D and export status are excluded from the estimation. With the inclusion of these variables, selection effects disappear.
18 The sign on the coefficient for export status, is actually negative for foreign firms in Britain but only marginally significant
the coefficient for lagged employment. Looking specifically for learning-by-exporting effects by observing the coefficient on lagged export status, no such effects are noted for foreign MNEs in Ireland and negative effects for foreign MNEs operating out of Britain. In line with our expectation, learning-by-exporting effects can only be accurately attributed to domestic firms, not foreign firms where FDI can blur the signal.
[Tables 9 and 10 here]
7 Conclusion
We find that previous exporting experience enhances the innovative capability of Irish firms through increasing R&D activity. In other words, Irish firms exhibit positive learning-by-exporting effects. Conversely, we do not find strong evidence for such direct effects of previous exporting on R&D for British firms.
Arguably the differential effect of exporting on R&D capability in Ireland and Britain is a consequence of different, cross-country exporting patterns. World Bank statistics show that firms in the Irish high-technology sector are more likely to export to OECD markets than their UK counterparts. Irish firms might be forced to work harder at producing innovative outputs given the relative sophistication of such markets. We also see that Irish domestic exporters have a comparatively high R&D spend than their British counterparts. Possibly Irish firms are better able to learn from sophisticated foreign competitors in their export markets than their British peers.
References
Aw, B., M. Roberts and T. Winston, 2007, ‘The complementary role of exports and R&D investments as sources of productivity growth’, The World Economy, Vol. 30, pp. 83-104
Baldwin, J. and W. Gu, 2003, ‘Export-market participation and productivity performance in Canadian manufacturing’, Canadian Journal of Economics, v36, n3, pp.634-657
Barrios, S., H. Görg and E. Strobl, 2003, ‘Explaining firms’ export behaviour: R&D, spillovers and the destination market’, Oxford Bulletin of Economics and Statistics, 65, 475-496
Bernard, A. and J. Jensen, 1999, ‘Exceptional exporter performance: cause, effect, or both?’ Journal of International Economics, v47, pp. 1-25
Bernard, A. and B. Jensen, 2004, ‘Why some firms export’, Review of Economics and Statistics, v86, n2, pp. 561 - 569
Bleaney, M. and Wakelin, K., 2002, ‘Efficiency, Innovation and Exports’, Oxford Bulletin of Economics and Statistics, v64, 3-15.
Cassidy, M., H. Görg and E. Strobl, 2005, “Knowledge Accumulation, and Productivity:
Evidence from Plant-Level Data for Ireland”, Scottish Journal of Political Economy, v52, n3, pp. 344-58
Girma, S., D. Greenaway and R. Kneller, 2004a, ‘Does exporting lead to better performance? A microeconometric analysis of matched firms’, Review of International Economics, 12, 855-866
Girma, S., H. Görg and E. Strobl, 2004b, ‘Exports, international investment and plant performance: evidence from a non-parametric test’, Economics Letters, v83, pp.317-324
Greene, W., 2000, Econometric Analysis, 4th Edition. Prentice Hall
Greenhalgh, C., 1990, ‘Innovation and trade performance in the United Kingdom’, Economic Journal, v100, pp105-118
Greenhalgh, C. and P. Taylor, 1994, ‘Innovation and export volumes and prices: a disaggregated study’, Oxford Economic Papers, v46, n1, pp.102-124
Grossman, G and E. Helpman, 1995, Technology and Trade, pp.1279-1337. Amsterdam, New York and Elsevier, North-Holland
Grossman, G and E. Helpman, 1991, Innovation and growth in the global economy, Cambridge, Mass. and London: MIT Press
Harris, R. and Q.C. Li, 2005, ‘Review of the literature: the role of international trade and investment in business growth and development’, Report for UKTI, London
Helpman E., M.J. Melitz and S.R. Yeaple, 2004, ‘Export versus FDI with heterogeneous firms’, American Economic Review, v94, n1, pp. 300-316
Hobday, M., 1995, ‘East Asia latecomer firms: Learning the technology of electronics’, World Development, v23, v7, pp. 1171-1193
Krugman, P, 1979, ‘A model of innovation, technology transfer and the world distribution of income’, Journal of Political Economy, v87, n2, pp. 253- 266
Lachenmaier, S. and L. Wößmann, 2006, ‘Does innovation cause exports? Evidence from exogenous innovation impulses and obstacles using German micro data’, Oxford Economic Papers, 58, 317-350
Love, J. and S. Roper, 2001, ‘The determinants of export performance: panel data evidence for Irish manufacturing plants’, NIERC Working Paper Series No. 69
MacGarvie, M., 2005, ‘The determinants of international knowledge diffusion as measured by patent citations, Economics Letters, v87, n1, pp. 121-126
Mincer, J., 1974, Schooling, Experience and Earnings, Columbia University Press, New York (N.Y.)
Romer, P., 1990, ‘Endogenous technical change’, Journal of Political Economy, v98, pp.71-102
Ruane, F. and J. Sutherland, 2005, ‘Export Performance and Destination Characteristics of Irish Manufacturing Industry’, Review of World Economics/Weltwirtschaftliches Archiv, v141, n3, pp. 442-59
Salomon, R. and J. Shaver, 2005, ‘Learning by exporting: new insights from examining firm innovation’, Journal of Economics and Management Strategy, v14, pp. 431 – 460
Sterlacchini, A., 2001, ‘The determinants of export performance: A firm level study in Italian manufacturing, Review of World Economics, Vol. 137, No. 3.
Vernon, R., 1966, ‘International Investment and International Trade in the Product Cycle’, Quarterly Journal of Economics, v82, n2, pp. 190-207
Wakelin, K., 1998, ‘Innovation and export behaviour at the firm level’, Research Policy, v26, n7/8, pp.829-841
Willis, R, 1999, ‘Wage determinants: a survey and reinterpretation of human capital earnings functions’, in Ashenfelter and Card (eds.), Handbook of Labor Economics, v1, ch10, Elsevier, Amsterdam
Young, A., 1991, ‘Learning by doing and dynamic effects of international trade’, Quarterly Journal of Economics, v106, n2, pp.369-405
Table 8: Results of bivariate probit regressions for all firms
Panel A: Export decision
British sample
Irish sample
(1) (2) (3) (4)
Lagged R&D status 0.186 0.381
0.085** 0.063***
Lagged export status 3.601 3.121
0.099*** 0.078***
Lagged productivity 0.095 -0.005 0.001 0.000 (0.050)* 0.045 0.000 0.000 Lagged wage rate 0.005 0.141 0.001 -0.003
0.061 0.053*** 0.001 0.001**
Lagged employment 0.084 0.054 0.002 0.001 0.042** 0.026** 0.001*** 0.000*
Domestic dummy 0.151 -0.028 -0.585 -0.299
0.066** 0.072 0.098*** 0.094***
Panel B: R&D decision
British sample
Irish sample
(1) (2) (3) (4) Lagged R&D status 0.949 2.783
0.051*** 0.053***
Lagged export status -0.052 0.224
0.062 0.068***
Lagged productivity -0.010 -0.022 -0.001 -0.000 0.027 0.026 0.000* 0.000 Lagged wage rate -0.035 0.042 0.005 0.001 0.035 0.034 0.002** 0.001 Lagged employment -0.095 -0.076 0.001 0.001
0.023*** 0.019*** 0.000*** 0.000***
Domestic dummy 0.061 0.029 0.445 0.283 0.050 0.043 0.075*** 0.063***
Observations 5084 5084 5995 5995 Log pseudolikelihood -5038.5 -3239.8 -6149.1 -2361.2
ρ 0.172 1.47 111.391 12.95
Prob ρ = 0 0.6779 0.225 0.0000 0.0000 Source: linked BERD / FAME data deposited at ONS for Britain, ABSEI for Ireland
Regressions include full set of time and two digit industry dummies Regression coefficients and robust standard errors reported
Table 9: Results of bivariate probit regressions for domestic firms
Panel A: Export decision
British sample
Irish sample
(1) (2) (3) (4) Lagged R&D status 0.189 0.392
0.123 0.067***
Lagged export status 3.602 3.075
0.141*** 0.086***
Lagged productivity -0.036 -0.007 0.001 -0.001 0.069 0.069 0.001* 0.001 Lagged wage rate 0.036 0.115 0.001 -0.002
0071 0.041*** 0.002 0.001**
Lagged employment 0.125 0.120 0.003 0.001 0.044*** 0.050** 0.001*** 0.001*
Panel B: R&D decision
(1) (2) (3) (4) Lagged R&D status 0.902 2.697
0.066*** 0.061***
Lagged export status 0.041 0.280
0.087 0.069***
Lagged productivity -0.005 0.008 0.001 0.001 0.055 0.052 0.001 0.001 Lagged wage rate -0.046 -0.001 0.003 0.001
0.052 0.044 0.002 0.001 Lagged employment -0.074 -0.059 0.002 0.001
0.030** 0.025** 0.001*** 0.000 Observations 2841 2841 4318 4318 Log pseudolikelihood -2729.8 -1816.6 -4678.2 -1853.7
ρ 0.9005 0.0116 111.988 11.24
Prob ρ = 0 0.343 0.914 0.00 0.00
Source: linked BERD / FAME data deposited at ONS for Britain, ABSEI for Ireland Regressions include full set of time and two digit industry dummies
Regression coefficients and robust standard errors reported
Table 10: Results of bivariate probit regressions for foreign firms
Panel A: Export decision
British sample
Irish sample
(1) (2) (3) (4)
Lagged R&D status 0.253 0.246
0.108** 0.180
Lagged export status 3.681 3.891
0.144*** 0.268***
Lagged productivity 0.205 -0.032 0.001 0.000 0.084** 0.039 0.001 0.000 Lagged wage rate 0.051 0.263 -0.003 -0.003
0.112 0.097*** 0.003 0.004 Lagged employment 0.060 0.034 0.002 0.001 0.049 0.027 0.001* 0.001
Panel B: R&D decision
(1) (2) (3) (4)
Lagged R&D status 1.011 3.033
0.076*** 0.112***
Lagged export status -0.145 -0.089
0.082* 0.242
Lagged productivity -0.014 -0.036 -0.001 -0.001 0.033 0.033 0.000** 0.001 Lagged wage rate -0.019 0.087 0.006 -0.001
0.053 0.051* 0.004 0.003 Lagged employment -0.111 -0.088 0.001 0.001
0.035*** 0.027*** 0.000*** 0.001***
Observations 2243 2243 1667 1667 Log pseudolikelihood -1413.3 -2282.4 -1368.6 -471.4
ρ 3.93 3.363 3.322 5.366
Prob ρ = 0 0.0472 0.0667 0.068 0.021
Source: linked BERD / FAME data deposited at ONS for UK, ABSEI for Ireland Regressions include full set of time and two digit industry dummies
Regression coefficients and robust standard errors reported