Research Collection
Journal Article
Three decades of post-logging tree community recovery in
naturally regenerating and actively restored dipterocarp forest in Borneo
Author(s):
Hayward, Robin M.; Banin, Lindsay F.; Burslem, David F.R.P.; Chapman, Daniel S.; Philipson, Christopher D.; Cutler, Mark E.J.; Reynolds, Glen; Nilus, Reuben; Dent, Daisy H.
Publication Date:
2021-05-15 Permanent Link:
https://doi.org/10.3929/ethz-b-000474336
Originally published in:
Forest Ecology and Management 488, http://doi.org/10.1016/j.foreco.2021.119036
Rights / License:
Creative Commons Attribution 4.0 International
This page was generated automatically upon download from the ETH Zurich Research Collection. For more
information please consult the Terms of use.
Forest Ecology and Management 488 (2021) 119036
Available online 26 February 2021
0378-1127/© 2021 The Authors. Published by Elsevier B.V. This is an open access article under the CC BY license (http://creativecommons.org/licenses/by/4.0/).
Three decades of post-logging tree community recovery in naturally regenerating and actively restored dipterocarp forest in Borneo
Robin M. Hayward
a,b,*, Lindsay F. Banin
b, David F.R.P. Burslem
c, Daniel S. Chapman
a, Christopher D. Philipson
d,e, Mark E.J. Cutler
f, Glen Reynolds
g, Reuben Nilus
h, Daisy H. Dent
a,iaBiological and Environmental Sciences, University of Stirling, Stirling FK9 4LA, Scotland, UK
bUK Centre for Ecology & Hydrology, Midlothian EH26 0QB, Scotland, UK
cSchool of Biological Sciences, University of Aberdeen, Cruickshank Building, St Machar Drive, Aberdeen AB24 3UU, Scotland, UK
dDepartment of Environmental Systems Science, ETH Zürich, Universit¨atstrasse 16, 8092 Zürich, Switzerland
ePermian Global Research Limited, Savoy Hill House, 7-10 Savoy Hill, London WC2R 0BU, UK
fSchool of Social Sciences, University of Dundee, Dundee DD1 4HN, Scotland, UK
gSEARRP, Danum Valley Field Centre, PO Box 60282, 91112 Lahad Datu, Sabah, Malaysia
hSabah Forestry Department, Locked Bag 68, Mile 6, Labuk Road, 90000 Sandakan, Sabah, Malaysia
iSmithsonian Tropical Research Institute, Balboa, Panama
A R T I C L E I N F O Keywords:
Selective logging Tropical forest Lowland rain forest Silviculture Enrichment planting Species diversity
A B S T R A C T
Selective logging has affected large areas of tropical forests and there is increasing interest in how to manage selectively logged forests to enhance recovery. However, the impacts of logging and active restoration, by liberation cutting and enrichment planting, on tree community composition are poorly understood compared to trajectories of biomass recovery. Here, we assess the long-term impacts of selective logging and active restoration for biomass recovery on tree species diversity, community composition, and forest structure. We censused all stems ≥2 cm diameter at breast height (DBH) on 46 permanent plots in unlogged, primary forest in the Danum Valley Conservation Area (DVCA; 12 plots, totalling 0.6 ha) and in sites logged 23–35 years prior to the census in the Ulu Segama Forest Reserve adjacent to DVCA (34 plots, totalling 1.7 ha) in Sabah, Malaysian Borneo. Active restoration treatments, including enrichment planting and climber cutting, were implemented on 17 of the logged forest plots 12–24 years prior to the census. Total plot-level basal area and pole (5–10 cm DBH) stem density were lower in logged than unlogged forests, however no difference was found in stem density amongst saplings (2–5 cm DBH) or established trees (≥10 cm DBH). Neither basal area, nor plot-level stem density varied with time since logging at any size class, although sapling and pole stem densities were lower in actively restored than naturally regenerating logged forest. Sapling species diversity was lower in logged than unlogged forest, however there were no other significant effects of logging on tree species richness or diversity indices. Tree species composition, however, differed between logged and unlogged forests across all stem size classes (PER- MANOVA), reflected by 23 significant indicator species that were only present in unlogged forest. PERMANOVA tests revealed no evidence that overall species composition changed with time since logging or with active restoration treatments at any size class. However, when naturally regenerating and actively restored commu- nities were compared, two indicator species were identified in naturally regenerating forest and three in actively restored forests. Together our results suggest that selective logging has a lasting effect on tree community composition regardless of active restoration treatments and, even when species richness and diversity are stable, species composition remains distinct from unlogged forest for more than two decades post-harvest. Active restoration efforts should be targeted, monitored, and refined to try to ensure positive outcomes for multiple metrics of forest recovery.
* Corresponding author at: Biological and Environmental Sciences, University of Stirling, Stirling FK9 4LA, Scotland, UK.
E-mail address: robinmhayward@gmail.com (R.M. Hayward).
Contents lists available at ScienceDirect
Forest Ecology and Management
journal homepage: www.elsevier.com/locate/foreco
https://doi.org/10.1016/j.foreco.2021.119036
Received 27 November 2020; Received in revised form 31 January 2021; Accepted 3 February 2021
1. Introduction
More than 20% of tropical forests were selectively logged during the first five years of the 21st century, and recent estimates suggest that more than half of the tropical forest biome may now have been logged (Asner et al., 2009, Laurance et al., 2014). In selectively logged forests, which account for 95% of the tropical timber harvest (Asner et al., 2009), the majority of trees remain standing, retaining residual repro- ductive adults that provide a source of propagules for natural recovery of biodiversity and ecosystem functioning. By contrast to clear-fell log- ging, whereby all stems are removed, selective logging aims to remove only ~4–15 stems per hectare and targets the largest trees (usually >40 cm diameter at breast height; DBH at c. 1.3 m) and the highest quality timber species (Pinard and Putz, 1996, Edwards et al., 2014). As such, selective harvesting performed with adequate care and at sufficiently long harvesting intervals may represent an acceptable middle-ground between high levels of timber extraction and strict protection (Mei- jaard, 2005, Berry et al., 2010, Putz et al., 2012, Edwards and Laurance, 2013). However, the impacts of logging on tree species diversity and community composition are still poorly understood.
While selective logging is prevalent throughout the tropics, the is- land of Borneo alone has generated greater exports of timber than the African and American tropics combined (Cleary et al., 2007). These high extraction volumes reflect the abundance of valuable timber, particu- larly species in the family Dipterocarpaceae, combined with the rapid economic development of Malaysia after gaining independence in the second half of the 20th century (Brookfield and Byron, 1990). Forests in Borneo were first selectively logged in the early 1970s and have a pro- jected interval of 40–60 years between harvests in production forests (Sist et al., 2003), although actual cutting cycles are frequently shorter (Reynolds et al., 2011). At present, over 62% of the forest area in Malaysian Borneo is considered degraded (Bryan et al., 2013) and, of the remaining primary forest, 42% is allocated for potential selective log- ging and 16% for conversion to agriculture (Gaveau et al., 2014). Given the extent of forest ecosystems affected by selective logging and the potential for this area to expand, it is critical that we understand the long-term impacts of selective logging and the capacity for forests to recover over time.
Selectively logged forest has been demonstrated to provide valuable habitat for forest animals and migration corridors between areas of undisturbed forest (Edwards et al., 2011, Wearn et al., 2017). Indeed, in selectively logged forest, over half the total area is not directly disturbed by logging operations (Putz et al., 2019). There is widespread consensus that logged forests have a relatively high conservation potential for forest animals due to their functional similarity to unlogged forest habitat, although these habitats may not support all rare bird and mammal species (Meijaard, 2005, Wells et al., 2007, Edwards et al., 2011, Putz et al., 2012, Wearn et al., 2017). Research on plant com- munities in logged forests has shown that overall species richness and the abundance of most species tend to be resilient to the impacts of se- lective logging (Berry et al., 2010, Putz et al., 2012). However, shifts in the abundance of a few key species can drive notable reductions in biodiversity, as well as changes to community structure and the physical structure of the forest (Foody and Cutler, 2003, Putz et al., 2012). These abundant species, as well as metrics of community composition, can be valuable indicators of degradation and the effectiveness of biodiversity conservation efforts (Imai et al., 2014, Fujiki et al., 2016).
In Borneo, logging reduces the density of large hardwoods, pre- dominantly from the family Dipterocarpaceae, which are targeted for harvesting, and tends to increase the abundance and basal area of early successional pioneer species (Berry et al., 2008). In terms of forest structure and biomass recovery, it is estimated that above ground biomass takes approximately 60 years to recover in logged forest (Berry et al., 2010, Philipson et al., 2020), although below ground biomass may take substantially longer (Martin et al., 2013). In contrast, the recovery time needed for tree community composition to match an undisturbed
reference state may take anywhere from 50 to several hundred years (Appanah et al., 1990, Foody and Cutler, 2003, Putz et al., 2012). This time frame is generally longer than the minimum harvesting interval projected for Borneo (Sist et al., 2003, Reynolds et al., 2011), suggesting that plant community effects may accumulate through repeated cycles of logging.
Restoration strategies to mitigate the negative effects of timber extraction include rehabilitation-for-conservation and carbon capture mechanisms, and investment by the selective logging industry to enable shorter harvesting intervals by enhancing regeneration and growth of valuable stems (Fredericksen and Putz, 2003, Pe˜na-Claros et al., 2008).
Depending on which of these goals the restoration strategy targets, different actions may be taken (e.g. replanting a single valuable species for profit vs replanting a range of adversely affected native taxa for conservation), leading to distinct tree communities post-restoration.
Most commonly, active restoration strategies employ a combination of enrichment planting, in which seedlings of valuable timber species are transplanted into logged forests (Kettle, 2010), and liberation thinning, which may involve cutting back stems of early successional species, and liana cutting, to increase light availability and allow target tree species to effectively compete for resources (van der Heijden et al., 2015, Marshall et al., 2017). Despite the intention of these techniques to promote growth and carbon-capture, a recent global meta-analysis casts doubt on whether active restoration techniques post-logging result in shorter recovery times, or instead whether they induce a lag in diversity and vegetation structure recovery relative to natural regeneration pro- cesses (Crouzeilles et al., 2017). Crouzeilles et al (2017) did not assess community composition trajectories however, nor provide region- specific recovery estimates for richness and diversity, and long-term assessments of community recovery are still much needed.
Trajectories of recovery in tree community composition and di- versity over time have rarely been explored in selectively logged Southeast Asian forests. Typically, studies compare species assemblages at one or two discrete time points since logging with an unlogged comparison or pre-logging record of the tree community (Okuda et al., 2003, Bischoff et al., 2005, Berry et al., 2008). While these studies provide valuable insights to community recovery, they lack information on directional trends in changing community composition with time.
Here we present data across a 12-year post-logging chronosequence in Bornean lowland dipterocarp forest to explore tree community richness, diversity, and composition of neighbouring plots 23–35 years after logging, which were either left to regenerate naturally or were subject to active restoration treatments. Where plots were actively restored for improved carbon uptake, we explore the ecological co-benefits to the tree community 12–24 years after treatment. Specifically, we address the following questions:
1. How does selective logging affect stem density, basal area, richness and diversity of tree species, and tree community composition when compared with neighbouring unlogged forest?
2. Does the trajectory of recovery over time for these metrics differ between selectively logged forests that regenerate naturally compared to those that were actively restored?
We approach these questions for the tree community as a whole and at three distinct stem size classes (saplings 2–5 cm DBH, poles 5–10 cm DBH, and established trees DBH ≥10 cm) to understand how logging and restoration affect successional processes across tree life stages.
2. Methods
2.1. Study site and land-use history
Forest plots were located in unlogged primary forest in the Danum Valley Conservation Area (DVCA) and selectively logged forest in the adjacent Ulu Segama Forest Reserve (USFR). The DVCA comprises 438
km2 of primary lowland dipterocarp and lower montane rainforest (200–1000 m above sea level), contiguous with a 10 000 km2 logging concession in East Sabah, Malaysian Borneo (Howlett and Davidson, 2003, Reynolds et al., 2011). Mean daily temperatures range from 22.5
◦C to 30.9 ◦C and mean annual rainfall is ~2700 mm over an average of 220 days with rain (Marsh and Greer, 1992, Walsh and Newbery, 1999).
Over 15 000 plant species (including 511 tree species across 59 families) have been identified in the DVCA, with at least 247 of these able to grow beyond 10 cm diameter at breast height (DBH) (Newbery et al., 1992). The DVCA tree community is characterised by the domi- nance of the family Dipterocarpaceae, which has especially valuable timber (Newbery et al., 1992). The few early successional tree species within the primary forest flora of DVCA mostly belong to the family Euphorbiaceae (Berry et al., 2008).
Adjacent to the DVCA is a region of selectively logged forest within the USFR, harvested in annual coupes (designated logging areas) be- tween 1981 and 1993 (23–35 years prior to the census used as the basis for this paper) (Foody and Cutler, 2003). The logging coupes were typically ~27 km2 (Foody and Cutler, 2003) and were harvested using either tractor (for moderate terrain) or high-lead (for steep slopes) logging techniques (Pinard et al., 2000). In addition, the coupes include a trial of the Reduced Impact Logging (RIL) technique in 1993, wherein damage to non-targeted vegetation was minimised through directional felling, cutting of climbers before felling, and adjusted harvest and skid- trail planning (Pinard and Putz, 1996, Pinard et al., 2000). Across all harvest types, each coupe was selectively logged only once, during which all commercially viable trees >60 cm DBH were harvested, resulting in mean timber extraction of 118 m3 ha−1, although variation within and between coupes was substantial and estimated to range from 42.49 m3 ha−1 to 309.56 m3 ha−1 (Foody and Cutler, 2003).
Active restoration was undertaken for a subset of the forest coupes logged in 1981, 1982, 1983, 1988, and 1989 (Fig. 1), by silvicultural intervention from 1992 to 2004 (12–24 years prior to census) as part of the Innoprise-FACE Foundation Rainforest Rehabilitation Project (INFAPRO), while other areas were left to regenerate naturally (Moura Costa, 1996, Face the Future, 2011). In actively restored areas, seedlings (~50 cm tall with 10 leaves and grown for 4–8 months in a nursery from locally collected seeds) of 52 species of dipterocarps, five non- dipterocarp canopy species, and 16 non-dipterocarp native fruit tree species (Table S1), were planted every 3 m along parallel lines (2 m wide and cut 10 m apart) an average of nine years after logging (Moura Costa,
1996, Face the Future, 2011). Enrichment plantings were primarily dipterocarps, which made up 90–95% of all planted seedlings (Face the Future, 2011). Additional native fruit trees and three early successional tree species were planted in particularly open sites (Face the Future, 2011). Early successional stems which were already present (i.e. not those which were planted), were girdled to reduce competition for re- sources (Face the Future, 2011). After the initial line cutting and planting, weeding was carried out every three months for three years (Moura Costa, 1996, Face the Future, 2011).
2.2. Forest inventory
In 2016, 46 circular forest plots (radius =12.61 m, area =500 m2) were censused across seven selective logging coupes (34 plots) and unlogged forest (12 plots) as part of the Indicators of Forest Sustain- ability (INDFORSUS) project network and the Forest Global Earth Observation Network (ForestGEO) (Fig. 1). Although the INDFORSUS project was established in 1996 (Foody and Cutler, 2003), we use only the 2016 census here due to poor taxonomic resolution of earlier re- cords. Four of these unlogged plots were positioned within the Danum 50 ha ForestGEO (Burslem et al., unpublished) and were selected by random placement of circular plot centroids within each quarter of the full 50 ha plot. Where tree positions overlapped the perimeter of the 12.61 m radius plot, their inclusion was decided based on the centre point of the tree.
Of the 34 plots in selectively logged forest, 17 were regenerating naturally and 17 were in areas that had been actively restored (Moura Costa, 1996). Plots in naturally regenerating forests had been logged in 1981 (one plot), 1988 (one plot), 1989 (four plots), and 1993 (five plots selectively logged using conventional techniques and six plots using reduced impact techniques). Plots in actively restored forest had been selectively logged in 1981 (four plots), 1982 (four plots), 1983 (four plots), 1988 (four plots), and 1989 (one plot) (see Fig. 1).
In each plot, all live stems ≥2 cm DBH (at 1.3 m or immediately above buttresses if higher) were recorded and subsequently categorised as saplings (2 cm ≤DBH <5 cm), poles (5 cm ≤DBH <10 cm) or established trees (DBH ≥ 10 cm). These size classes match previous studies within the same landscape which categorise saplings as <5 cm DBH (Stride et al., 2018) and small trees as <10 cm DBH (Berry et al., 2008). The established tree size class was then further divided into 10–40 cm, 40–60 cm, and ≥60 cm DBH subsets to allow additional exploration of effects amongst the large stems. Each stem was identified using leaf specimens, based on collections available at the Danum Valley Field Centre Herbarium and in collaboration with local botanical ex- perts. Across all size classes, 93.9%, 92.5%, and 72.1% of stems were identified to family, genus, and species levels, respectively. All dip- terocarps were identified to genus and 95.2% to species (Table S2).
Unidentified stems were assigned to distinct morphospecies which were consistent within the 2016 census. From these inventory data we derived plot-level stem density (i.e. the number of stems per 500 m2 plot) and plot-level basal area (the summed cross-sectional area of the recorded stems).
2.3. Data analysis
Total stem basal area was calculated from all DBH measurements in each plot, assuming circular tree cross-sections, and all stems were counted to represent forest structure. Species richness, rarefied richness, and Shannon’s Diversity and Evenness were calculated for each plot using the vegan package in R version 3.6.1 (R Core Team, 2017, Oksa- nen, 2019) to represent different dimensions of diversity.
To assess the effect of logging on structural and diversity metrics at each size class, we fitted generalised linear mixed models (GLMMs), comparing unlogged and naturally regenerating logged plots at each size class (Eq. (1); presented using R syntax for the lme4 package;
Bates et al., 2015). A set of GLMMs were also fitted to explain the same Fig. 1. Location of plots used in this study within the INDFORSUS and For-
estGEO plot networks in the Danum Valley Conservation Area and Ulu Segama Forest Reserve. Colours indicate logging and regeneration method (consistent throughout this paper). Coupes are labelled by logging year, WC (Water Catchment), CA (Conservation Area), or FGEO (the Forest Global Earth Ob- servatory study area). Access roads, which have been retained since logging, are shown in grey and the Segama River in blue. (For interpretation of the refer- ences to colour in this figure legend, the reader is referred to the web version of this article.)
metrics, using data from all selectively logged forest plots at each size class, testing the fixed effects of time since logging and regeneration method (natural vs active restoration) and their interaction (Eq. (2)). A single combined random effect of site (logging coupe or unlogged forest location; Fig. 1) and logging method (RIL, tractor, or high-lead) was included in each model (Philipson et al., 2020). Models with and without the interaction term between fixed effects were compared using Akaike Information Criterion (AIC) values, and the model with the lowest AIC (or the fewest terms if AIC differed by less than two) was selected to determine the best models for analysis (Symonds and Moussalli, 2011). GLMMs with Gaussian error distributions were used to analyse all metrics, except for plot-level stem density, which was modelled with a Poisson error distribution for all size classes. Basal area was log transformed prior to model fitting to account for positive skew, then back-transformed for presentation in the results. Each GLMM was validated by visual interpretation of residual diagnostic plots to check for linearity of model-fitted values and residuals, as well as verifying no significant leverage by any data point outside of Cook’s distance (Cook, 1977).
Response variable∼Logging+ (1|Site:Logging method) (1) Differences in community composition among plots were analysed by calculating the Bray-Curtis dissimilarity (Bray and Curtis, 1957) of
species abundances between plots within each stem size class (Oksanen, 2019). Bray-Curtis dissimilarity was chosen for these analyses as it is robust for both linear and rank correlations of ecological data (Faith et al., 1987). Permutational Analyses of Variance (PERMANOVA) were used to test the significance of differences in Bray-Curtis dissimilarity among tree community compositions in response to logging (unlogged vs naturally regenerating logged plots) and regeneration types (natural regeneration vs active restoration) (Bray and Curtis, 1957). A PERMA- NOVA was then performed to test the significance of time since logging for logged plot communities, irrespective of regeneration type. All PERMANOVA were performed using the adonis function in the vegan R package (Oksanen, 2019) because it is less sensitive to differences in data dispersion than other similar functions (Warton et al., 2012).
To explore taxon-specific changes, indicator species were identified for unlogged vs logged forest and naturally regenerating vs actively restored logged forest by stem abundance within each stem size class, using the multipatt function of the indicspecies package in R (C´aceres and Legendre, 2009). As determined by these analyses, a significant indi- cator species is able to predict the treatment of the forest in which it is recorded (e.g. unlogged forest) with 95% certainty, versus other known treatments (C´aceres and Legendre, 2009).
Each analysis described above was run for each size class, including subsets of the established tree size class (10–40 cm, 40–60 cm, and ≥60 cm DBH), however these subsets were limited by the low number of stems in the categories ≥40 cm DBH in our plots (total n =152).
Each analysis was run using the full taxonomic community and then again using only stems from the family Dipterocarpaceae, in order to compare general trends with those of the dominant family of large and commercially important timber trees. Due to potential bias from the greater taxonomic resolution of identification amongst smaller stems within the Danum ForestGEO 50-ha plot, the four plots from that data source were removed during analyses of the sapling and pole size classes where species richness, diversity, and evenness metrics or the commu- nity composition were considered. We are able to retain these plots for analyses of plot-level stem density, basal area, and in all analyses of
stems ≥10 cm DBH due to the more equitable taxonomic resolution of IDs for established trees. Data from all other plots were collected by the same field-team so, despite non-comprehensive identification of stems, we could be confident that unidentified stems were allocated to consistent morphospecies across the census and that each morphospe- cies was distinct from the list of resolved taxa.
3. Results
A total of 5466 stems ≥2 cm DBH was recorded on 46 plots (3831 in selectively logged and 1635 in unlogged forests; Table S2), which included 2927 saplings, 1428 poles and 1111 established trees (2–5 cm, 5–10 cm, and ≥10 cm DBH respectively). In total 545 species of trees and shrubs were recorded in 198 genera and 81 families, of which 689 stems of 37 species in five genera were Dipterocarpaceae.
3.1. Effects of selective logging history on forest structure
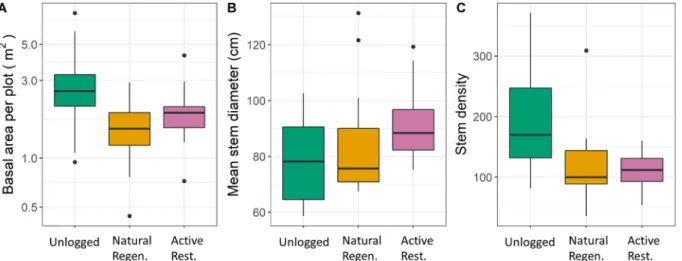
Mean (±SE) basal area of stems per 500 m2 plot was significantly higher in unlogged than naturally regenerating logged forest (3.828 ± 0.706 m2 vs 1.597 ±0.157 m2; GLMM P <0.001; Fig. 2; Table S3). This was reflected in the higher mean plot-level stem density in unlogged compared to naturally regenerating logged forests for poles (45.73 ±
6.21 vs 29.41 ± 4.05; P = 0.014), although stem density was not significantly different in saplings (98.64 ±11.43 vs 64.47 ±9.18; P = 0.065). Established tree stem density was unaffected by logging when all stems ≥10 cm DBH were considered (29.27 ±4.35 vs 20.82 ±2.18; P = 0.069, Table S4) but a marginally significant negative effect was found for stems 10–40 cm and ≥60 cm DBH (P =0.045 and 0.046; Table S4).
Considering dipterocarps alone, the plot-level stem density of poles was higher in unlogged than selectively logged plots (4.27 ±1.33 vs 3.17 ± 0.58; P =0.042), but there was no significant difference in the number of dipterocarp saplings or established trees (Table S4).
Within the logged forest, and whilst accounting for the effects of time since logging (23–35 years; Fig. 3, Table S5), plot-level stem density was lower in actively restored (12–24 years after treatment) than naturally regenerating plots for saplings (55.99 ± 4.27 vs 64.47 ± 9.18; P <
0.001) and poles (29.18 ±2.48 vs 29.41 ±4.05; P =0.002) after 23–35 years. Regeneration treatment had no effect on stems of established trees (25.59 ±1.33 vs 20.82 ±2.18; P =0.702; Fig. 3, Table S5) nor total basal area per plot (1.972 ±0.190 m2 vs 1.597 ±0.157 m2; P =0.091;
Fig. 2; Table S3), although mean DBH was higher in actively restored forest (91.64 ±3.14 cm vs 84.38 ±4.62 cm; P =0.034; Fig. 2; Table S3).
Standard errors of mean plot-level stem density were greater in naturally regenerating forest than actively restored forest at all size classes, indicating greater variability across plots. In saplings and poles, the relationship between plot-level stem density and time since logging differed between the naturally regenerating (slopes = − 0.018 and
− 0.005) and actively restored plots (slopes = 0.254 and 0.357), as demonstrated by the significance of the interaction term (P =0.014 and 0.018). There was no effect of time since logging for density of estab- lished tree stems and no change in total basal area over time (slope =
− 0.102, P =0.476; Table S3).
Dipterocarp plot-level stem density was lower in actively restored than naturally regenerating forest for saplings (P <0.001) and varied in relationship to time since logging (natural slope = −0.012, restored slope =1.076, interaction P =0.026). The effect of time since logging on dipterocarp established tree stem density also differed according to Response variable∼scale(Years since logging)*Regeneration method+ (1|Site:Logging method) (2)
restoration treatment (naturally regenerating slope = − 0.469, actively restored slope =0.740, interaction P =0.032). Dipterocarp pole stem density increased with time since logging (P =0.028) and this rela- tionship was consistent across restoration treatments (interaction term P =0.833; Table S5).
Across all models, exploration of the random effect estimates (a combination of site and logging method [Eq. (1) & (2)]) showed no consistent or substantial variation between RIL plots and other plots
logged in the same year.
3.2. Effects of selective logging history on tree richness and diversity Shannon’s diversity index of saplings was higher in unlogged than in naturally regenerating logged forest (3.374 ±0.088 vs 2.852 ±0.099; P
= 0.043, Table S4). No other measures of species richness, rarefied species richness, diversity, or evenness were significantly affected by Fig. 2. Box plots of structural metrics (per 500 m2 plot) calculated using all stems ≥2 cm DBH in unlogged (n =12), naturally regenerating logged (n =17), and actively restored logged forest (n =17): A) total stem basal area, B) mean stem DBH, C) stem density (stems per 500 m2).
Fig. 3.Effects of time since logging on stem density (stems per 500 m2 plot) of saplings (2–5 cm DBH), poles (5–10 cm DBH), and established trees (≥10 cm DBH) in actively restored and naturally regenerating forest for the full tree community (A, B, and C) and the Dipterocarpaceae (D, E, and F). Models where the effect of active regeneration was significant are marked * (P <0.05), ** (P <0.01), or *** (P <0.001). Models where the effect of time since logging was significant are marked ‡(P
<0.05). GLMMs were fitted with a Poisson error distribution and random effect of coupe and logging method; shading indicates 95% confidence intervals. Best models in panels A, B, D and F include an interaction term between active restoration and time since logging. Models where there is a significant interaction between active restoration and time since logging are marked ^ (P <0.05). Full GLMM summaries are presented in Table S5.
logging, within any size class (P >0.24; Table S4). In selectively logged forests, species evenness of established trees was higher in naturally regenerating than actively restored plots (0.962 ±0.005 vs 0.954 ± 0.007; P <0.043, Table S5), however there were no other significant effects of time since logging or regeneration treatment on species rich- ness, rarefied species richness, diversity, or evenness in any size class (P
> 0.05; Table S5). In dipterocarps, species richness, diversity, and evenness did not differ in response to implementing active restoration treatments, nor with time since logging, for any size class (P >0.19;
Table S5).
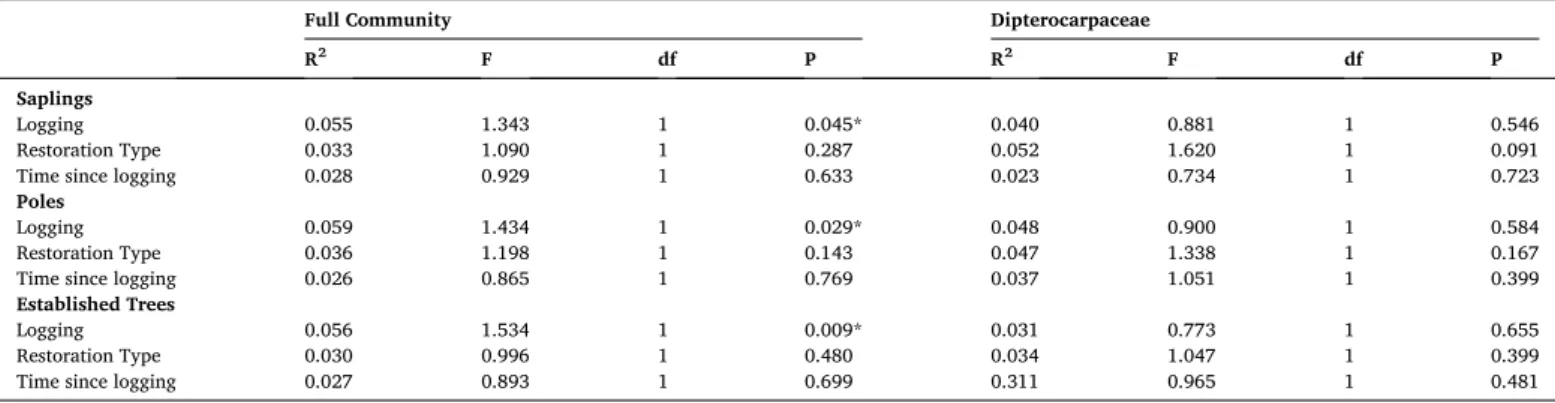
3.3. Effects of logging and active restoration on tree species composition Community composition was significantly different between natu- rally regenerating logged forest and unlogged forest for all size classes (PERMANOVA, P <0.05; Table 1). Exploring subsets of the established tree size class however, stems in the 40–60 cm and ≥60 cm DBH ranges showed no difference in community composition due to logging (P >
0.05; Table S6). There was no difference in community composition between naturally regenerating and actively restored logged forest (P >
0.14; Table 1). Comparisons of pairwise dissimilarity for the established tree community compositions suggest that, while there was high dissimilarity among all plots, unlogged forest exhibited particularly high community dissimilarity among plots (Fig. 4). By contrast, logged plot communities were on average more similar to one another, for com- parisons either within or between areas that were naturally regenerating or had been actively restored (Table 1; Fig. 4). There were no differences in dipterocarp community compositions at any size class in response to logging, implementation of an active restoration treatment, or for time since logging (PERMANOVA, P >0.09; Table 1). Although there were significant differences in selectively logged and unlogged forest com- munities, there was no directional change to community composition between 23 and 35 years post-logging within any size class (P >0.05;
Table 1), indicating a lack of community recovery in selectively logged forest on the multi-decadal timescale of our study.
There were 23 significant indicator species (whereby presence of an indicator species predicts logging treatment with 95% certainty) of unlogged forest across all size classes when data were pooled, and 14, 10, and 4 indicator species at the sapling, pole, and established tree size classes respectively (Table 2). By contrast, there were no significant indicator species of logged forest at any size class. When the logged forest plots were considered in isolation, there were two indicator spe- cies of naturally regenerating areas and three indicator species of actively restored areas (Table 2). Notably, Dryobalanops lanceolata was an indicator species of actively restored forest across all size classes (P = 0.008 − 0.034) and was one of the species planted during enrichment planting of those sites, as was Neolamarckia cadamba (P =0.045 in the
established tree size class; Table S1; Face the Future, 2011). Indicator species for the established tree size class, determined independently for stems 10–40 cm, 40–60 cm, and ≥60 cm DBH revealed a similar pattern, with no indicator species for logged (vs unlogged) or naturally regen- erating (vs actively restored) forest (Table S7).
4. Discussion
Our results link the tree communities now present in the DVCA and USFR with historic selective logging and restoration practices. Forest structure and community composition were both evidently affected by selective logging, despite little significant difference in richness or di- versity. Total stem basal area and stem density were higher in unlogged forest than in naturally regenerating logged forest, driven by greater stem density in the pole size class. In logged forest, sapling and pole stem density increased with time since logging across the censused chro- nosequence for actively restored areas. By contrast, in naturally regen- erating forest, stem density was greater but did not increase over time.
Tree community composition was significantly different between unlogged and naturally regenerating logged forest, with unlogged forest exhibiting more variation among plots and having more indicator spe- cies than other treatments. In logged forest, there was no effect of active restoration (conducted 12–24 years pre-census) or time since logging on the overall community composition, however several individual species were indicators of the active restoration treatment. Together, our results suggest that the effects of selective logging on tree communities can still be observed 23–35 years after harvesting regardless of active restoration efforts.
Table 1
Results of PERMANOVA tests (10000 permutations) showing the effect of logging (unlogged vs naturally regenerating logged), restoration treatment (naturally regenerating vs actively restored), and time since logging (logged forest only) on tree community composition within sapling (2–5 cm DBH), pole (5–10 cm DBH), and established tree (≥10 cm DBH) size classes across the full community and repeated to consider only the dipterocarp community.
Full Community Dipterocarpaceae
R2 F df P R2 F df P
Saplings
Logging 0.055 1.343 1 0.045* 0.040 0.881 1 0.546
Restoration Type 0.033 1.090 1 0.287 0.052 1.620 1 0.091
Time since logging 0.028 0.929 1 0.633 0.023 0.734 1 0.723
Poles
Logging 0.059 1.434 1 0.029* 0.048 0.900 1 0.584
Restoration Type 0.036 1.198 1 0.143 0.047 1.338 1 0.167
Time since logging 0.026 0.865 1 0.769 0.037 1.051 1 0.399
Established Trees
Logging 0.056 1.534 1 0.009* 0.031 0.773 1 0.655
Restoration Type 0.030 0.996 1 0.480 0.034 1.047 1 0.399
Time since logging 0.027 0.893 1 0.699 0.311 0.965 1 0.481
Fig. 4.Boxplots of pairwise Bray-Curtis dissimilarity between plots for tree communities within and between logging treatments at the established tree (≥10 cm DBH) size class.
4.1. Forest structure
Logged forest had lower stem basal area per plot and fewer pole stems per unit area than adjacent unlogged forest. However, stem den- sity in actively restored plots was shown to increase with time since logging (27–35 years) in saplings and poles. In these size classes, stem density in actively restored forest approached or exceeded values for naturally regenerating forest by 35 years after logging. This adds nuance to findings from a meta-analysis of previous studies, which concluded natural regeneration results in greater stem density than active resto- ration, as well as in greater structural heterogeneity of vegetation (Crouzeilles et al., 2017), showing that, despite time lags, the structure of actively restored forests is able to recover to the same extent as forests left to regenerate naturally. Our results also complement findings from the neotropics which suggest that, despite successful regrowth, actively restored forests do not have sufficiently increased productivity to justify the costs of treatment at current harvesting intervals (Gr¨afe & K¨ohl, 2020).
Although we find that established tree stem density remains distinct in logged forest and has not recovered over time, other Bornean forests, allowed to regenerate naturally, report similar stem density of trees >10 cm DBH in logged and unlogged forest by 5–15 years (Slik et al., 2002) and 22 years (Hector et al., 2011) after logging. This may be a result of varying logging intensities or remnant forest structure between studies.
We show that total basal area does not vary between naturally regenerating and actively restored forests, nor with time since logging, when considered across all size classes (Table S3). However, greater light availability, weeding, and climber cutting treatments at 10 m in- tervals may have allowed trees in the smaller size classes to grow more rapidly in actively restored sites, resulting in greater mean DBH and basal area per stem (Table S3). This suggests that restoration practices in Sabah are likely to be successful at increasing overall above ground biomass, relative to natural regeneration, given that trees with larger diameters are likely to have greater volumes due to taller stems. This supports previous findings of accelerated carbon recovery from active restoration in this landscape (Philipson et al., 2020), as well as else- where in Borneo (Ruslandi et al., 2017), in Uganda (Wheeler et al., 2016) and Costa Rica (Holl and Zahawi, 2014).
The overall lower plot-level stem density we found in the selectively logged forest plots in USFR than in adjacent unlogged forest may reflect inhibition of tree seed production and seedling recruitment and survival by localised intense disturbances, such as log landings and skid trails (Nussbaum et al., 1995, Guariguata and Dupuy, 1997), and liana colo- nisation of logged forests (Nabe-Nielsen et al., 2009). Lianas limit light availability in the understory, compete with trees for below-ground soil resources, including nutrients and water, and mechanically restrict tree growth (Schnitzer and Bongers, 2002), as found previously in this landscape (Magrach et al., 2016) and elsewhere (Schnitzer et al., 2000, Hall et al., 2003, van der Heijden and Phillips, 2009). Competition for soil resources may be amplified by export of nutrients in the harvested timber as well as soil compaction, leading to pervasive nutrient limita- tion in logged forests that may be further exacerbated through time as forests recover (Swinfield et al., 2020).
Recruitment may also be limited by the low fecundity of adult trees arising from pollination limitation or low genetic diversity among progeny, especially in late successional stems (Kettle, 2010, Nutt et al., 2016). Dipterocarp seedlings with lower genetic diversity (heterozy- gosity) have a reduced survival probability under field conditions, exacerbating recruitment limitation to larger size classes (Nutt et al., 2016, Tito de Morais et al., 2020). This might explain our finding that established tree dipterocarp density increases over time in actively restored forest, where additional genetic diversity has been added to the community through planting, while they decrease over time in forests allowed to regenerate naturally after logging (Fig. 3, Panel F). These differences in recruitment through size classes may affect trajectories of change in tree community composition and represent an important
component of future monitoring.
4.2. Effects of selective logging on tree community composition
Taxonomic diversity of tree communities differed solely amongst saplings, between unlogged and naturally regenerating logged forest, and at no size class for species richness, 23–35 years after logging.
However, species composition did differ in response to logging. Results from multiple studies, including several from Sabah (Berry et al., 2008, Hector et al., 2011, Lussetti et al., 2016), provide strong evidence of high retention of tree species richness and rapid recovery of species diversity in the first two decades following selective logging of tropical forests (Slik et al., 2002, Laing et al., 2019). In French Guiana, richness and diversity of tree communities was actually higher ten years after logging than unlogged reference sites (Molino and Sabatier, 2001), reflecting initially greater recruitment of disturbance-dependent species at the landscape scale. This supports the view that selectively logged forest habitats are likely to be of reasonably high ecosystem service value (Gibson et al., 2011, Putz et al., 2012).
Although we find no difference in pole and established tree species richness and diversity of unlogged and logged forests sampled in 500 m2 plots, there may be differences in these metrics at larger spatial scales (Berry et al., 2008, Imai et al., 2012). For example, negative effects of selective logging on richness and diversity may occur at landscape scales, where logging creates a heterogeneous disturbance mosaic (Marsh and Greer, 1992, Imai et al., 2019). Fully capturing these pat- terns of localised community variation therefore requires sampling across a wide range of spatial scales (Imai et al., 2012). This may also help to explain why we see lower Shannon diversity amongst saplings in logged forest, which vary more locally than larger, more dispersed, stems within the landscape. However, we found that mean community dissimilarity was greater in unlogged plots, despite the much greater number and spatial dispersion of plots in logged forest (Fig. 1). This suggests our sampling effort was sufficient to avoid bias from highly localised, high diversity patches embedded within more degraded log- ged forest, even within the larger size classes.
The species composition of tree communities varied between selec- tively logged and unlogged forest plots for all size classes in this study, although there was no difference in the dipterocarp community composition when this family was analysed in isolation. Similar shifts in taxonomic community composition have been seen in tropical forests in Borneo (Verburg and van Eijk-Bos, 2003, Hector et al., 2011, Both et al., 2019), elsewhere in Southeast Asia (Okuda et al., 2003), and in other tropical forest regions (Baraloto et al., 2012, de Avila et al., 2015, Osazuwa-Peters et al., 2015). Furthermore, unlogged forest commu- nities had high inter-plot dissimilarity by comparison with logged forest (Fig. 4), indicating greater spatial variation in species composition. This reflects a previous finding from Sabah, that beta diversity was higher in unlogged than selectively logged forest plots (Imai et al., 2013). Indi- cator species analysis shows that this difference was manifest through the presence of 23 species that were relatively common in unlogged forest but either rare or absent from logged forest, rather than addition of new species to logged areas (Table 2).
Although several indicator species of unlogged forest were capable of reaching the canopy once established (e.g. Shorea symingtonii), they generally comprised shade-tolerant seedlings that require understorey conditions for successful establishment and survival. This matches findings from elsewhere in Southeast Asia (Okuda et al., 2003) and the wider tropics (Baraloto et al., 2012), suggesting that changes in com- munity composition may be attributed to decreased relative abundance of mid to late successional species and an inability of some shade tolerant species to propagate and recruit into selectively logged forest.
This may be due to altered canopy structure and light availability that persist for several decades after logging. While more indicator species were identified in the sapling size class than the pole or established tree size classes (14, 10, and 4, respectively; Table 2), this does not
ForestEcologyandManagement488(2021)119036
8
Table 2
Significant indicator species of tree communities with distinct logging histories at each size class. No significant indicator species were found for logged forest when compared with unlogged forest. Unique unidentified morphospecies are labelled as ‘sp.’ Species planted during restoration efforts are marked ‘*’. Species or genera which can grow as shrubs are marked ‘‡’ (Slik, 2009, Kew Science, 2021, Encyclopedia of Life, n.d., Flora Malaysiana, n.d.).
Family Indicator Species Indicator P-Value at Size Class
Sapling Pole Established Tree
Unlogged (vs Logged)
Achariaceae Ryparosa acuminata 0.002 <0.001 –
Annonaceae Polyalthia zanthopetala ‡ 0.033 – –
Cardiopteridaceae Gonocaryum calleryanum ‡ 0.032 – –
Dilleniaceae Dillenia excelsa – 0.025 0.040
Dipterocarpaceae Shorea symingtonii * – 0.032 –
Euphorbiaceae Mallotus lackeyi ‡ 0.039 – –
Mallotus wrayi ‡ – 0.007 –
Fabaceae Fordia splendidissima ‡ 0.042 – –
Lauraceae Litsea castanea 0.033 0.032 –
Nothaphoebe umbelliflora – 0.033 –
Malvaceae Pentace laxiflora – – 0.005
Melastomataceae Memecylon laevigatum 0.032 – –
Memecylon sp. ‡ 0.031 – –
Meliaceae Chisocheton sp. – 0.018 –
Reinwardtiodendron humile ‡ – – 0.009
Myrtaceae Syzygium kunstleri ‡ 0.034 – –
Phyllanthaceae Aporosa elmeri 0.002 0.028 –
Aporosa grandistipulata 0.002 – –
Aporosa sp. ‡ – 0.012 –
Baccaurea tetrandra ‡ 0.041 – –
Cleistanthus hirsutulus – 0.005 –
Rubiaceae Urophyllum sp. ‡ 0.027 – –
Rutaceae Melicope sp. ‡ 0.033 – 0.002
Logged (vs Unlogged)
No significant indicator species identified – – –
Natural Regeneration (vs Active Restoration)
Dipterocarpaceae Shorea faguetiana * 0.040 – –
Ebenaceae Diospyros sp. ‡ – 0.044 –
Active Restoration (vs Natural Regeneration)
Dipterocarpaceae Dryobalanops lanceolata* 0.018 0.008 0.034
Euphorbiaceae Mallotus penangensis ‡ 0.048 – –
Rubiaceae Neolamarckia cadamba* – – 0.045
Hayward et al.
necessarily suggest that understory species were disproportionately affected, because the same trend could be seen in the overall number of species recorded for each size class across all plots (409, 312, and 280;
Table S2). Shifts in community composition may also be due to differing species-specific abilities to cope with increased prevalence of lianas post-logging (Schnitzer and Bongers, 2002, Magrach et al., 2016). Slow- growing species, like dipterocarps, have been shown to be affected less than fast-growing species by liana infestation, possibly explaining why we see no significant difference in dipterocarp community composition between regeneration treatments (Visser et al., 2018).
4.3. Effects of time since logging and restoration on tree community composition
Species richness, diversity, and community composition were unaf- fected by time since logging or restoration treatment, for any tree size class. This supports findings from previous studies in Borneo (Verburg and van Eijk-Bos, 2003) and Hainan Island, China (Xu et al., 2015), which found established tree communities in logged forest remained distinct from unlogged forest 20 and 50 years post-logging, respectively.
By contrast, a Brazilian study finds that the community composition of stems >10 cm DBH was significantly different between naturally regenerating and actively restored forest 30 years after intervention, despite unaffected diversity across treatments (de Avila et al., 2015).
Community composition in the initial 20 years post-logging tends to be dictated by variation in pre-logging conditions such as elevation, water availability, and soil type, as well as widespread recruitment of early successional stems which are able to take advantage of the open and disturbed habitats created by logging (Verburg and van Eijk-Bos, 2003, Xu et al., 2015). We investigated a chronosequence covering 23–35 years post-logging, which is insufficient to capture complete conver- gence of community composition with that of an unlogged reference forest.
Frequently the aim of active restoration in logged forest is to improve regeneration of valuable timber species but at the potential cost of reduced biodiversity (Face the Future, 2011). This has led to increasing concerns surrounding the negative effects of active restoration on tree community composition and particularly the recruitment of native tree species (Hector et al., 2011, Holl and Brancalion, 2020). We found no difference in tree community composition between naturally regener- ating and restored forests, which suggests there was no negative effect due to restoration. However, we found several significant indicator species for restoration treatment. Naturally regenerating forest had two indicator species (Shorea faguetiana and an unidentified Diospyros spe- cies) but neither of these were significant indicators within the estab- lished tree size class, suggesting that recruitment through to stem sizes
≥10 cm DBH is not, at this time, common for either species under either restoration treatment. By contrast, both Dryobalanops lanceolata and Neolamarckia cadamba were indicator species in actively restored forests at the established tree size class. These native species were planted as part of the active restoration process (Face the Future, 2011; Table S1).
Although these are only two of 76 planted species to be reported as indicators, their presence in the established community suggests there have been some ecological benefits of active restoration at USFR. It is therefore important to select carefully, and subsequently monitor, the species planted as part of active restoration projects.
Overall, we found little evidence that the restoration techniques employed (liana cutting and enrichment planting) had substantially altered the recovery trajectory of tree community composition in these forests. This indicates that their positive impacts on carbon recovery in this landscape (Philipson et al., 2020) were not to the detriment of ecological conditions, as has been proposed elsewhere (Hector et al., 2011, Holl and Brancalion, 2020). Although we found no change in community composition over time, this was limited by the relatively short interval since restoration began (12–24 years prior to the census) compared to time-scales of successional change, and it remains possible
that restoration would have an impact over longer timescales. It is therefore important to maintain ongoing long-term monitoring to reveal any emerging trajectories of community recovery. Our results contribute to the emerging consensus that the extent to which active restoration techniques promote recovery of tree communities in logged forest is determined by site-specific factors, such as logging intensity, soil disturbance, and connectivity to old growth forest. While the effect of active restoration on community composition is currently somewhat unpredictable as a generalised trend across tropical forests (Curran et al., 2014, Meli et al., 2017), pooling evidence will hopefully help to identify predictive relationships.
While there is currently limited evidence that active restoration of selectively logged forest in Sabah accelerates the recovery of tree com- munity composition, there is increasing evidence for a positive impact on other taxonomic groups. Insectivorous bird (Edwards et al., 2009) and invertebrate communities (Edwards et al., 2012), for example, have been shown to recover rapidly after disturbance in actively restored Bornean forests. Active restoration may therefore have an important role to play in targeting the conservation of threatened functional groups, providing that the costs and benefits of utilised techniques are thor- oughly considered and interventions are tailored to each site and species assemblage (Aerts and Honnay, 2011). A range of silvicultural tech- niques aimed at regeneration can be selected and combined to maximise ecological co-benefits to restoration at a landscape scale. For example, active restoration could be targeted towards threatened species or particularly degraded locations that are less likely to recover unassisted, while other areas are left to regenerate naturally (Holl and Aide, 2011, Cerullo and Edwards, 2019).
5. Conclusions
Our results indicate a clear difference in community composition and forest structure between unlogged and naturally regenerating logged forest across tree size classes ≥2 cm DBH. While richness and diversity are shown to be approximately equivalent to pre-logging values within 35 years post-logging, community composition remains distinct from nearby unlogged forest with no detectable directional shifts at the decadal time-scale. As a result, it is unlikely that selective logging cycles of 40–60 years (as intended for the region; Sist et al., 2003) will be successful in balancing economic management of Sabah’s forests with long-term tree species conservation. Furthermore, we find that, although active restoration efforts in Danum Valley may have had positive impacts on mean stem size and therefore aboveground biomass, they did not have a negative effect on tree community composition, richness, or diversity by comparison with naturally regenerating plots for plots censused 12–24 years after the start of the intervention. We recommend that future active restoration strategies for climate change mitigation should be designed and implemented with biodiversity co- benefits specifically in mind, targeting the barriers to recruitment which are most likely to be faced by vulnerable shade-tolerant species if left to regenerate naturally.
Declaration of Competing Interest
The authors declare that they have no known competing financial interests or personal relationships that could have appeared to influence the work reported in this paper.
Acknowledgements
We are grateful to the Sabah Biodiversity Centre for granting us permission to undertake this research and to our research assistants, who provided vital help in the field and identifying specimens. This research was supported by a UKRI Natural Environment Research Council PhD studentship (R.M.H.) and an Ashton Award from the Arnold Arboretum (R.M.H.). Collection of field data was funded by the Carnegie