Plug-in hybrid electric cars:
Market development, technical analysis and CO₂ emission scenarios for Germany
Study on behalf of the German Federal Ministry for the Environment, Nature Conservation and Nuclear Safety
Julius Jöhrens, Dominik Räder, Jan Kräck | ifeu – Institute for Energy and Environmental Research Heidelberg Lucien Mathieu | Transport & Environment
Ruth Blanck, Peter Kasten | Öko-Institut e.V.
Heidelberg / Brussels / Berlin, September 2020
ifeu Wilckensstr. 3 D - 69120 Heidelberg Telefon +49 (0)6 221. 47 67 - 0 Telefax +49 (0)6 221. 47 67 - 19 E-Mail ifeu@ifeu.de www.ifeu.de
Executive Summary 4
Executive Summary (German) 8
Figures 12
Abbreviations 15
1 Introduction, Goal & Scope 16
2 Overview of PHEV technology 17
2.1 Vehicle Configurations 17
2.2 Operating Modes 19
3 Regulatory Situation 20
3.1 Test cycle emissions (WLTP) 20
3.2 European CO₂ fleet emission targets 21
3.3 German National Regulation affecting PHEV 22
4 Market Situation 24
4.1 Number of registrations and vehicle stock 24
4.2 Availability of vehicle models 27
4.3 Vehicle mass and power 30
4.4 Range, energy consumption and CO₂ emissions 36
4.5 Vehicle list prices 40
5 Real-world Energy Consumption of PHEV 41
5.1 Real-world specific energy consumption 41
5.2 Real-world utility factors 47
5.3 Sensitivities of Energy Consumption 51
5.4 Average energy consumption estimates per vehicle segment 57 6 Evolution of PHEV technology, market and utilization until 2030 61
6.1 Model availability and production forecast 61
6.2 Evolution of technical vehicle parameters 63
6.3 Vehicle Utilization and specific energy consumption 65
7 Scenario analysis of PHEV CO₂ emissions until 2030 69
7.1 Overview over scenario assumptions 69
7.2 New registrations 70
7.3 Vehicle stock and mileage 71
7.4 CO₂ emissions 72
8 Alternative scenarios without PHEVs 75
8.1 Scenario assumptions 75
8.1.1 CO₂ emissions of equivalent ICE cars 75
8.1.2 Share of petrol and diesel cars of total ICE registrations 78 8.1.3 Yearly mileage of petrol, diesel, and BEV cars 78
8.2 New registrations 79
8.3 CO₂ emissions 80
8.4 Discussion 82
9 Approaches for Regulatory Measures 83
9.1 Reduce gap between real world and WLTP 84
9.2 Restrict incentives and subsidies to low-emission PHEVs 86
9.3 Incentivize reasonable charging behaviour 87
9.4 Set requirements for Operation modes 90
9.5 Increase transparency 91
References 92
Executive Summary
This study examines the deviation of real-world CO₂ emissions of plug-in hybrid vehicles (PHEVs) from type-approval values, the driving factors of these deviations, and implications for achieving the German climate protection targets for transport by 2030. Following a com- prehensive market analysis, the energy consumption for typical vehicle configurations un- der various conditions is calculated using a vehicle simulation model. Using the model re- sults, the expected real-world tailpipe emissions for the PHEV fleet up to the year 2030 are determined. The main findings of the study are presented below.
The market share of plug-in hybrids has been increasing significantly since the beginning of 2020. Motorization and weight of PHEVs are above average for new passenger vehicles.
The number of new PHEV registrations in Germany is currently growing at a fast pace.
The market share was on average 4.1 % in the first half of 2020, and increased substan- tially with 10.5 % of new registrations until November 2020. At around 80 %, the share of commercial vehicles among new registrations (many of them company cars) is signifi- cantly higher than the average for the new car fleet (65%).
Newly registered PHEVs increasingly belong to the upper vehicle segments and are heav- ier than average (+ 37% average vehicle mass for PHEVs compared to the weighted aver- age of gasoline and diesel vehicles). The combined power output (system power) is even higher (+ 83 % for PHEVs compared to combustion vehicles).
High real-world consumption of plug-in hybrids is both due to the design of the vehicles and to the charging and driving behavior of their users.
A recent study by Fraunhofer ISI and ICCT that has been conducted parallel to this project discovered a gap between specific fuel consumption determined in real-world operation and NEDC type-approval values in the range of 100 % to 600 %1. Hence, real-world CO2
emissions from the German PHEV fleet are severely underestimated at present. The switch to the WLTP method will only marginally reduce this discrepancy. The main reason for the discrepancy is that in real life, vehicles are driven much more frequently using their combustion engine and much less in electric mode than assumed in the type ap- proval. For PHEV company cars with an electric range of 50 km according to WLTP, an electric driving share of only about 15% on average was observed. For private vehicles, the electric driving shares are higher (about 50 % in the example), but still well below the value of about 75 % assumed in WLTP. These results were considered in the scenario calculation described later on.
Low electric driving shares in real-world operation are induced by lack of charging infra- structure at the vehicles’ parking locations and a lack of economic incentives for users to charge them. However, especially in the case of company cars, high mileage and trip ––––––––––––––––
1 Plötz, P.; Moll, C.; Mock, P.; Bieker, G.; Li, Y.; Gasmi, J.; El-Deeb, A. (2020): Real-world usage of plug-in hybrid electric vehicles - Fuel consumption, electric driving, and CO2 emissions. Karlsruhe, Berlin, Washing- ton: Fraunhofer Institute for System and Innovation research ISI, International Council of Clean Transpor- tation ICCT
The real-world electric range is on average around 30 % below the WLTP values. Real- world specific consumption in electric mode and in internal combustion engine mode is often significantly higher than according to the WLTP method.
The potential power output of the electric motor in today's PHEVs is significantly lower than that of the combustion engine. On average, only around 30% of the maximum sys- tem output is attributable to the electric motor. As a result, PHEVs often activate the combustion engine in dynamic driving situations, although the charge level of the battery would not require it. Additionally, a comparatively weak electric motor may recuperate less energy when braking, which can increase overall energy consumption compared to systems with more powerful electric motors.
The user's choice of PHEV operating mode can have a significant impact on fuel consump- tion, especially in very demanding driving patterns. The combustion engine kicks in fre- quently when the user chooses operating modes optimized for performance in order to achieve higher accelerations or speeds. Additionally, in some driving modes the batteries are charged by the internal combustion engine, which can lead to high real-world con- sumption. However, based on the available data, it is not possible to quantify the addi- tional consumption from an unfavourable choice of operating mode.
If the framework conditions remain unchanged, additional annual tailpipe emissions (TtW) from PHEVs of up to 4.3 million metric tons of CO₂ in 2030 are possible compared with the scenarios of the German climate protection program for the year 2030.
Until 2030, the system power of PHEVs is expected to further increase by an average of 10%. The internal combustion engine's share of system power is expected to decline by a few percentages, but will remain to be the dominant component of system power. Bat- tery size is expected to increase by 20% by 2030, but due to the increase in vehicle mass the all-electric range is expected to increase less than the battery capacity.
Based on market data of planned production capacities and the requirements of the CO₂ fleet target values, the scenario analysis carried out in this study assumes 2.6 million PHEVs registered in Germany in 2030. Since many company cars are sold to private own- ers after some years, around one in four vehicles of the 2030 PHEV fleet will be a company car.
If private owners will charge their PHEVs every day by then, real-world CO2 emissions would only slightly exceed WLTP values for this vehicle group. For company cars, real- world emissions would still be twice as high compared to the WLTP values even with daily charging due to the high mileage and average trip length of those vehicles. In contrast, if the current charging behaviour continues, the average tailpipe emissions for the PHEV fleet in 2030 will be 130 g/km (factor of 2.8 compared to WLTP), and 172 g/km for com- pany cars (factor 3.7 compared to WLTP).
Annual tailpipe CO₂ emissions from PHEV in Germany in the timeframe 2020-2030 based on WLTP assumptions (yellow) and different real- world charging assumptions (blue).
Assuming the WLTP values, the German PHEV passenger car fleet will emit 2.4 million metric tons of CO2 in 2030. On the other hand, if electric driving shares remain as low as with today's PHEVs, this is expected to result in additional emissions of 4.3 million tons (6.7 Mt in total). If daily charging gradually becomes standard practice by 2030, the addi- tional emissions compared with WLTP will be around 0.8 Mt (3.2 Mt in total).
Under given EU CO2 standards, national subsidy instruments for plug-in hybrids can lead to additional CO2 emissions.
Passenger cars with a large gap between the test cycle (WLTP) and real-world CO2 emissions reduce the impact of EU passenger car CO2 standards, as those only regulate test cycle emis- sions, not real-world emissions. Currently, this gap is particularly high for plug-in hybrids.
Indeed, this is the reason why additional promotion of such vehicles through national poli- cies – under given CO2 standards - ultimately leads to an increase in passenger car fleet CO2
emissions (if not at the national level, then at least at the EU level). This is especially accurate for the use of PHEVs as company cars, as they currently account for the lowest electric driv- ing shares, whilst being most privileged.
In order to ensure a contribution of plug-in hybrids to CO2 mitigation in the transport sec- tor, the policy framework in Germany has to be adjusted.
The results of this study pose a considerable threat to compliance with German climate pro- tection targets in the transport sector if the number of PHEVs continues to grow rapidly without a significant increase in the real-world share of electric driving. Hence, the following starting points for regulatory adjustments should be considered:
soon as possible.
Restrict government subsidies for PHEVs to situations with demonstrably low real-world CO2 emissions.
Ensure economic and practical incentives for PHEV users to charge frequently.
Set requirements for the design of PHEVs and their operating modes, e.g. require a min- imum all-electric range significantly above the current average.
Implement measures to increase transparency on real-world consumption for users, ac- ademia, and policymakers.
In view of the grave doubts about the environmental benefits of currently approved PHEVs, the first step should be to suspend or fundamentally revise the current subsidies (in partic- ular the purchase premium and the tax benefits for company car users) and to conduct in- depth scientific studies on the real-world emissions of PHEVs, e.g. using OBFCM data.
Executive Summary (German)
Im Zentrum der vorliegenden Untersuchung stand die Frage, in welchem Maße die realen CO₂-Emissionen von Plug-in-Hybridfahrzeugen (PHEV) im Betrieb von den Normwerten ab- weichen, von welchen Faktoren diese Abweichungen abhängen und welche Relevanz dies für die Erreichung der Klimaschutzziele im Verkehr bis 2030 hat. Neben einer umfangreichen Marktanalyse wurde der Energieverbrauch für typische Fahrzeugauslegungen unter ver- schiedenen Bedingungen modelliert. Mithilfe der ermittelten Verbrauchswerte wurden die zu erwartenden Realemissionen (tailpipe) für die PHEV-Flotte bis zum Jahr 2030 bestimmt.
Nachfolgend sind die wesentlichen Erkenntnisse der Untersuchung dargestellt.
Der Marktanteil von Plug-In-Hybriden nimmt seit Anfang 2020 deutlich zu. Motorisierung und Gewicht von PHEVs sind überdurchschnittlich.
Die Anzahl der PHEV-Neuzulassungen in Deutschland wächst gegenwärtig in hohem Tempo. Der Marktanteil lag in der ersten Hälfte des Jahres 2020 im Mittel bei 4,1%, im November hatten PHEV bereits einen Anteil von 10,5 % an den Neuzulassungen. Der An- teil gewerblicher Neuzulassungen (viele davon Dienstwagen) liegt mit rund 80% deutlich höher als im Durchschnitt der Neuwagenflotte (65%).
Neu zugelassene PHEV gehören dabei zunehmend den oberen Fahrzeugsegmenten an und sind überdurchschnittlich schwer (+ 37 % mittlere Fahrzeugmasse bei PHEV gegen- über dem gewichteten Mittel aus Benzinern und Dieseln). Die Motorisierung (Systemleis- tung) ist auch im Vergleich zum Gewicht überdurchschnittlich (+ 83 % bei PHEV gegen- über Verbrennungsfahrzeugen).
Hohe Realverbräuche von Plug-In-Hybriden sind sowohl auf die Auslegung der Fahrzeuge als auch auf das Lade- und Fahrverhalten der Nutzer zurückzuführen.
Die in realitätsnahen Testverfahren (z.B. ADAC EcoTest) sowie im Realbetrieb ermittelten spezifischen Kraftstoffverbräuche liegen nach Ergebnissen einer parallel zu diesem Vor- haben durchgeführten Untersuchung des Fraunhofer ISI und des ICCT1 derzeit typischer- weise um ein Mehrfaches (um 100 % bis hin zu 600 %) über den Werten nach Typgeneh- migung (NEFZ), die für die in 2020/2021 zu erreichenden CO₂-Flottenzielwerte maßgeb- lich sind. Die Umstellung auf das WLTP-Verfahren wird diese Diskrepanz nur geringfügig reduzieren.
Hauptgrund für die genannte Abweichung ist, dass die Fahrzeuge real viel häufiger mit Verbrennungsmotor und viel weniger elektrisch fahren als bei der Typgenehmigung an- genommen. Insbesondere bei Dienstwagen wurden beispielsweise für PHEV mit einer elektrischen Reichweite von 50 km nach WLTP im Mittel nur ein elektrischer Fahranteil von etwa 15 % beobachtet. Bei Privatfahrzeugen sind die elektrischen Fahranteile zwar ––––––––––––––––
1 Plötz, P.; Moll, C.; Mock, P.; Bieker, G.; Li, Y.; Gasmi, J.; El-Deeb, A. (2020): Real-world usage of plug-in hybrid electric vehicles - Fuel consumption, electric driving, and CO2 emissions. Karlsruhe, Berlin, Washing- ton: Fraunhofer Institute for System and Innovation research ISI, International Council of Clean Transpor- tation ICCT
Ursachen für niedrige elektrische Fahranteile in der Praxis können fehlende Ladeinfra- struktur an den Standorten der Fahrzeuge sowie fehlende wirtschaftliche Anreize für die Nutzer zum Laden sein. Vor allem bei Dienstwagen spielt allerdings auch die oftmals hohe Fahrleistung und Fahrtlänge eine wichtige Rolle, die auch bei großer Ladedisziplin den erzielbaren elektrischen Fahranteil begrenzt.
Die im rein elektrischen Modus erzielte Reichweite liegt in der Realität um durchschnitt- lich etwa 30 % unterhalb der WLTP-Werte. Die spezifischen Verbräuche im elektrischen Betrieb sowie auch im verbrennungsmotorischen Betrieb liegen real oftmals signifikant höher als nach WLTP-Verfahren.
Die mögliche Leistungsabgabe des E-Motors ist bei heutigen PHEV deutlich geringer als die des Verbrenners. Nur etwa 30% der maximalen Systemleistung gehen im Mittel auf den E-Motor zurück. Infolgedessen wird der Verbrennungsmotor oftmals in dynamischen Fahrsituationen zusätzlich aktiviert, auch wenn dies aufgrund des Ladestands der Batterie nicht notwendig wäre. Auch kann ein vergleichsweise schwacher E-Motor beim Bremsen weniger Energie rekuperieren, wodurch sich der gesamte Energieverbrauch gegenüber Systemen mit stärkeren E-Motoren erhöhen kann.
Vor allem bei sehr dynamischen Fahrmustern kann die Wahl des PHEV-Betriebsmodus‘
durch den Nutzer einen erheblichen Einfluss auf den Kraftstoffverbrauch haben. Hier wird der Verbrenner in auf Leistung optimierten Betriebsmodi oftmals hinzugezogen, um hö- here Beschleunigungen oder Geschwindigkeiten zu erreichen. Zudem können Fahrmodi gewählt werden, bei denen die Batterien verbrennungsmotorisch geladen werden, was zu sehr hohem Realverbrauch führen kann. Welche Zusatzverbräuche sich in der Praxis durch verbrauchstechnisch ungünstige Wahl des Betriebsmodus ergeben, kann auf Grundlage der verfügbaren Daten allerdings nicht beantwortet werden.
Bei gleichbleibenden Rahmenbedingungen sind durch PHEV gegenüber den Szenarien des Klimaschutzprogramms im Jahr 2030 jährliche Mehremissionen (TtW) von bis zu 4,3 Mio.
Tonnen CO₂ möglich.
Für die kommenden Jahre bis 2030 wird eine weitere Erhöhung der Systemleistung von PHEV um durchschnittlich 10 % erwartet. Der Anteil des Verbrenners an der Systemleis- tung dürfte dabei um einige Prozentpunkte zurückgehen, aber immer noch dominieren.
Für die Batteriegröße wird ein Plus von 20 % bis 2030 erwartet, was aufgrund der eben- falls zu erwartenden Gewichtszunahme jedoch nicht in gleichem Maße die elektrische Reichweite erhöhen dürfte.
Die in dieser Studie durchgeführte Szenariobetrachtung geht basierend auf Marktdaten zu geplanten Produktionskapazitäten und den Erfordernissen der CO₂-Flottenzielwerte von 2,6 Mio. in Deutschland zugelassenen PHEV im Jahr 2030 aus. Da PHEV typischer- weise als Dienstwagen zugelassen werden und später in den Privatmarkt übergehen, wird dann nur noch etwa jedes vierte Fahrzeug ein Dienstwagen sein.
Gelingt es, bei privaten PHEV bis dahin in der Regel eine tägliche Vollladung zu realisieren, so werden bei dieser Fahrzeuggruppe die nach WLTP zu erwartenden Auspuffemissionen nur geringfügig überschritten. Bei Dienstwagen sind hingegen auch unter dieser optimis- tischen Annahme in 2030 gegenüber WLTP noch etwa doppelt so hohe CO₂-Emissionen zu erwarten. Besteht das heutige Ladeverhalten hingegen fort, so ergeben sich im PHEV- Flottenmittel Auspuffemissionen von 130 g/km, für Dienstwagen sogar 172 g/km.
Jährliche CO2-Auspuffemissionen der deutschen PHEV-Flotte im Zeitraum 2020-2030 auf Basis der WLTP-Annahmen (gelb) sowie unter Annahme realer Nutzungsprofile mit unterschiedlichem Ladeverhalten.
Unter Annahme der WLTP-Werte ergeben sich für die deutsche PHEV-Pkw-Flotte im Jahr 2030 CO₂-Emissionen von 2,4 Mio. Tonnen. Bleiben die elektrischen Fahranteile hingegen so gering wie bei heutigen PHEV, so ergeben sich Mehremissionen von 4,3 Mio. Tonnen (insgesamt 6,7 Mt). Gelingt es, das tägliche Laden bis 2030 sukzessive zum Standardfall zu machen, so liegen die Mehremissionen ggü. WLTP bei etwa 0,8 Mt (insgesamt 3,2 Mt).
Unter gegebenen CO2-Standards können nationale Förderinstrumente für Plug-In-Hybride real zu Mehremissionen führen.
Pkw mit einer großen Lücke zwischen dem Testzyklus (WLTP) und den realen CO2-Emissio- nen mindern die Wirkung der Pkw-CO2-Standards, da die EU-CO2-Standards nur den Test- zyklus, nicht aber die realen Emissionen regulieren. Bei Plug-In-Hybriden ist diese Lücke der- zeit besonders hoch. Die zusätzliche Förderung solcher Fahrzeuge durch nationale Politiken führt daher – bei gegebenen CO2-Standards – letztendlich zu einem Anstieg der Pkw-Flotte- nemissionen (wenn nicht auf nationaler Ebene, so doch zumindest auf EU-Ebene). Dies gilt insbesondere für PHEV als Firmenwagen, da diese derzeit die geringsten elektrischen Fahr- anteile aufweisen, gleichzeitig aber am stärksten subventioniert werden.
Die Sicherstellung des Klimaschutzbeitrags von Plug-In-Hybriden erfordert veränderte po- litische Rahmenbedingungen.
Aus diesen Ergebnissen ergibt sich eine erhebliche Gefahr für die Einhaltung der deutschen Klimaschutzziele im Verkehrsbereich, sollte der Bestand an PHEV weiterhin schnell anwach- sen, ohne dass der reale elektrische Fahranteil schnell und deutlich gesteigert werden kann.
Folgende regulatorische Ansatzpunkte kommen dafür in Frage:
Weiterentwicklung des Typgenehmigungsverfahren, um die Lücke zu den realen Emissi- onen signifikant zu reduzieren. Hierzu sollten zum frühestmöglichen Zeitpunkt Daten der europaweiten Realverbrauchserfassung (On-board fuel consumption metering, OBFCM) zum Einsatz kommen.
Sicherstellung wirtschaftlicher und praktischer Anreize für PHEV-Nutzer zu häufigem La- den
Anforderungen an die Auslegung von PHEV und ihrer Betriebsmodi, insbesondere Fest- setzung einer elektrischen Mindestreichweite, die deutlich über dem derzeitigen Durch- schnitt liegt.
Maßnahmen zur Erhöhung der Transparenz über den Realverbrauch für Nutzer, Wissen- schaft und Politik
Angesichts der gravierenden Zweifel an der umweltpolitischen Sinnhaftigkeit derzeit zuge- lassener PHEV sollten in einem ersten Schritt die derzeitigen Fördermaßnahmen (insbeson- dere die Kaufprämie sowie der Steuervorteil für Dienstwagennutzer) auf den Prüfstand ge- stellt werden und vertiefte wissenschaftliche Untersuchungen zu den Realemissionen von PHEV durchgeführt werden, beispielsweise auf Basis der ab Anfang 2021 erhobenen OBFCM-Daten.
Figures
Figure 2.1: Exemplary topology of a parallel hybrid powertrain 17 Figure 2.2: Exemplary topology of a serial hybrid powertrain 18 Figure 4.1: Vehicle stock in Germany by fuel type in January 2020. Source:
(Kraftfahrtbundesamt 2020a) 24
Figure 4.2: Monthly and cumulative BEV and PHEV new registrations from 01/2014 to 03/2020. Source: (GoingElectric 2020). 25 Figure 4.3: Shares by owners for the total stock and only for PHEV´s in January
2020. Sources: (Kraftfahrtbundesamt 2020b). 25 Figure 4.4: Number of models available by fuel type 27 Figure 4.5: Number of PHEV new registrations by car manufacturer and model
from 01/2015 to 03/2020 28
Figure 4.6: Number and shares of PHEV new registrations by segment from
01/2015 to 03/2020 29
Figure 4.7: Average total power by fuel type (new registrations weighted average
2019) 30
Figure 4.8: Average total power by segment (new registrations weighted average
2019) 31
Figure 4.9: Shares and number of PHEV new registrations by total power from 01/2015 to 03/2020. The dashed red line shows the sales-
weighted total power average. 32
Figure 4.10: Average empty weight by engine type (new registrations weighted
average 2019) 33
Figure 4.11: Average empty weight by segment (new registrations weighted
average 2019) 33
Figure 4.12: Average empty weight and average total power of PHEV new registrations from 01/2015 to 03/2020 by segment (sales-
weighted) 34
Figure 4.13: Shares and number of PHEV new registrations by empty weight from 01/2015 to 03/2020. The dashed red line shows the sales-
weighted mass average. 35
Figure 4.14: Number of PHEV new registrations by battery capacity from 01/2015 to 03/2020. The dashed red line shows the sales-
weighted capacity average. 36
Figure 4.15: Share of PHEV models and new registrations by battery capacity, electric range and type-approval CO₂ emissions. Timeframe:
01/2015 to 03/2020. Sources: (EFahrer.com 2020; GoingElectric
2020) 37
Figure 4.16: Average WLTP electric energy and fuel consumption by segment 38
weighted average values. 39 Figure 4.18: Shares and number of PHEV new registrations by list price from
01/2015 to 03/2020 40
Figure 5.1: Average fuel consumption of different models derived from
spritmonitor.de 44
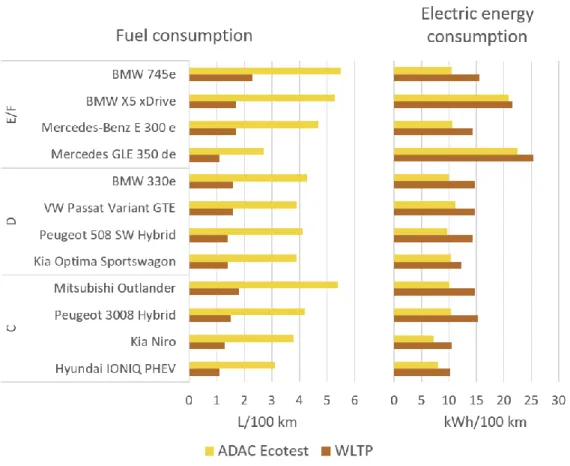
Figure 5.2: Comparison between WLTP and ADAC Ecotest fuel and electric
energy consumption (combined values) 46
Figure 5.3: Utility factor according to type-approval as well as based on mobility
surveys 48
Figure 5.4: Relation to NEDC test-cycle fuel consumption by user group. Source Fraunhofer ISI based on (Plötz et al. 2020) 49 Figure 5.5: UF vs. NEDC range by model variant. Source Fraunhofer ISI based on
(Plötz et al. 2020) 50
Figure 5.6: Resulting utility factors according to type-approval (NEDC and WLTP), based on the mobility panel as well as based on empirical data
from Fraunhofer ISI (see Figure 5.5). 51
Figure 5.7: WLTC-Simulation in CD mode (left) and CS mode (right) with
VEHMOD (own calculations) 53
Figure 5.8: Discrepancy of electric consumption, fuel consumption and all- electric range for the example vehicle in HBEFA cycle simulation as compared to WLTP (own calculations) 55 Figure 5.9: Progression of actual speed and state of charge for the example
vehicle in different operating modes in a demanding drive cycle
with significant slopes. 56
Figure 5.10: Specific electricity and fuel consumption of example vehicle for the considered demanding driving cycle in different operating
modes (own calculations) 56
Figure 5.11: Electric and fuel consumption according to WLTP for example vehicle in different ambient temperatures (own calculations) 57 Figure 5.12: Tailpipe CO₂ emissions for defined vehicle segments, baseline 2020
(own calculations) 60
Figure 6.1: Number of available PHEV models on the EU market by
manufacturer. Source: (IHS Markit 2019) 62 Figure 6.2: PHEV share in European vehicle production per segment. Source: (IHS
Markit 2019) 62
Figure 6.3: Average battery capacity in the considered vehicle segments (IHS Markit data, calibrated to German PHEV market) 64 Figure 6.4: Average system power in the considered vehicle segments (IHS
Markit data, calibrated to German PHEV market) 64 Figure 6.5: Average vehicle mass in the considered vehicle segments (IHS Markit
data, calibrated to German PHEV market) 64 Figure 6.6: Annual mileage of petrol and diesel cars in Germany by user (Source:
Moibility Panel, 2016/17-2018/19) 67
Figure 6.7: Utility factors applied in the scenario calculations; based on the mobility panel (MOP) for charging every day (dotted) and every
other day (dashed) as well as based on empirical data from
(Plötz et al. 2020). 68
Figure 7.1: New registrations of PHEV in Germany by segment and user, 2020-
2030 70
Figure 7.2: PHEV vehicle stock in Germany by segment and user, 2020-2030 71 Figure 7.3: PHEV mileage in Germany by segment and user, 2020-2030 72 Figure 7.4: PHEV CO₂ tailpipe emissions per km depending on charging
behaviour, 2020 and 2030 73
Figure 7.5: Total PHEV CO₂ emissions in Germany 2030 for different charging
behaviours 73
Figure 7.6: Total PHEV CO₂ emissions in Germany in the case of increased
charging, 2020-2030 74
Figure 8.1: CO2 emissions per km for PHEV and equivalent ICEV (weighted
average) 77
Figure 8.2: Substituted PHEV registration per powertrain for PHEV scenario and alternative scenarios. Source: own calculations. 79 Figure 8.3: WLTP CO₂ emissions per km for new registrations in Germany.
Source: own calculations. 80
Figure 8.4: CO₂ tailpipe emissions per km for PHEV and ICE, 2020 and 2030.
Source: own calculations. 81
Figure 8.5: CO₂ tailpipe emissions for PHEV scenarios and alternative scenarios
(2030) 81
Figure 9.1: Overview of possible regulatory approaches 83
Abbreviations
AER All-electric range BEV Battery-electric vehicle CD mode Charge-depleting mode CS mode Charge-sustaining mode EAER Equivalent all-electric range ICE Internal combustion engine NEDC New European drive cycle
OBFCM On-board fuel consumption meter PHEV Plug-in hybrid electric vehicle
UF utility factor (= proportion of electric drive in overall mileage of PHEV) WLTC Worldwide harmonized Light Duty Test Cycle
WLTP Worldwide harmonized Light vehicles Test Procedure ZLEV zero and low emission vehicles
1 Introduction, Goal & Scope
In order to facilitate the expected transition towards electric drive systems in passenger cars, plug-in hybrid vehicles (PHEVs) are seen as an important bridge-technology by most car manufacturers and some politicians in Germany. Since the beginning of 2020, new reg- istrations of PHEV have been surging in Germany. The main drivers are likely to be the stricter EU CO₂ emission standards for vehicle manufacturers since the beginning of the year as well as the increased purchase premium for battery and plug-in hybrid vehicles.
For some time now, there have been indications that exhaust emissions of PHEVs in real operation considerably exceed the emissions according to type approval. This raises ques- tions to which extent PHEVs can actually contribute to achieving the agreed climate protec- tion targets in the transport sector. The present study addresses this question by analyzing the technical characteristics of the current fleet of new PHEVs and usage patterns.
First, the current state of PHEV technology development is summarized (chapter 2) as well as the regulatory situation at national and European level (chapter 3). Thereafter, key pa- rameters of the PHEV market are analysed (chapter 4). Subsequently, the energy consump- tion of PHEVs is examined under different conditions and compared to the official values according to type approval (chapter 5). With the help of market analyses, a scenario for the technical development of PHEVs up to the year 2030 is then derived and estimates are made of expected changes in vehicle use during this period (chapter 6). On this basis, a scenario for the development of the PHEV fleet in Germany is then drawn up and its expected real- world CO₂ emissions are calculated and compared with the German government's targets (chapter 7). Additionally, two hypothetical scenarios without PHEV are investigated in order to draw specific conclusions (chapter 8). Finally, the results are used to derive approaches for policy measures to ensure the climate policy benefits of PHEVs (chapter 9).
2 Overview of PHEV technology
2.1 Vehicle Configurations
The possible topologies of the drive trains of plug-in hybrid vehicles are manifold. They are fundamentally differentiated according to two factors: the degree of hybridization and the structure or arrangement of the drive components. The present study is limited to plug-in hybrids. Similar to non-externally chargeable hybrids, they can be further divided into three main groups according to the energy flows in the drive trains: Parallel hybrids, serial hybrids, and mixed topologies.
Parallel hybrids
Parallel hybrid powertrains are characterized by the fact that both the combustion engine and the electric motor can act mechanically on the drive axle(s). It is possible to drive with one drive system each or to couple both in order to add the mechanical drive power (Reif 2016). Figure 2.1 illustrates this structure for the case where both systems act on the rear axle. They can be coupled with each other or with the drive axle via a clutch, a summation gear or a freewheel.
Figure 2.1: Exemplary topology of a parallel hybrid powertrain
However, it should be noted that the drive systems are not limited in their effect on one and the same axis. It is also possible (as for example with the BWM i8) that the combustion engine transmits its drive power to one axis while the electric drive system drives the other.
This special form is known as an axlesplit hybrid or, in some cases, hybrid-through-the-road (Keilhof 2015).
The possibility of adding the drive torques can increase the dynamics of the vehicle. This is one of the reasons why this type of drive topology is currently being used by manufacturers
to appeal to customers in market segments with a sporting focus. Typical representatives are the rear-wheel drive plug-in hybrids from Mercedes (C350e, S500e) and BMW (330e, 530e) as well as the front-wheel drive GTE family from Volkswagen (Golf GTE, Passat GTE).
Serial hybrids
In serial hybrid powertrains (Figure 2.2), the combustion engine drives a generator that feeds the traction battery, while the actual vehicle propulsion is provided by one or more electric motors. The front axle can also be driven instead of the rear axle.
Figure 2.2: Exemplary topology of a serial hybrid powertrain
While parallel hybrids are also frequently found in conventional hybrids, serial connection of the drive systems is particularly suitable for equipping battery electric vehicles with range extenders. Since the speed and torque of the combustion engine are not linked to the vehi- cle speed, the combustion engine can operate at a comparatively efficient operating point at any time. A typical example is the BMW i3 with range extender.
Mixed Topologies
The combination of several electric motors with an internal combustion engine by means of a planetary gearbox offers the possibility, depending on the design of the system and the motors, to add up torques and transfer load ranges between the drives. Such combinations can act like a continuously variable transmission (CVT) and generate both serial and parallel hybrid operating modes in one system. For example, the Opel Ampera and the identical Chevrolet Volt have both two purely electric-motor-driven operating modes as well as a se- rial and a parallel hybrid mode.
Mixed topologies are also used by the Toyota group, e.g. some Lexus models (GS450h, LS600h, RX450h) and the Toyota Prius. The latter is available as a conventional full hybrid and as a plug-in hybrid version. Furthermore, there are conversion solutions that extend an existing hybrid vehicle (Toyota Prius) to a PHEV.
PHEVs typically offer different operating modes which can be selected by the driver. De- pending on the selected mode, the operation strategy of the powertrain is adjusted. As a result, the interaction between the electric motor and the combustion engine are adjusted differently. In practice, this leads to different utility factors as well as electric energy and fuel consumption. The most commonly used operating modes of recent car models are sum- marized in the following table.
Operating
mode Hybrid mode E-save mode E-drive mode Sport-mode E-charge mode
Description
Standard start mode: Hybrid op- eration with auto- matic selection of the most efficient energy source.
Electrical energy save mode: The E- save mode helps to
save battery power, for exam-
ple for later city centre driving.
Pure electric mode: The vehicle
operates purely electrically as long
as possible, the maximum speed is
reduced
Sport mode: Maxi- mum total perfor- mance can be achieved by com- bining the electric
motor and com- bustion engine.
Battery charging mode – serial PHEV´s only: Con- tinuously charges the battery while standing, driving and during brak-
ing.
Electric en-
gine on off on on off
Combustion
engine on on off on on
Examples
Mitsubishi Out- lander:
“D”
BMW 225xe Active Tourer iPerfor- mance: “COM-
FORT”
Audi A3 e-tron:
“Hybrid Auto”
Mercedes E300de:
“Hybrid”
VW Passat GTE:
„Hybrid“
Mitsubishi Out- lander:
“Save”
BMW 225xe Active Tourer iPerfor- mance: “SAVE
BATTERY”
Audi A3 e-tron:
“Hybrid Hold”
Mercedes E300de:
“E-Save”
VW Passat GTE:
„E-Mode“+Button
Mitsubishi Out- lander:
“EV-Priority”
BMW 225xe Active Tourer iPerfor- mance: “MAX
eDRIVE”
Audi A3 e-tron:
“EV”
Mercedes E300de:
“E-Mode“
VW Passat GTE:
„E-Mode“
Mitsubishi Out- lander:
“Sport”
BMW 225xe Active Tourer iPerfor- mance: “SPORT”
Audi A3 e-tron:
“Dynamic”
Mercedes E300de:
“Sport”
VW Passat GTE:
„GTE“
Mitsubishi Out- lander:
“Charge”
BMW 225xe Active Tourer iPerfor- mance: -
Audi A3 e-tron:
“Hybrid Charge”
Mercedes E300de:
“Charge”
VW Passat GTE:
„Battery Charge”
In addition to the different operating modes, most cars offer different levels of recuperation, which can also be individually selected by the driver. The intensity of the recuperation can therefore usually be selected between several stages. Hence, besides the operating modes, the recuperation is an additional parameter which can be adjusted by the driver and which influence energy and fuel consumption.
3 Regulatory Situation
3.1 Test cycle emissions (WLTP)
As of September 2017, the new WLTP test procedure became mandatory in the EU. It aims to be more representative of average driving behaviour than the NEDC test cycle it replaces.
A comprehensive description of the application of the WLTP procedure to PHEV can be found in (Riemersma / Mock 2017). The WLTC is subdivided into four phases: low, medium, high, and extra-high vehicle speed, which can be regarded as typical driving for an urban, rural, 100-km/h limit, and 130-km/h limit motorway, respectively. Fuel and electrical energy consumption are determined for each of these phases and aggregated according to the phase’s specific utility factor into one combined average, which forms the basis for vehicle CO₂ regulation.
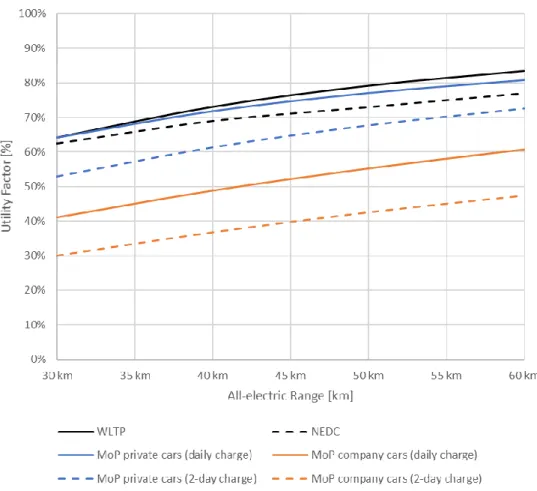
If a vehicle has a high electric range, it likely will be driven mostly in charge-depleting mode (CD mode), whereas if it has a low electric range, it likely will be driven more in charge- sustaining mode (CS mode). The WLTP introduced a novel approach for determination of the weighting factor (referred to as the utility factor) that describes the ratio of driving in CD and CS mode as a function of the electric range. It is based on historical driving patterns of a particular vehicle fleet and the assumption of a daily full-charge. Calculation of the av- erage weighted fuel consumption, C, in WLTP is done according to the following formula:
C = UF * C1 + (1 – UF) * C2 Where:
C = weighted fuel consumption in liters per 100 kilometers;
C1 = fuel consumption in liters per 100 kilometers in charge-depleting (CD) mode when the vehicle is mainly driven using the electric motor;
C2 = fuel consumption in liters per 100 kilometer in charge-sustaining (CS) mode when the battery is de- pleted and the vehicle is mainly driven using the internal combustion engine; and
UF = utility factor as a function of the electric range RCDC, defined as the distance driven up to and including the transition cycle, see (Riemersma / Mock 2017).
WLTP uses an interpolation family approach for CO₂, fuel and electric energy consumption, and electric range. Effectively this means that for every vehicle family member, depending on its actual mass, aerodynamic resistance, and rolling resistance, dedicated values for these parameters will be calculated by interpolation between the vehicles of the family that have the highest and lowest energy consumption over the test cycle.
To reduce CO₂ emissions from new cars, CO₂ fleet targets have been set1 at EU level. By 2021, the (average) emissions of all new passenger car registrations in the EU are to be re- duced to 95 g/km. While the type approval procedure transitioned to WLTP in 2017 as de- scribed above, the fleet emission target for 2020 is still defined based on the NEDC proce- dure. In 2020, carmakers have to reach the 95g/km target over 95% of their fleet of new sales, effectively eliminating the 5% most polluting vehicles from the calculation. Depending on the composition of the product portfolio, a specific target value is calculated for each manufacturer based on the mass of vehicles offered. Failure to meet this target results in penalties of 95 €/g excess CO₂ emissions per vehicle.
The EUCO₂ fleet targets regulates tailpipe emissions, hence battery electric vehicles (BEVs) are counted as 0 gCO₂/km. The emissions from PHEV are calculated as a result of the test cycle procedure described above. The increased vehicle weight as a result of the traction battery leads to higher permittedCO₂ emissions for the entire fleet within the regulations on fleet target values.
PHEVs, like BEVs, also play a separate role in this context, as vehicles that emit less than 50 gCO₂ per km in the test cycle (which largely includes PHEVs) benefit from so-called super- credits towards reaching the 95 gCO₂/km target from 2020. Zero and low emission vehicles (ZLEVs) below 50g CO₂/km may be considered with a multiplication factor of 2 in 2020, 1.67 in 2021 and 1.33 in 2022 onto the calculation of a manufacturer’s fleet average.
In 2019 the post-2020 EU car CO₂ emission reduction targets were approved which set the objective of a 15 % CO₂ emission reduction target in 2025 and 37.5 % in 2030 (compared to a 2021 baseline). For the 2025 and 2030 targets, a new calculation method comes into force with the Zero and Low Emission Vehicle (ZLEV) benchmark (starts in 2025): when over- achieving the ZLEV benchmark, carmakers are allowed to relax their overall CO₂ targets. Un- der this new formula, PHEVs benefit from a multiplier of 0.7 in the formula (see T&E’s 2019 analysis (Transport & Environment 2019) of the post-2020 car CO₂ standards). In December 2019, the European Green Deal communication has announced the plan to revise this post- 2020 car CO₂ targets with a proposal in June 2021.
––––––––––––––––
1 EU Directive 333/2014
3.3 German National Regulation affecting PHEV
PHEVs combine the drive of conventional combustion engine and pure electric drive. How- ever, in many areas they are legally treated in a similar way to pure battery electric vehicles if they fulfil certain requirements.
Electric Mobility Act
The German Electromobility Act1 regulates support measures for vehicles withCO₂ emis- sions below 50 g/km or 40 km purely electric range in the NEDC (transitional regulation: 30 km) and thus largely includes PHEVs. The regulations include the possibility of reserving parking spaces or making them free of charge for these vehicles. Furthermore, advantages can be granted for entry or passage into certain areas. The prerequisite for granting and checking such privileges is the clear recognition of the vehicles entitled to them. For this purpose, the possibility of adding an "E" to vehicle registration plates was introduced. In addition to BEV and fuel cell vehicles, plug-in hybrids can also be marked in this way. In addition to the granting of privileges, this makes it clearer for rescue services, for example, in the event of an accident whether high-voltage components are installed in the vehicle and whether appropriate precautions must be taken.
Purchase premium for electric vehicles
Since May 2016 there has also been direct financial support for the purchase of new vehi- cles. BEVs, PHEVs or fuel cell vehicles that are newly purchased, registered and owned for at least six months are eligible for funding. Part of the subsidy is paid for by the manufacturer in the form of a corresponding discount, while another part is subsequently reimbursed to the buyer from the federal budget. Starting with a government subsidy of 2.000 Euro for BEV and 1.500 Euro for BEV, the government decided to increase the subsidy in the course of the climate action package (2019) and the stimulus package (June 2020), differentiated according to the net list price of the vehicle. The following table shows the current incen- tives paid for BEV and PHEVs.
Table 1: Subsidies for plug-in vehicles in Germany
Discount by manufacturer Government incentive (June 2020- Dec 2021)
Government incentive (2022 onwards)2
BEV < 40.000 3.000 6.000 3.000
BEV 40 – 65.000 2.500 5.000 2.500
PHEV < 40.000 2.250 4.500 2.250
PHEV 40 – 65.000
1.875 3.750 1.875
––––––––––––––––
1 Act on the Preferential Use of Electrically Operated Vehicles (Electromobility Act - EmoG)
2 On November 17, 2020 the Government announced that the current amount of the purchase subsidy will be maintained until 2025.
Eligible for application are private individuals as well as companies and institutions such as foundations, corporations and associations. In order to secure the automotive industry's own contribution, the federal share is only paid if the net purchase price is lower than the BAFA list price by the corresponding amount of support; the invoice must be presented when the premium is applied for. So far (as of 1.7.2020), 214,269 applications for funding have been submitted, including 76,625 plug-in hybrids.
Energy consumption labelling
The 1Passenger Car Energy Consumption Labelling Ordinance transposes a European di- rective into German law and regulates a label that is intended to inform consumers about the CO₂ efficiency of a vehicle when buying or leasing it. Similar to the efficiency classes for household appliances, passenger cars are also classified intoCO₂ efficiency classes A+ to G, shown as coloured arrows from green to red. The official CO₂ emissions are set in relation to the vehicle weight, which favours heavier vehicles with the same fuel consumption.
PHEVs benefit in two ways: First, the battery capacity of PHEVs is advantageously taken into account when determining the CO₂ emissions. On the other hand, the additional weight due to the more complex drive system increases theCO₂ limit to be observed for a certain efficiency class.
Motor vehicle tax
According to Kraftfahrzeugsteuergesetz (KraftStG) §3d, all BEVs that were or will be regis- tered for the first time in the period from 18 May 2011 to 31 December 2025 are tax-exempt from the motor vehicle tax for 10 years from their date of first registration. The exemption will be granted until 31 December 2030 at the latest. Vehicles with CO₂ emissions below 95 g (i.e. especially plug-in hybrids), which are registered for the first time by 31.12.2024, will receive a tax reduction of 30 euros per year, limited until the end of 2025. The tax exemption for PHEVs will thus be granted for a maximum of 5 years and will amount to up to 150 euros for passenger cars registered at the beginning of 2021.
After 2025, PHEV will be taxed according to the regulations for conventionally powered ve- hicles. The motor vehicle tax is based on the engine capacity and onCO₂ emissions. How- ever, the CO₂ component only applies to vehicles emitting more than 95 g CO₂/km (WLTP).
This means that PHEVs are favoured by the rules for calculating and reportingCO₂ emissions.
In the case of plug-in hybrid vehicles with petrol engines, the engine capacity component amounts to 2 euros per 100 cc, i.e. depending on the engine capacity of the PHEV, the motor vehicle tax is as low as 32-54 euros per year (for an engine capacity of 1,600-2,700 cc).
Company car taxation
If company cars are used for private purposes, their users have to pay taxes. The benefits in kind are calculated using the so-called "1% method", which adds 1% of the car’s list price (not the actual price paid) to an employee's taxable income each month. Since January 2019, only half as much tax has to be paid for plug-in hybrids and only a quarter for e-cars with a list price of less than 60,000 euros.
––––––––––––––––
1 Ordinance on consumer information on fuel consumption, CO2 emissions and electricity consumption of new passenger cars (Passenger Car Energy Consumption Labelling Ordinance - Pkw-EnVKV)
4 Market Situation
For the development of political recommendations regarding PHEVs, it is important to un- derstand the current market situation for passenger cars in general and especially the situ- ation of PHEVs. To this end, data about vehicle stock, technical parameters and prices of current PHEVs in Germany are analysed in this section.
4.1 Number of registrations and vehicle stock
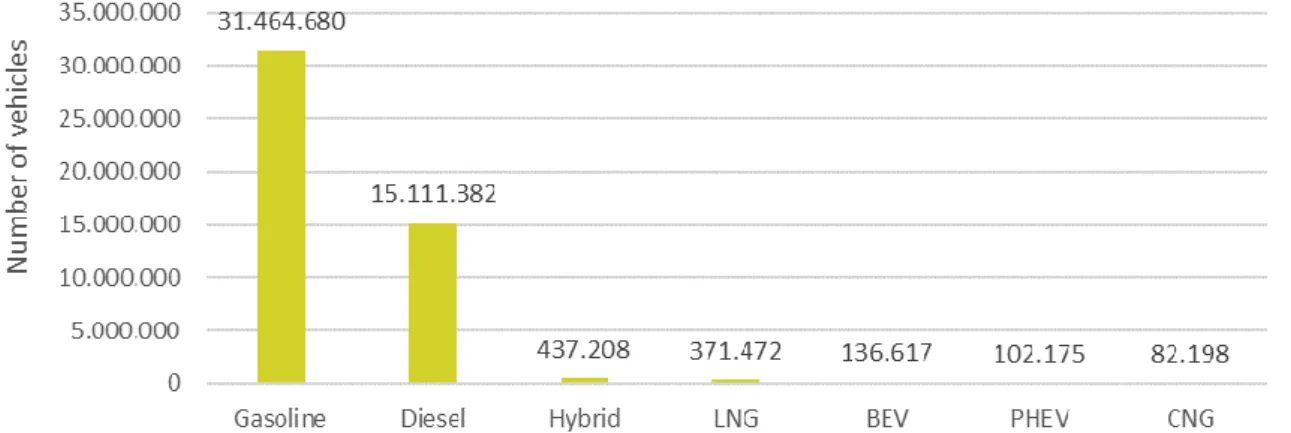
As of January 2020, a total of 47.7 million passenger cars were registered in Germany. Most of them are powered by gasoline (65.9 %) and diesel (31.7 %). The total market share of electric vehicles is about 0.5%. Within these vehicles, battery-electric vehicles (BEVs) ac- count for 57 % (about 135,000 vehicles) and PHEVs for 43 % (about 100,000 vehicles). From January to August 2020 alone, another 85,000 new PHEV were registered in Germany, which demonstrates the rising demand.
Figure 4.1: Vehicle stock in Germany by fuel type in January 2020. Source: (Kraftfahrtbundesamt 2020a)
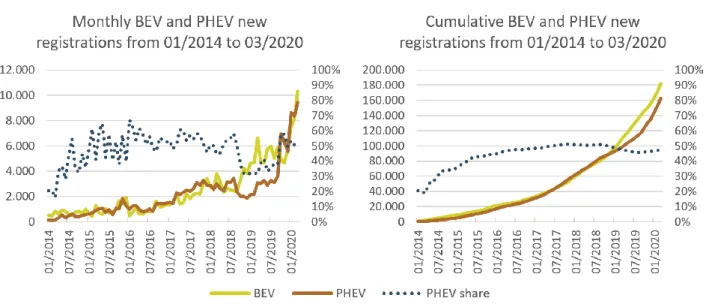
Figure 4.2: Monthly and cumulative BEV and PHEV new registrations from 01/2014 to 03/2020. Source: (GoingElectric 2020).
Even if the total number of electric cars has just a small share in the car fleet yet, in recent years the new registrations of BEV and PHEV increased (Figure 4.2), particularly gaining mo- mentum in mid-2019. While for 2019 the average market share of PHEV new registrations was just 1.3 %., the share increased to 4.4% in March 2020.
When comparing BEVs and PHEVs from 01/2014 to 09/2018, the monthly numbers of BEV and PHEV new registrations were relatively similar. In 2019, BEV new registrations were slightly higher than PHEV new registrations. Since 10/2019 PHEVs caught up and since April 2020, there have been more PHEV new registrations than those for BEV. .
Figure 4.3: Shares by owners for the total stock and only for PHEV´s in January 2020. Sources: (Kraftfahrtbundesamt 2020b).
Figure 4.3 shows the division of PHEV stock between private and commercial owners as of January 2020. Most cars in Germany were owned by private owners (89 %) and just 11 % were owned by commercial owners. When looking at this distribution just for PHEVs the share of commercial owners within the PHEV stock was significantly higher with about 53 % in January 2020. This number is currently also growing over time: While commercially owned PHEV amounted to only 50 % in January 2019, it was 58% as of Apr 1st 2020. This is due to an exceptionally high commercial share of around 80 % for PHEV new registrations (April 2020). Generally, the overall share of commercial vehicles in new registrations in Ger- many is between 60% and 66% (2011-2019).
Possible reasons for the disproportionately high importance of commercial PHEV new reg- istrations are tax privileges for these vehicles (see section 3.3) as well as the fact that PHEV are mostly offered in the upper vehicle segments which are also over-represented in the German commercial vehicle fleet. Over time, it can be expected that PHEVs enter the 2nd hand market, which will increase the share of private ownership. This is also considered in the scenario calculations (chapter 7).
When comparing the number of car models available by fuel type (Figure 4.4), it can be seen that the number of PHEV models1 available on the German market is still quite limited (about 3 % of the available gasoline vehicle models). However, this number is expected to surge in the following years (cf. Figure 6.1). Most of the PHEV models today are equipped with a gasoline engine (92 %).
Source: (DAT 2019)
Figure 4.4: Number of models available by fuel type
––––––––––––––––
1 These PHEV numbers contain different fuel types per model. The Mercedes E-Class for example is available in both a Diesel-PHEV and Gasoline-PHEV version.
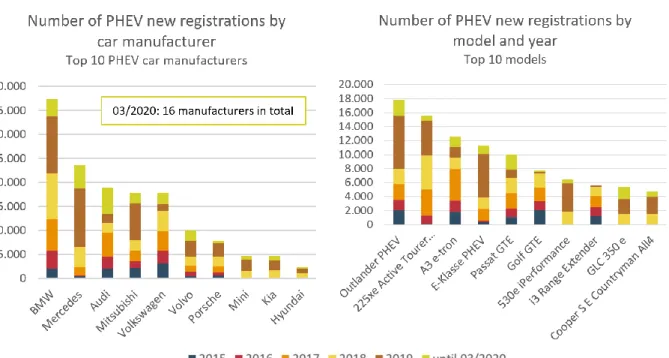
Source: (GoingElectric 2020)
Figure 4.5: Number of PHEV new registrations by car manufacturer and model from 01/2015 to 03/2020
Seven of the top 10 car manufacturers have been offering PHEV car models since 2015 and three manufacturers introduced their first PHEV models a few years later (Figure 4.5). The most popular models over the last years are the Mitsubishi Outlander, BMW Active Tourer and A3 e-tron. Since 2015, all models available on the market can still be purchased, with the exception of the BMW i3 Range Extender, which is currently only available as BEV.
When looking at the development of the PHEV registrations by car segments as defined by the German Kraftfahrtbundesamt KBA (Figure 4.6), since 2017 a trend towards larger vehi- cles can be observed. In particular the shares of SUVs and Executive cars increased over the last years, while the share of medium cars decreased. While the increase for the SUVs is about in line with the development of the total market, the increase for the Executive cars is characteristic of the PHEV market. This could be at least partly due to the high importance of PHEV in the commercial car business.
Source: (GoingElectric 2020) (KBA 2020a)
Figure 4.6: Number and shares of PHEV new registrations by segment from 01/2015 to 03/2020
4.3 Vehicle mass and power
When comparing the average total power of PHEVs, BEVs, FCEVs and conventional cars, Fig- ure 4.7 shows that the sales-weighted average total power of PHEVs is by far the highest, an average PHEV having about 188 % total power in comparison to a conventional gasoline combustion model.
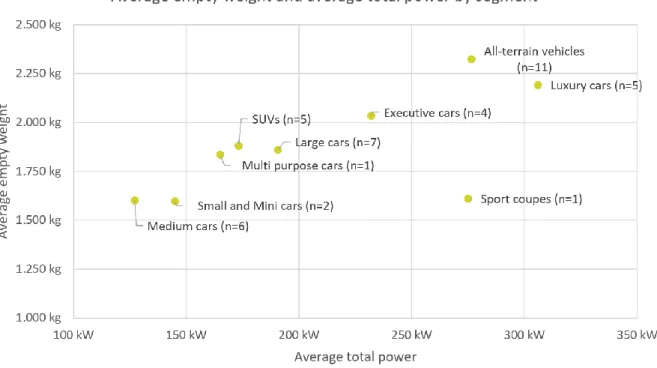
Since the distribution onto vehicle segments is different for PHEVs and ICEVs, we also did an analysis separately for the segments, also looking at the power rating of the PHEVs’ com- bustion engine separately (Figure 4.8). For the most significant PHEV segments, some nota- ble differences turn out: While for medium and executive cars the total power of the PHEV models is somewhat similar to the gasoline cars in these segments, we see considerably higher total power ratings for SUVs and all-terrain vehicles. For the latter, even the power of the combustion engine in PHEVs is higher than the average system power of the conven- tional vehicles. One possible explanation is that for these segments, the switch to PHEV is seen as an opportunity by the OEMs to offer improved driving performance to their custom- ers.
Generally, it has to be considered that the need for sufficient driving performance in pure electric mode and the presence of an additional combustion engine may imply a combined power rating that is greater than the power of an equivalent vehicle with only one drivetrain.
On the other hand, since in hybrid mode, the electric motor can assist in case of spontane- ous power demand for acceleration, it is reasonable to assume that the combustion engine could be configured with considerably lower power compared to a combustion-only vehicle.
Source: (EFahrer.com 2020; GoingElectric 2020; KBA 2020a)
Figure 4.7: Average total power by fuel type (new registrations weighted average 2019)
Source: (EFahrer.com 2020; GoingElectric 2020; KBA 2020a)
Figure 4.8: Average total power by segment (new registrations weighted average 2019)
Sources: (EFahrer.com 2020; GoingElectric 2020)
Figure 4.9: Shares and number of PHEV new registrations by total power from 01/2015 to 03/2020. The dashed red line shows the sales- weighted total power average.
When looking at the new registered PHEV models in Germany, about half of the models exceed a system power rating of 200 kW (Figure 4.9). Most of the PHEV models with high new registrations numbers, however, offer a total power of less than 200 kW. This includes the models Mitsubishi Outlander, BMW 225xe Active Tourer and Audi A3 e-tron for exam- ple. Hence, the new registrations weighted average total power is 197 kW (see dashed red line).
Looking at the vehicle mass, PHEVs are heaviest on average compared to other fuel types.
An average PHEV has an official vehicle mass of almost 2,000 kg and is about 43 % heavier than an average gasoline car and 21 % heavier than an average diesel car. This can partly be explained by PHEVs carrying two drivetrains instead of one. In addition to that, PHEVs are over-represented in the large segments, as discussed above. Therefore, once more we look at the breakdown to vehicle segments (Figure 4.11). In the most important PHEV segments, the results correspond to the findings for the vehicle power: For executive and medium cars, we see an additional vehicle mass of 200-300 kg, which can be attributed to the additional drivetrain. For SUVs and all-terrain vehicles, however, the additional mass amounts to about 500-600 kg compared to the gasoline vehicles. This may partly be due to the higher power
vehicles. Figure 4.12 additionally gives a graphical overview of the relation between vehicle mass and power separately for the vehicle segments.
Source: (EFahrer.com 2020; GoingElectric 2020; KBA 2020a)
Figure 4.10: Average empty weight by engine type (new registrations weighted average 2019)
Source: (EFahrer.com 2020; GoingElectric 2020; KBA 2020a)
Figure 4.11: Average empty weight by segment (new registrations weighted average 2019)
Source: (EFahrer.com 2020)
Figure 4.12: Average empty weight and average total power of PHEV new registrations from 01/2015 to 03/2020 by segment (sales- weighted)
Sources: (EFahrer.com 2020; GoingElectric 2020)
Figure 4.13: Shares and number of PHEV new registrations by empty weight from 01/2015 to 03/2020. The dashed red line shows the sales-weighted mass average.
Figure 4.13 provides some further insights on the distribution of vehicle mass within the PHEV market. The empty weight of about half of all PHEV models on the market exceeds 2.000 kg. Many of the newly registered cars, however, weight less than 2.000 kg. This in- cludes many top selling models (e.g. BMW 225xe Active Tourer, Audi A3 e-tron, Passat GTE).
Hence, the new registrations weighted average empty weight is about 1.900 kg (see dashed red line).
4.4 Range, energy consumption and CO₂ emissions
Figure 4.15 gives an overview of the distribution of battery capacity, electric power and CO₂ emissions according to type approval for all PHEV models present on the German market since 2015, as well as weighted by the number of registrations to date. Regarding the official range, about half of all models are below 50 km according to WLTP. When looking at the registration-weighted figures, the picture shifts somewhat: about two thirds of all registered PHEVs have an electric range of less than 50 km according to WLTP, about a quarter are below 40 km and thus below the relevant limit of the German Electric Mobility Act.
Since the electric range is decisive for the CO₂ emissions according to type approval, a similar picture emerges here: About two thirds of the vehicle models and about 80 % of the ap- proved PHEVs have standard emissions of less than 50 g/km and thus fall particularly below the relevant limit of the German Electric Mobility Act.
The battery capacities per vehicle are mostly in the range between 7.5 kWh and 15 kWh (on average about 12 kWh) and are shown in Figure 4.14Figure for the individual vehicle mod- els. It can be seen that there are only a few outliers in terms of battery capacity. Production of the i3 Range Extender has been discontinued in the meantime.
Figure 4.14: Number of PHEV new registrations by battery capacity from 01/2015 to 03/2020. The dashed red line shows the sales-weighted capacity average.
Figure 4.15: Share of PHEV models and new registrations by battery capacity, electric range and type-approval CO₂ emissions. Timeframe:
01/2015 to 03/2020. Sources: (EFahrer.com 2020; GoingElectric 2020)
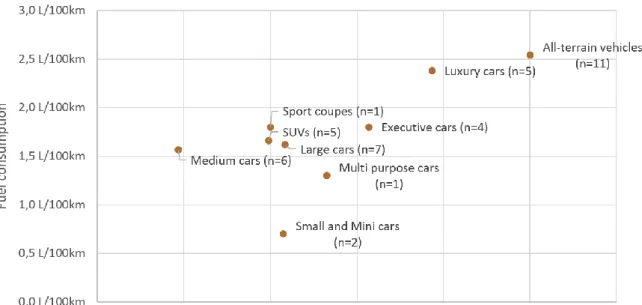
Looking at the energy consumption differentiated for different vehicle segments reveals cer- tain characteristics (Figure 4.16Figure ). Unsurprisingly, smaller segments have a lower over- all energy consumption and thus tend to be located in the lower left-hand area. All-terrain vehicles have the highest driving resistances of all classes and are therefore to be found in the upper right area with WLTP CO2 emissions well above 50 g/km, meaning that most of those vehicles will not be eligible for super-credits when calculating the CO2 fleet average.
It is remarkable the most important PHEV vehicle segments (medium cars, SUVs, large cars and executive cars) perform rather similar in terms of fuel consumption and mainly differ in power consumption. The higher the energy requirement, the larger the battery is obviously designed to stay below the limit of 50 g CO2/km and thus to benefit from super-credits in the CO2 fleet limits.
Source: (EFahrer.com 2020)
Figure 4.16: Average WLTP electric energy and fuel consumption by segment
Finally, Figure 4.17 contains a similar representation for individual vehicle models. Addition- ally the sales-weighted average values for fuel and electricity consumption are indicated, which are 1.8 litres/100 km and 14.4 kWh/100 km, respectively. Please note that most val- ues are given in WLTP, but some are given in NEFZ if there was no WLTP test available for the respective vehicle.
Sources: (EFahrer.com 2020; GoingElectric 2020)
Figure 4.17: WLTP and NEFZ fuel and electrical energy consumption for individual car models. The red dashed lines indicate the sales- weighted average values.
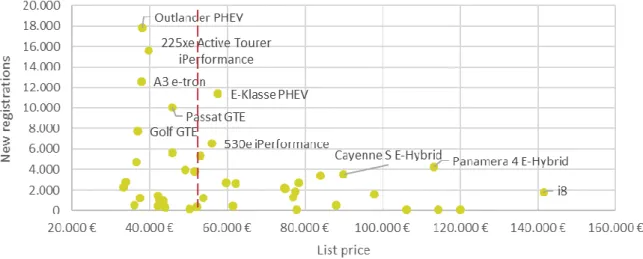
4.5 Vehicle list prices
Figure 4.18 gives an overview of the list prices (contains the value added tax) of the PHEVs available on the market. Between different models the variation of the list prices can be very high. The cheapest models start from around 35.000 € while the most expensive model (BMW i8) costs more than 140.000 €.
A share of about 40 % of the models available exceed a list price of 60.000 €. Most of the top selling models, however, cost less than 50.000 €. This includes the Mitsubishi Outlander, BMW 225xe Active Tourer and Audi A3 e-tron. Hence, the new registrations weighted aver- age list price is about 53.000 € (see dashed red line).
Sources: (EFahrer.com 2020; GoingElectric 2020)
Figure 4.18: Shares and number of PHEV new registrations by list price from 01/2015 to 03/2020
5 Real-world Energy Consumption of PHEV
5.1 Real-world specific energy consumption
The real-world consumption of PHEVs depends both on the specific energy consumption in electric and hybrid operation and on the frequency of electric operation ("utility factor").
Both factors can differ significantly from the values resulting from the type approval proce- dure. Below, available real-world data on specific energy consumption is examined. These data as well as data from mobility surveys is used to establish realistic utility factors for real- world operation in the following section 5.2.
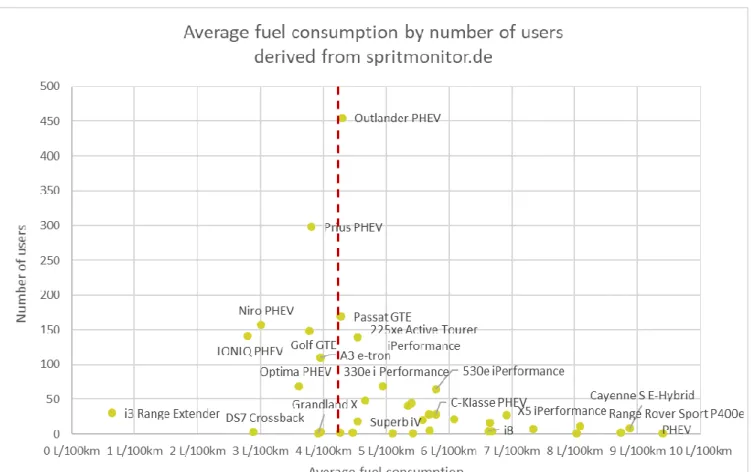
In terms of real-world specific energy consumption of PHEV, a total of five popular European portals was examined which provide fuel consumption data at least for conventional vehi- cles. The following Table 2 summarizes the characteristics of the data sources as well as their limitations. Only Spritmonitor, ADAC and EmissionsAnalytics contain data based on real driv- ing profiles or dyno tests and thus could provide “real world” electric energy and fuel con- sumption. EV-Database, HonestJohn and Fiches-Auto provide energy and fuel consumption values only from manufacturers’ data. Data from EmissionAnalytics is only available upon purchase.
For this project a short analysis of Spritmonitor and ADAC data was carried out. We analyse these two data sources for a selection of vehicles as follows: First, we give an overview of the average fuel consumption derived from the Spritmonitor data. Second, we compare the fuel and electric energy consumption separately for the CD and CS driving modes measured in ADAC Ecotest, and draw a comparison between the resulting CD ranges and the official WLTP data. Finally, the total energy and fuel consumption between the WLTP manufacturer data and data derived from the ADAC Ecotest are compared.
Description Spritmonitor is a publiclyac- cessible platform which ena- bles users to enterempiric fuel and energy consump- tion of their vehicles
Is a public platform which provides tech- nical information and dyno test data for pas- senger cars
Electric Vehicle Data- base is a public plat- form which provides technical information from BEV´s and PHEV´s
HonestJohn is a public platform which compares real-world fuel consump- tion with official manufac- turer fuel consumption
Emissions Analytics provides independent measurement data of real-world emissions and fuel efficiency
Fiches-Auto is a public plat- form which provides tech- nical data of cars
Parameters covered
Electric energy and fuel con- sumption, daily/annual Mileage, driving conditions
Technical specifica- tions, prices, energy consumption in NEDC, WLTP as well as fuel consumption from dyno tests
Technical specifica- tions, price, NEDC, WLTP and "real" en- ergy and fuel con- sumption as well as electric range
Fuel consumption Technical specifications, real driving energy and fuel con- sumption as well as electric range
Technical specifications, price, energy and fuel con- sumption as well as electric range
Data derived from
Real world driving Dyno tests (“ADAC Ecotest”)
Manufacturer data, model calculations
Manufacturer data, real- world driving
Real-world driving Manufacturer data Number of
PHEV models covered
40 Dyno tests: 10 selected
PHEVs
Technical data: covers German market
44 <10 More than 1600 passenger
cars, about 500 per year (all fuel types), number of PHEVs unknown
75 (includes different vari- ants per model)
Sample size Varies between models and users, currently about 3500 PHEV users
One dyno test proce- dure per car
No real world/dyno test data available
Unknown Unknown No real world/dyno test
data available Time
covered
Varies between models and users
Recent models Unknown Unknown Unknown Unknown
Scope Typically Germany Germany EU Typically Great Britain EU, US, Korea EU
Type of fleet Mixture of private and com- mercial cars
Test vehicles No real world/dyno test data available
Mixture of private and commercial cars
Test vehicles No real world/dyno test data available
Limitations High effort to derive reliable data - Individual analysis of each user profile necessary, Electric energy consumption is not given as an average per vehicle, it must be derived from everysingle user
Dyno test cycle is called ADAC Ecotest, No real world data
Only manufacturer data and modelled calculation data pro- vided, no real-world data available
Only fuel consumption data available, no electric energy consumption, just few PHEV´s
Data must be purchased Data does not include elec- trical energy and fuel con- sumption data