Coastal Erosion of Permafrost Soils Along the Yukon Coastal Plain and Fluxes of Organic Carbon to the Canadian
Beaufort Sea
Nicole J. Couture1,2 , Anna Irrgang3,4 , Wayne Pollard2, Hugues Lantuit3,4 , and Michael Fritz3
1Geological Survey of Canada, Natural Resources Canada, Ottawa, Ontario, Canada,2Department of Geography, McGill University, Montreal, Quebec, Canada,3Department of Periglacial Research, Alfred Wegener Institute Helmholtz Centre for Polar and Marine Research, Potsdam, Germany,4Institute of Earth and Environmental Science Potsdam, University of Potsdam, Potsdam, Germany, Canada
Abstract
Reducing uncertainties about carbon cycling is important in the Arctic where rapid environmental changes contribute to enhanced mobilization of carbon. Here we quantify soil organic carbon (SOC) contents of permafrost soils along the Yukon Coastal Plain and determine the annualfluxes from coastal erosion. Different terrain units were assessed based on surficial geology, morphology, and ground ice conditions. To account for the volume of wedge ice and massive ice in a unit, SOC contents were reduced by 19% and sediment contents by 16%. The SOC content in a 1 m2column of soil varied according to the height of the bluff, ranging from 30 to 662 kg, with a mean value of 183 kg. Forty-four per cent of the SOC was within the top 1 m of soil and values varied based on surficial materials, ranging from 30 to 53 kg C/m3, with a mean of 41 kg. Eighty per cent of the shoreline was erosive with a mean annual rate of change of0.7 m/yr. This resulted in a SOCflux per meter of shoreline of 132 kg C/m/yr, and a totalflux for the entire 282 km of the Yukon coast of 35.5 × 10⁶kg C/yr (0.036 Tg C/yr). The meanflux of sediment per meter of shoreline was 5.3 × 10³kg/m/yr, with a totalflux of 1,832 × 106kg/yr (1.832 Tg/yr). Sedimentation rates indicate that approximately 13% of the eroded carbon was sequestered in nearshore sediments, where the overwhelming majority of organic carbon was of terrestrial origin.Plain Language Summary
The oceans help slow the buildup of carbon dioxide (CO2) because they absorb much of this greenhouse gas. However, if carbon from other sources is added to the oceans, it can affect their ability to absorb atmospheric CO2. Our study examines the organic carbon added to the Canadian Beaufort Sea from eroding permafrost along the Yukon coast, a region quite vulnerable to erosion.Understanding carbon cycling in this area is important because environmental changes in the Arctic such as longer open water seasons, rising sea levels, and warmer air, water and soil temperatures are likely to increase coastal erosion and, thus, carbonfluxes to the sea. We measured the carbon in different types of permafrost soils and applied corrections to account for the volume taken up by various types of ground ice.
By determining how quickly the shoreline is eroding, we assessed how much organic carbon is being transferred to the ocean each year. Our results show that 36 × 106kg of carbon is added annually from this section of the coast. If we extrapolate these results to other coastal areas along the Canadian Beaufort Sea, theflux of organic carbon is nearly 3 times what was previously thought.
1. Introduction
It is estimated that 1,035 ± 150 Pg (1015g) of soil organic carbon (SOC) are stored in permafrost (Hugelius et al., 2014), which is approximately 20% more carbon than is currently circulating in the atmosphere (Houghton, 2007). Because permafrost is such an important global carbon sink, quantifying the carbonfluxes that result from its disturbance is crucial for understanding carbon cycling from local to global scales and for refining projections of future climatic changes (Fritz et al., 2017). Thirty four per cent of the Earth’s coasts consist of permafrost (Lantuit et al., 2012), and these coasts have a mean erosion rate of 0.5 m/yr (Lantuit et al., 2012), with local retreat rates as high as 30 m/yr (Wobus et al., 2011). Consequently, coastal erosion is an important process for mobilizing organic carbon in permafrost regions, releasing an estimated 14.0 Tg (1012g) of particulate organic carbon to the nearshore zone each year (Wegner et al., 2015). This carbonflux is comparable to that contributed annually by all Arctic rivers, or to the net methane (CH4) emissions from
Journal of Geophysical Research: Biogeosciences
RESEARCH ARTICLE
10.1002/2017JG004166
Key Points:
•Eroding permafrost along the Yukon coast contributes 0.036 Tg of soil organic carbon to the Beaufort Sea annually
•In permafrost soils, large corrections to organic carbon contents are needed to properly account for the volume of ground ice
•More than half of the soil organic carbon in coastal bluffs is found at depths greater than 1 m
Supporting Information:
•Supporting Information S1
•Table S1
Correspondence to:
N. J. Couture,
nicole.couture@canada.ca
Citation:
Couture, N. J., Irrgang, A., Pollard, W., Lantuit, H., & Fritz, M. (2018). Coastal erosion of permafrost soils along the Yukon Coastal Plain andfluxes of organic carbon to the Canadian Beaufort Sea.Journal of Geophysical Research: Biogeosciences,123, 406–422.
https://doi.org/10.1002/2017JG004166
Received 20 SEP 2017 Accepted 18 JAN 2018
Accepted article online 24 JAN 2018 Published online 17 FEB 2018
©2018. American Geophysical Union and Her Majesty the Queen in Right of Canada. Reproduced with the permis- sion of the Minister of Natural Resources Canada.
This is an open access article under the terms of the Creative Commons Attribution-NonCommercial-NoDerivs License, which permits use and distri- bution in any medium, provided the original work is properly cited, the use is non-commercial and no modifications or adaptations are made.
terrestrial permafrost (Koven et al., 2011). Terrestrially derived organic carbon plays a crucial role in Arctic bio- geochemical cycling once released into the nearshore zone, where it can either be remineralized in the water column, buried on the shelf, or transported to the deep ocean (Fritz et al., 2017). Uncertainties remain about the carbonfluxes to and from the system, however, and reducing those uncertainties is especially critical in the Arctic, where rapid environmental changes due to Arctic amplification (Serreze & Barry, 2011) are likely to increase the cycling of carbon (McGuire et al., 2009; Schuur et al., 2008).
Studies of the overall cycling of organic carbon in the Arctic Ocean have progressed toward elucidating the processes involved and highlighting the knowledge gaps (Stein & Macdonald, 2004; Vetrov & Romankevich, 2004). On a volume basis, the Arctic Ocean receives higher levels of terrestrially derived organic matter than any other ocean (Dittmar & Kattner, 2003), with inputs from both riverine and coastal sources (Rachold et al., 2000, 2004). A major goal of the Arctic Coastal Dynamics project was to develop circum-Arctic estimates of the coastal contribution of sediment and carbon (Rachold et al., 2005). The coastal inputs of organic carbon from some regions are well constrained (Jorgenson & Brown, 2005; Ping et al., 2011; Rachold et al., 2004;
Streletskaya et al., 2009), but uncertainty still exists for other areas. For the Canadian Beaufort Sea, inputs are largely dominated by discharge from the Mackenzie River (Macdonald et al., 1998). However, although several studies have provided estimates of material fluxes to the Beaufort Sea from coastal sources (Harper, 1990; Harper & Penland, 1982; Hill et al., 1991; Macdonald et al., 1998; McDonald & Lewis, 1973;
Yunker et al., 1990, 1991, 1993), organic carbon inputs for this region are still not very well defined. Here we seek to address this gap by carrying out a systematic analysis to determine the sediment and carbon con- tents of soils along the Yukon Coastal Plain andfluxes to the Beaufort Sea.
The long-term mean rate of shoreline change along the Yukon coast is0.7 m/yr, with some parts of the coast having mean retreat rates as high as 9 m/yr (Irrgang et al., 2017). Along the north coast of Alaska, long-term rates of shoreline change are1.4 m/yr (Gibbs & Richmond, 2015). This region therefore has the potential to release high amounts of organic matter. In North America, total organic carbon (TOC) contents of permafrost soils have been shown to vary considerably depending on soil type and land cover (Bockheim et al., 1999, 2004, 1998, 2003; Bockheim & Hinkel, 2007; Michaelson et al., 1996; Obu, Lantuit, Myers-Smith, et al., 2017; Ping et al., 2008; Tarnocai, 1998; Tarnocai et al., 2003, 2007, 2009), with mean values between 30 and 60 kg C/m3. Most measurements of TOC in permafrost have been confined to the top 1 m of soil, although some recent studies have examined deeper deposits (Bockheim & Hinkel, 2007; Strauss et al., 2013; Tarnocai et al., 2009; Zimov et al., 2006). In Arctic soils, in general, most soil organic matter is stored in the seasonally unfrozen active layer near the ground surface, so organic matter tends to decrease with depth. However, a considerable amount of organic matter can be transferred into the upper part of permafrost through cryoturbation (Bockheim & Tarnocai, 1998). Along the Yukon Coastal Plain, measure- ments of TOC in soils have been conducted at only a few sites (Fritz et al., 2012; Kokelj et al., 2002; Obu, Lantuit, Myers-Smith, et al., 2017; Smith et al., 1989; Tarnocai & Lacelle, 1996; Yunker et al., 1990), yielding values between 2.9 and 99.2 kg C/m3.
A preliminary estimate of theflux of organic carbon, based on earlier studies of coastal erosion, provided a value of 0.055 Tg/yr (with a maximum of 0.3 Tg/yr) for the entire Canadian Beaufort Sea coast (Macdonald et al., 1998). However, although that study implicitly accounted for pore ice through the use of soil bulk densities in its calculations, it did not account for other ground ice types, despite the fact that ground ice represents a significant portion of earth materials along the Yukon coast (Couture & Pollard, 2017).The fate of mobilized carbon is not well constrained and potential off-shelf transport is especially important along the Yukon coast because, with a width of 40 km and even 10 km in some places, it is very narrow in compar- ison to other shelves of the Arctic Ocean. Although databases exist of organic carbon in offshore sediments of the Alaska Beaufort Sea (Naidu et al., 2000) and of the Mackenzie Shelf (Macdonald et al., 2004), they include only a few samples from the Yukon coastal area.
Environmental changes in the Arctic such as longer open water seasons (Jones et al., 2009; Markus et al., 2009;
Stroeve et al., 2014), intensified storms (Manson & Solomon, 2007), warmer air, water, and soil temperatures (AMAP, 2017; Overland et al., 2015; Timmermans & Proshutinsky, 2016) and rising sea level (Manson &
Solomon, 2007) are very likely to further increase coastal erosion (Günther et al., 2015; Zhang et al., 2004) and thus carbon mobilization (McGuire et al., 2009; Schuur et al., 2008, 2015). This trend is already becoming evident, with erosion rates along many parts of the Beaufort Sea coast more than doubling in recent decades
(Irrgang et al., 2017; Jones et al., 2009, Ping et al., 2011). In order to contribute to an enhanced understanding of the implications of these changes for carbon cycling in the Arctic, our objectives are (1) to quantify the annualfluxes of sediments and organic carbon from eroding permafrost along the Yukon coast, ensuring that ground ice volumes at different depths are taken into consideration and (2) to estimate the amount of terrestrially derived organic matter being sequestered in shelf sediments in this region of the Beaufort Sea.
2. Study Area
The study area is part of the Yukon Coastal Plain, a pediment surface 282 km long and 10–30 km wide that slopes gently from a series of inland mountain ranges to the Canadian Beaufort Sea (Figure 1). It was partially glaciated during the Wisconsinan Glaciation, with the Laurentide Ice Sheet extending just to the west of Herschel Island (Fritz et al., 2012; Rampton, 1982). This formerly glaciated area is characterized by a mixture of morainic deposits and coarse-grained glaciofluvial material, but low spits andfine-grained lacustrine and fluvial sediments occur as well (Bouchard, 1974; Rampton, 1982). Cliff heights are diverse, ranging from 2–3 m on the mainland across from Herschel Island to 60 m in the eastern part of the study area. In the region to the west of Herschel Island, which remained unglaciated, sediments are of lacustrine orfluvial origin and are mostlyfine-grained (Rampton, 1982). Coastal cliff heights are more uniform in this western region, rising gently from about 3 m high near the glaciation limit to approximately 6 m near the Yukon-Alaska border (Kohnert et al., 2014; Obu, Lantuit, Fritz, Grosse, et al., 2016). An approximately 35 km long barrier spit and barrier island system comprised of sand and gravel beach deposits fronts the deltas of the Malcolm and Firth Rivers.
Permafrost is found everywhere throughout the Yukon Coastal Plain except under large lakes and rivers (Rampton, 1982). The mean annual air temperature at Komakuk Beach is11°C; July is the warmest month Figure 1.Map of the study area along the Yukon Coastal Plain, Canada. Samples of soil organic carbon (SOC) were collected at 22 onshore sites (γ) and 14 offshore (≪) sites. Bathymetry information is based on Canadian Hydrographic Survey navigational charts improved by local surveys performed in the 1980s (Thompson, 1994).
Basemap: 30 m Yukon DEM, interpolated from the digital 1:50,000 Canadian Topographic Database (Yukon Department of Environment, 2016).
with a mean temperature of 7.8°C (1971–2000) (Environment Canada, 2016). Over the last 100 years (from the period 1899–1905 to 1995–2006), mean air temperatures along the Yukon coast have increased by 2.5°C and permafrost temperatures have increased by 2.6°C (Burn & Zhang, 2009). This part of Canada is one of the most ice-rich areas of the Arctic and the permafrost contains high amounts of ground ice in the form of pore ice and thin lenses, ice wedges, and bodies of massive ice, the latter occurring primarily in the formerly glaciated area. Overall, ground ice accounts for 46% by volume of earth materials in the study area (Couture & Pollard, 2017), but it can be as high as 74% in some coastal segments. The sediments along the Yukon Coastal Plain are also rich in organic material, and peat layers from 0.5 to 3.5 m thick blanket many of the deposits (Rampton, 1982). Much of this organic matter accumulated in thermokarst basins that were formed by melting of ground ice; the accumulation is further promoted by poor drainage and the low regio- nal slope gradients, particularly in the western part of the Yukon Coastal Plain (Fritz et al., 2012; Rampton, 1982). A considerable amount of organic material along the Yukon Coastal Plain is also found at depth in preglaciatedfloodplain and deltaic sediments, and where surface organic matter appears to have been buried by glacial deformation (Rampton, 1982). Current active layers along the Yukon coast range in thick- ness from approximately 0.3 to 1.5 m (Burn, 1997; Fritz et al., 2012; Kokelj et al., 2002). However, at maximum active layer development during the early Holocene about 8,00014C years before present, active layer thick- nesses were up to 2.5 times present-day ones (Burn, 1997; Fritz et al., 2012; Kokelj et al., 2002), so organic material that originated in the paleo-active layer is found in that depth range.
Because of the high ground ice contents, thermoerosional processes play an important role in shaping the landscape along the Yukon Coastal Plain. These processes include the development of retrogressive thaw slumps (Lantuit & Pollard, 2005, 2008; Ramage et al., 2017; Wolfe et al., 2001) and cliff collapse due to wave notching (Hoque & Pollard, 2009, 2015). Sea ice in the region breaks up in late June and re-forms in early October (Galley et al., 2016), and coastal erosion and the resulting mobilization of sediment and carbon is concentrated in the 3.5 months of open water. The most common wind directions are from the southeast and the northwest, though most effective storms come from the northwest, peaking in October (Atkinson, 2005; Hill et al., 1991; Hudak & Young, 2002). Sea level rise along the Yukon coast is on average 3.5 ± 1.1 mm/yr (Manson & Solomon, 2007). Astronomical tides are semidiurnal and in the microtidal range (0.3–0.5 m) (Héquette et al., 1995).
3. Methods
The Yukon coast was segmented into 44 different terrain units based on landforms, surficial material, perma- frost conditions, and coastal processes, since each of these factors influences the amount andflux of SOC. For each of the terrain units, theflux of SOC was calculated from the measured TOC contents and the long-term rates of shoreline change for each terrain unit (Irrgang et al., 2017). Analyses of seabed sediments allowed a quantification of the terrestrially derived SOC being buried in the nearshore.
3.1. Sample Collection and Laboratory Analyses
Onshore soil sampling was carried out at 22 locations along the coast in September 2003 and August 2004, 2005, 2006, and 2009 (Figure 1). Locations were selected to represent terrain units from different parts of the coast. Sampling west of Herschel Island was restricted by ice conditions in 2005, and coarse-grained units were not well represented due to difficulties associated with coring in gravelly and pebbly material.
Samples were collected from the side of soil pits in the unfrozen active layer. After digging down to the underlying permafrost and cleaning away any thawed material, samples were obtained using a modified CRREL corer (7.5 cm inner diameter). In a limited number of cases (7% of samples), natural exposures were sampled by scraping thawed soil off the face of the exposure and using a hammer or an ax to cut out samples (approximately 1,000 cm3). During sampling, active layer thicknesses ranged from 0.25 to 0.90 m. Cores began at the base of the active layer and penetrated to a maximum of 2.04 m below the ground surface.
Natural exposures were sampled to a depth of 5.8 m from the surface. At two sites, samples were taken from the base of bluffs and were assumed to be representative of the entire lower portion of the bluff. The frozen cores were subsampled every 5 cm or where there was a distinct change in material composition. Samples were weighed in thefield, then freeze-dried and reweighed in the laboratory to determine ice content and bulk densities (based on frozen core volume or measurement of the sample block).
Offshore samples were obtained at 14 locations in July 2006 (Figure 1). A Ponar grab sampler was used to obtain samples from bottom sediments along profiles perpendicular to the shore. Sample size varied due to differences in substrate and water depths, but averaged about 1,000 cm3. Samples were taken at distances of approximately 30 m, 50 m, 100 m, 250 m, and 500 m from shore to assess how the composition of the organic carbon in the sediments changed.
Dried samples were sieved to produce a<2 mm fraction, with larger granules later reintegrated into grain size statistics. Grain size distribution was determined by laser particle sizing (Coulter LS 200) of organic- free subsamples (treated with 30% H2O2). Total carbon, TOC, and total nitrogen were measured using an Elementar Vario EL III elemental analyzer following sample pulverization and treatment with 10% HCl to remove carbonates. Samples were measured twice and the mean value was determined. Stable carbon isotopes were measured on carbonate-free samples using a Finnigan MAT Delta-S mass spectrometer equipped with a FLASH elemental analyzer and a CONFLO III gas mixing system. Theδ13Corgof the sample was reported in per mill relative to Vienna Pee Dee Belemnite (VPDB). The standard deviation (1σ) was generally better thanδ13C = ±0.15‰.
3.2. Determination of SOC and Sediment Contents
For each terrain unit, the onshore SOC measurements were used to calculate the mass of SOC (MC) for a 1 m2 soil column equal in depth to the mean bluff height. Heights were obtained from 2013 LiDAR data (1.0 m ground resolution and vertical accuracy of 0.15 ± 0.1 m) (Kohnert et al., 2014; Obu, Lantuit, Fritz, Grosse, et al., 2016; Obu, Lantuit, Grosse, et al., 2017) and, using the zonal statistics tool in ESRI ArcMap, a mean value for each terrain unit was established for an area 200 m inland of a shoreline that was digitized from 2011 satellite images (Digital Globe, 2014, 2016). For terrain units composed of gravel features such as barrier islands and spits, the mean terrain height was set to 1 m, except for one (Stokes Point), which was assigned a height of 1.9 m based on survey data from Forbes (1997).
Where more than one sampling site occurred in a terrain unit, TOC values of the same depth were averaged before calculatingMC. For terrain units that did not contain a sampling site, values were extrapolated from areas with similar surficial geology and permafrost conditions. A column’sMCwas given by
Mc¼Xn
j¼1ρb h %OC (1)
whereMCis the mass of SOC in a soil column (kg/m2),ρbis the dry bulk density based on the original frozen volume (kg/m3),his the thickness of a soil layer (m), and %OC is the percentage of TOC by weight in a unit layer. The layers were summed to arrive at a value for the entire soil column. A similar procedure was followed to obtain the mass of the mineral portion of the sediment:
Ms¼Xn
j¼1ðρbhÞ-Mc (2)
whereMSis the mass of mineral sediment (kg/m2).
ForMC, the lowermost soil layer, which generally comprises the largest percentage of the bluff, was assigned the lowest measured value for organic carbon. In cases of high bluffs where this value did not appear repre- sentative of the lowermost layer, a default value of 0.792 (% wt) TOC was assigned. This was one of the lowest values measured in the course of this study and came from a sample at the base of the highest cliff in the study area. Where no surface layer sample was available, a 10 cm-thick organic layer was assumed, with a TOC content of 25%. This is a conservative estimate based on horizon data reported by Michaelson et al.
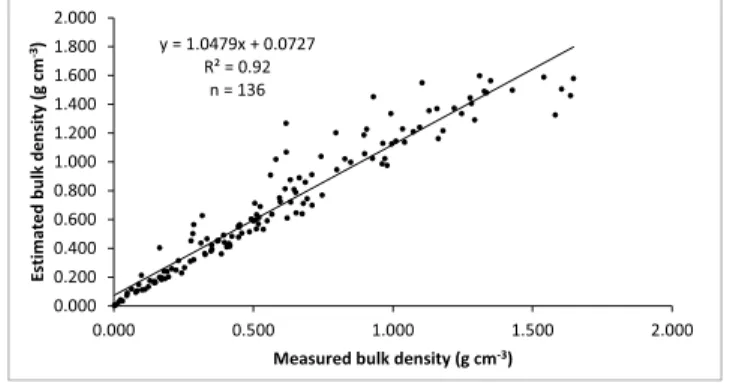
(1996) and Bockheim et al. (1999, 2003). Sand and gravel beach deposits were assigned a TOC value of 1.8% based on measurements by Smith et al. (1989) and Lawrence et al., (1984). For grab samples that had no volume measurements (9% of samples), bulk density was estimated from gravimetric ice contents accord- ing to the following equation:
ρb¼ mass of sediment
volume of ice þ volume of sediment ¼ 100
θi
ρi þ 100ρp (3)
whereθi is the gravimetric ice content of the sample (% wt) and the mass of the sediment is therefore
assumed to be 100 g,ρiis the bulk density of ice (assumed to be 0.917 g/
cm3), andρpis the particle density of the sediment (assumed to be 2.6 g/
cm3). There was a strong correlation (r2 = 0.92) when values estimated using this method were compared to measured values (Figure 2).
Where gravimetric ice contents were not available (35% of samples), another method was used based on several studies that showed a significant relationship (R2= 0.823) between organic carbon concentra- tions and bulk densities (Bockheim et al., 1998, 2003). In those cases, bulk density was estimated according to the following empirically derived equation (Bockheim et al., 1998):
ρb¼1:374 100:026x
(4) wherexis the TOC (% wt).
All SOC values were corrected to account for the volume occupied by wedge ice and massive ground ice in each layer within the column. Percentages of these ice types for each terrain unit are given by Couture (2010) and Couture and Pollard (2015, 2017) and details on the method used to estimate the different ground ice types are provided in Couture and Pollard (2017). These researchers found that pore ice and thin lenses of segregated ice comprise 35% of the volume of bluffs along the Yukon Coastal Plain, but corrections were not applied for these ice types, since they were already accounted for by the use of dry bulk density in the mass calculations.
3.3. Fluxes of SOC and Sediments
The following equation was used to calculate the annual SOC and sedimentfluxes from shoreline retreat for an entire terrain unit:
F¼A M 1;000
(5) whereFis the annualflux of SOC or sediment from the terrain unit (103kg/yr),Ais the mean annual area eroded per terrain unit (m2), andMis the total mass of material per soil column as defined above (equa- tions (1) and (2)). Eroded area of the terrain units was used rather than shoreline length, since the use of length can result in scale-related errors of more than 30%, and using area provides results that are more robust (Lantuit et al., 2009).
For the determination offlux of SOC and sediment per meter of coast, mean annual rates of shoreline change for 35 of the terrain units were calculated for the period 1953–2011 (Irrgang et al., 2017). For the six terrain units on Herschel Island, mean annual rates of shoreline change were calculated following the same method, but for the period 1975–2011. Irrgang et al. (2017) were not able to determine rates of shoreline change for three of the terrain units (Running River, Kay Point Spit, and Malcolm River fan with barrier islands), so rates of change from Harper et al., (1985) were used. The mean rates of shoreline change were then multiplied byMC andMSin a 1 m2column to obtain annualfluxes per meter of coast for SOC and sediment, respectively. In two of the terrain units (Shingle Point E and Stokes Point SE), mean annual rates of shoreline change were posi- tive, indicating net accumulation rather than erosion, but there was nevertheless some loss of sediment over the time period examined. For those two terrain units, a meanflux per meter of coast was therefore obtained by dividing the total annual loss from the terrain unit by the shoreline length of the unit (16.4 km and 4.1 km, respectively).
3.4. Fate of the Eroded SOC
In order to establish how much of SOC from the Yukon Coastal Plain is being sequestered in nearshore sedi- ments, two bulk identifiers were examined in the seabed sediments: stable carbon isotopes (δ13Corg) and organic carbon/total nitrogen (TOC/N) ratios. The amount of terrigenous organic carbon (TerrOC) in the bottom samples was determined from a mixing model that used the following equation, which assumes linear mixing between the terrigenous and marine sources of organic matter:
Figure 2.Correlation between measured bulk densities and bulk densities estimated from gravimetric ice contents.
TerrOC¼100 δ13Csampleδ13Cmarine
δ13Cterrigenousδ13Cmarine
!
(6)
For the terrigenous end-member in equation (6),δ13Corgwas measured directly in the onshore samples. The marine end-member can be quite variable in the Arctic due to phytoplankton and contributions from sea ice algae (Stein & Macdonald, 2004, and references therein). We used a value of20.75‰, as this is the mean of the one proposed by Naidu et al. (2000) (24‰) and that used by Belicka and Harvey (2009) (17.5‰). The use of the TOC/N ratio helps to reduce uncertainty associated with the variability of the marine end-member.
4. Results
Of the 44 terrain units in the study area, TOC samples were collected directly from 17 terrain units. Results were extrapolated to a further 16 terrain units with similar characteristics, and in some cases, supplemented with stratigraphic information from previously published sources. For the marine units (i.e., beaches and spits) that we were unable to sample, TOC values reported in the literature were used.
4.1. Ground Ice
As noted earlier, pore ice and thin lenses of ground ice were accounted for in SOC calculations by the use of dry bulk densities, but other types of ground ice needed to be considered. The amount of wedge ice decreased with depth and ranged from a high of 53% of a soil layer’s volume to less than 1%. Massive ice, although not present everywhere, accounted for between 52% and 97% of the volume in soil layers where it did occur. Applying corrections for the volume taken up by wedge ice and massive ice reduced overall SOC values by a mean of 19%, and sediment values by 16%. However, in terrain units with a high proportion of ground ice, reductions were as high as 43% for SOC and 46% for sediment. This underscores the impor- tance of properly identifying and quantifying massive ice bodies in permafrost to accurately quantify carbon stocks andfluxes. Table 1 shows the specific reductions for each of the terrain units that contained wedge ice or massive ice.
4.2. Organic Carbon Contents
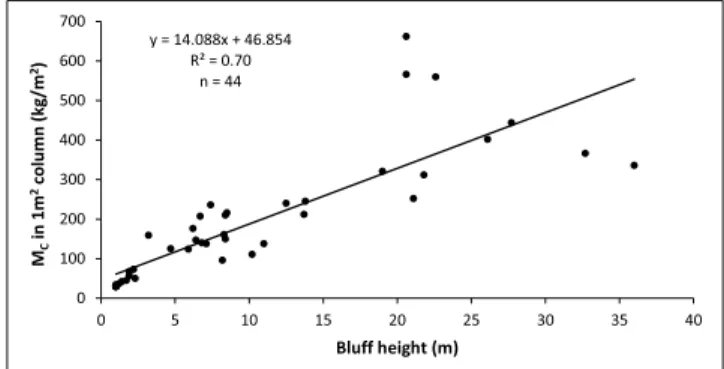
At the site level, TOC contents by percent weight generally decreased with depth. The mean for individual samples was 8.9% by weight, with a minimum of 0.5% and a maximum of 49.4%. When averaged over the entire soil column, the mean of all terrain units was 4.5 ± 3.6%, with a range of 1.2–15.6%. The lowest values were seen in high bluffs with a significant mineral content (i.e., Herschel Island N, Herschel Island W) and the highest values were seen in low bluffs with a thick organic cover (i.e., Komakuk Beach). Once bulk densities (accounting for segregated ice) and corrections for wedge ice and massive ice were applied, the SOC and sediment contents andfluxes for all units were calculated. These are shown in Table 2. Across all units, the mean SOC content in a 1 m2soil column was 183 kg. Values ranged from 30 to 662 kg C/m2and generally increased with bluff height (Figure 3), as the volume under consideration increased. Within the top 1 m, the mean value was 41 ± 14 kg C/m3. Mean values varied based on surficial materials and were highest in fluvial deposits (53 ± 15 kg C/m3), followed by lacustrine (47 ± 13 kg C/m3), glaciofluvial (44 ± 17 kg C/m3), morainal (40 ± 13 kg C/m3), andfinally marine (30 ± 3 kg C/m3). Analysis of variance (ANOVA) showed signif- icant differences based on material type, but further testing (Tukey-Kramer HSD) revealed that only the marine unit showed a significant difference from thefluvial and the lacustrine groups (Figure 4). On average, the top meter contained 43.8 ± 33.0% of the organic carbon in the entire soil column.
4.3. Material Fluxes
The mean annual rate of shoreline change for the 282 km long Yukon Coastal Plain was0.7 m/yr. Forty of the terrain units (comprising 80% of the shoreline) were undergoing erosion, two were accreting (6%), and two were stable (13%). Althoughfluxes from individual terrain units are provided in Table 2, it is theflux per meter of shoreline that is important for comparison between different parts of the coast, and between the Yukon coast and other regions in the circum-Arctic. The meanflux of SOC was 132 kg C/m/yr, with a max- imum of 549 kg C/m/yr (Table 2, Figure 5). This resulted in a totalflux of organic carbon from the Yukon coast of 35.5 × 10⁶kg/yr (0.036 Tg/yr). The meanflux of sediment per meter of shoreline was 5.3 × 10³kg/m/yr, with a maximum value of 38.6 × 10³kg/m/yr, resulting in a totalflux of sediment of 1,832 × 106kg/yr (1.832 Tg/yr).
4.4. Organic Carbon in Nearshore Sediments
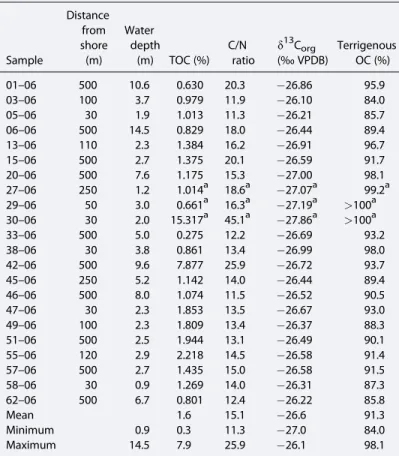
Analysis of 50 onshore samples taken from different terrain units gave a mean δ13Corg value of 27.12 ± 0.77‰. This was the value used as the terrigenous end-member in the mixing model to determine the percentage of terrigenous organic carbon in the nearshore sediments. Samples of nearshore sediments were taken up to 500 m from shore and at water depths ranging from 0.9 to 14.5 m. Twenty-two of the near- shore samples were analyzed forδ13Corg‰. Table 3 shows the results from isotopic analyses and from the mixing model. Three of the 22 samples should be viewed with caution because they showed very little decomposition visually and appeared to consist almost entirely of terrestrial organic matter, a fact corrobo- rated by their lowδ13C values and simultaneously high C/N ratios (Figure 6); these were omitted from further calculations. Values ofδ13C for the nearshore samples ranged from27.00 to26.10‰and C/N ratios ran- ged from 11.3 to 25.9. Based on results from the isotopic mixing model, the organic carbon in the nearshore sediments was overwhelmingly terrestrial, with a mean terrigenous organic carbon content of 91.3% and a marine content of 8.7%.
Table 1
Reduction in Values of Soil Organic Carbon and Sediment Due To the Presence of Wedge Ice and Bodies of Massive Ground Ice
Soil organic carbon (SOC) Mineral sediment
Terrain unit
Surficial geologya
Before correction (kg/m2)
After correction (kg/m2)
Reduction (%)
Before correction (kg/m2)
After correction (kg/m2)
Reduction (%)
Running River F 578 560 3 24,559 24,218 1
Shingle Point E Mm 249 212 15 16,342 15,169 7
Shingle Point W Mm 443 252 43 25,008 21,158 15
Sabine Point E L 514 321 38 6,996 5,566 20
Sabine Point Mm 807 662 18 21,819 12,724 42
Sabine Point W L 596 566 5 8,544 8,247 3
King Point SE L 169 111 35 12,680 6,823 46
King Point L 308 236 24 2,644 2,023 23
King Point NW Mm 424 366 14 41,411 34,787 16
Kay Point SE Mr 467 402 14 28,673 26,109 9
Kay Point G 275 216 21 8,890 7,905 11
Phillips Bay L 141 125 11 2,837 2,699 5
Phillips Bay NW Mm 316 245 22 17,848 13,748 23
Stokes Point SE L 195 161 17 6,539 6,352 3
Stokes Point W Mm 301 240 20 15,343 12,165 21
Roland Bay E L 221 210 5 10,267 9,825 4
Roland Bay W Mm 203 150 26 9,123 6,541 28
Roland Bay NW L 152 124 18 1,749 1,486 15
Whale Cove E Mm 130 96 26 7,579 5,486 28
Whale Cove W G 53 45 15 725 626 14
Workboat Passage E G 68 50 26 1,142 861 25
Workboat Passage W Mm 191 147 23 2,831 2,188 23
Herschel Island S Mr 157 138 12 13,940 12,392 11
Herschel Island E Mr 486 312 36 25,594 17,422 32
Herschel Island N Mr 401 336 16 36,894 32,206 13
Herschel Island W Mr 553 444 20 33,830 26,595 21
Malcolm River fan F 71 67 6 2,058 1,829 11
Komakuk Beach L 187 176 6 3,397 3,279 3
Komakuk W1 L 197 140 29 3,940 3,332 15
Komakuk W2 L 233 207 11 6,048 5,601 7
Clarence Lagoon E F 78 73 5 2,421 2,189 10
Clarence Lagoon W L 240 138 43 6,034 5,297 12
Mean 294 235 19 12,741 10,526 16
Minimum 53 45 3 725 626 1
Maximum 807 662 43 41,411 34,787 46
Note. Corrections are needed because volumes of wedge ice and massive ice were determined for the overall terrain unit, so were not accounted for within indi- vidual samples. The volume of each ice type was calculated for every sampled layer of soil and a correction applied to the measured values of SOC and sediment (see supporting information, Table S1). The results shown here are the summed values for all layers within a 1 m2soil column.
aAbbreviations for surficial geology: F =fluvial; Mm = rolling moraine; L = lacustrine; Mr = ice-thrust moraine; G = glaciofluvial.
Table2 TerrainUnitCharacteristicsandMaterialFluxes Soilorganiccarbon(SOC)Mineralsediment Terrainunit
Bluff Height (m)
Change rate (m/yr)
Meanannual erodedarea (m2 /yr)
Mcin 1m2 column (kg)
Mcin top1m (kg)
Mc> 1m (kg)
Cin topm (%)
Mcfluxper mofcoast (kg/yr) Mcflux fromunit (103 kg/yr) Msin 1m2 column (103 kg) MsFluxper mofcoast (103 kg/yr)
Msflux fromunit (103 kg/yr) 1.RunningRiver22.60.72,82756059501113921,58324.217.068,463 2.ShinglePointE13.70.23,1032,12341,7816406,5815.20.047,070 3.ShinglePointW21.10.21,99525235217145050321.24.242,211 4.SabinePointE19.00.489432146275141142875.62.049,76 5.SabinePoint20.60.82,0006625960495491,32412.710.625,448 6.SabinePointW20.60.71,9585664651984061,1088.25.916,148 7.KingPointSE10.21.14,0571113180281174496.87.227,682 8.KingPoint7.40.694523640195171362232.01.21,912 9.KingPoint Lagoon1.00.3598303001009181.60.5984 10.KingPointNW32.70.268636640326117825134.87.423,864 11.KayPointSE26.10.23,863402293737831,55426.15.4100,860 12.KayPoint8.52.35,97221663153294961,2907.918.247,210 13.KayPointspit1.00.0030300100001.60.00 14.Babbage Riverdelta3.21.012,1841597288451521,9422.72.632,974 15.PhillipsBay4.70.66,545125477838818152.71.717,666 16.PhillipsBayW1.00.53,15434340100171061.60.851,77 17.PhillipsBayNW13.80.41,01124528217119224813.75.213,899 18.StokesPointSE8.30.5408161421202616666.40.02,592 19.StokesPoint1.93.616,989573027532049733.111.153,094 20.StokesPointW12.50.92,556240571832421261312.210.831,094 21.RolandBayE8.40.71,73321024186111573649.87.417,026 22.RolandBayW8.40.41,209150559537671816.52.97,908 23.RolandBayNW5.90.3909124438135411131.50.51,351 24.WhaleCoveE8.20.21509618781817145.51.0823 25.WhaleCove1.00.51,3843030010014421.60.72,277 26.WhaleCoveW1.71.03,6854536979451670.60.62,306 27.CattonPoint1.40.32,1564230127212912.30.74,965 28.Workboat PassageE2.30.44,28450331865192150.90.33,688 29.Workboat PassageW6.40.58571474210528721262.21.11,875 30.HerschelIslandS11.00.34,60413836102264163612.43.757,055 31.HerschelIslandE21.80.44,36531234278111251,36017.47.076,048 32.SimpsonPoint1.00.52,3223030010015701.60.83,819 33.HerschelIslandN36.01.221,2613363030694037,13832.238.6684,737 34.HerschelIslandW27.70.96,06444455389124002,69526.623.9161,271 35.Avadlekspit1.20.75,2833630683251912.01.410,428 36.Nunalukspit1.01.227,1803024680368191.62.044,707 37.MalcolmRiver fanwithbarrier islands
1.00.0030300100001.60.00 38.MalcolmRiverfan1.90.87,21167511676544811.81.513,189 39.KomakukBeach6.21.317,377176631133623630583.34.456,974 40.KomakukW16.81.62,8941406476452234053.35.39,642
5. Discussion
5.1. Ground Ice
As was seen from the reduction of SOC and sediment values in Table 1, failing to account for ground ice can result in significant overestimates of the total amount of material con- tained within a terrain unit and of its annualflux. Although wedge ice has been shown to account for 4% of frozen materials along the Yukon Coastal Plain (Couture & Pollard, 2017), it comprised 16% of the upper 7 m of soil. It is therefore not just the overall volume of ground ice that is important, but the stratigraphic relationship between wedge ice and organic carbon, in particular, since they both vary with depth (Couture & Pollard, 2017;
Ulrich et al., 2014). In addition, several studies have noted the relationship between ground ice volumes and surficial deposits, with ground ice generally higher infine-grained materi- als with higher SOC contents (e.g., Couture & Pollard, 2017; Kanevskiy et al., 2013;
Rampton, 1982). Some studies, while acknowledging the importance of ground ice, do not include it in their calculations of material fluxes (i.e., Harper & Penland, 1982; Hill et al., 1991). Others considered ground ice volumes in varying degrees of detail. Our values for wedge ice are approximately twice those of Jorgenson and Brown (2005) who used a slightly cruder ice wedge geometry in their calculations of SOC contents for the Alaska Beaufort Sea coast. Brown et al. (2003) used a mean value of 50% for all ground ice types in the same region. In their analysis of TOCfluxes along the Alaskan Beaufort coast, Ping et al. (2011) used ice contents reported by Kanevskiy et al. (2013), who found a total aver- age volumetric ice content of 77% (for wedge, segregated, and pore ice), with wedge ice ranging from 3 to 50% (mean 11%) within the top 3–4 m of various terrain types. Rachold et al. (2000) used different values for different coastal types along the Laptev Sea; some were simple means, while other were based on the various types of ground ice.
Dallimore et al., (1996) provided an in-depth evaluation of all types of ice in their calcula- tions of sedimentsfluxes from northern Richards Island in the Mackenzie Delta. In some cases, the importance of a detailed investigation depends on the geomorphology of the coast. For instance, Brown et al.’s (2003) use of a mean ground ice value of 50% did not have a significant impact on potential stratigraphic differences because the mean elevation of bluffs they considered was only 2.5 m, so changes in ice content or in SOC content with depth were not as important. Considering the varied elevations along the Yukon coast and the wide range of ground ice volumes with depth, our detailed stratigraphic approach is warranted.
5.2. Organic Carbon Contents
Given the sparseness of data on SOC for the Yukon Coastal Plain, this study contributes to a more thorough estimate of C stores in a region where carbon cycling is likely to increase with accelerating coastal erosion (Irrgang et al., 2017; Obu, Lantuit, Fritz, Pollard, et al., 2016; Radosavljevic et al., 2016). In addition to nearly tripling the number of pedons for which data are available, the results provide important information about deeper stores of organic carbon. The overall mean SOC value reported here (183 kg C/m2) is approximately 3 to 6 times higher than many previous estimates of TOC primarily because this study exam- ines the entire soil column, whereas previous ones focused on the upper portions. Our values are closer to those reported by Jorgenson et al. (2003) in coastal banks up to 3.3 m high in northeastern Alaska (54 to 136 kg C/m2) or by Hugelius et al. (2014) who looked at depths up to 3 m and found organic carbon contents of 150 kg C/m2in the Arctic coastal lowlands. Dou et al. (2010), however, noted the spatial variability of SOC contents along the Alaskan Beaufort coast, reporting a range of 2.6 to 187 kg C/m2(mean 41.7 kg C/m2), with lower values in the east near the Canadian border. When comparing the top 1 m of soil only, our mean value of 41 kg C/m3 is consistent with values found by Jorgenson and Brown (2005) for the entire Alaskan coast (30 to 79 kg C/m3). Bockheim et al. (1999) reported values of (50 kg C/m3) for the area around Barrow in northwestern Alaska coast. As they noted, this is less than other inland Arctic sites (62 kg C/m3 reported in Michaelson et al., 1996, and
Table2.(continued) Soilorganiccarbon(SOC)Mineralsediment Terrainunit
Bluff Height (m)
Change rate (m/yr)
Meanannual erodedarea (m2 /yr) Mcin 1m2 column (kg)
Mcin top1m (kg)
Mc> 1m (kg)
Cin topm (%)
Mcfluxper mofcoast (kg/yr) Mcflux fromunit (103 kg/yr) Msin 1m2 column (103 kg) MsFluxper mofcoast (103 kg/yr)
Msflux fromunit (103 kg/yr) 41.KomakukW26.71.18,98220761146302371,8595.66.450,311 42.ClarenceLagoonE2.20.98917351226965652.21.91,950 43.ClarenceLagoon1.00.82,7383030010025831.61.44,504 44.ClarenceLagoonW7.11.69,7791386177442151,3475.38.351,798 Mean9.70.74,751.418341142441328088.25.341,636 Minimum1.03.60.0301807000.60.00 Maximum36.00.527,180.0662726041005497,13834.838.6684,737 Totalflux(103 kg/yr)35,5301,831,972 Note.Thevaluesforthemassofsoilorganiccarbon(MC)andmineralsediment(MS)shownherehavebeencorrectedforthepresenceofgroundice.
65 kg C/m3in Bockheim et al., 1998), which might be due to higher ground ice contents in the coastal regions. Our results emphasize how important it is to include deeper carbon in calculations since only 44% of the SOC in our study was stored in the upper 1 m, with 56% of it at greater depths. Bockheim and Hinkel (2007) found 64%
of SOC within the upper 1 m and 36% in the 1–2 m depth range.
Tarnocai et al. (2009) calculated 48% for the upper 1 m, and 52%
between 1 and 3 m; when they included even deeper deposits, the ratio became 30% SOC above 1 m to 70% below. A number of different processes have contributed to the presence of organic carbon at depth in the sediments of the Yukon Coastal Plain includ- ing cryoturbation, alluvial deposition, ice thrusting, accumulation in lacustrine basins, and possibly burial by eolian deposition (Rampton, 1982). Coastal erosion involves the mobilization of all the carbon in the soil column relative to the sea level, so it is essential to consider deep SOC influx calcu- lations. In more inland regions, processes that affect carbon cycling (such as the thaw of the upper part of permafrost), are more likely to involve near-surface SOC only, so the consideration of carbon at greater depths may not be as critical. Several of the assumptions made in this study are conservative, particularly with regards to the 25% organic carbon content in the surface horizon and in extrapolating the values of 0.792% to the base of soil columns. In addition, the amount of carbon in some ice-thrust morainal units was likely underestimated since a minimum SOC value was used for most of the volume of the bluff, but glaciotectonic and thaw slump activity likely resulted in an interlayering of carbon-rich and carbon- poor layers.
5.3. Material Fluxes
The results presented here indicate fluxes of SOC (0.036 Tg/yr) and sediment (1.832 Tg/yr) from the 282 km of the Yukon Coastal Plain shoreline. The sedimentflux is 17% more than the value given by ear- lier studies by Harper and Penland (1982) for the Yukon (and later used by Hill et al., 1991). Those authors noted that their sedimentflux was a first approximation only and was likely a maximum value since they were not accounting for ground ice volumes. The discrepancy with our results is partly due to the fact that their study considered less of the shoreline to be erosive (150 km versus the approximately 225 km considered here) and partly due to probable differences in bluff height estimation. The only other study of SOCflux for the region was based on the entire shoreline of the Canadian Beaufort Sea (Macdonald et al., 1998) and provided a range of potentialfluxes. Using data from Yunker et al. (1991), Macdonald et al. estimated annualflux to be 0.06 Tg/yr. Their value for the Yukon coast would be 0.015 Tg/yr, which is less than half of theflux found in this study. Again, they considered a shorter length of shoreline and only looked at eroding peat, not other sediment contained in the coastal bluffs. Their maximum estimate for SOCflux was 0.3 Tg/yr, based on data from Hill et al. (1991) and a pre- sumed SOC content for all coastal sediments of 5% by weight. The value for the Yukon portion of the coast would be 0.12 Tg/yr, which is 3.5 times our result. As seen above, however, eroded volumes did not account for ground ice and so are likely too high. It is interesting to note that even though SOC values for our terrain units ranged from 1.2% to 15.6%, the value assumed by Macdonald et al. (1998) is very similar to our mean of 4.5% for all units. If our results from the Yukon Coastal Plain are applied to the other areas of peat erosion examined by Macdonald et al. (1998), the mean flux of SOC to the Canadian Beaufort Sea would be 0.17 Tg/yr, which is almost 3 times the value used to date in Arctic Ocean budgets (Rachold et al., 2004). This is Figure 3.Correlation between bluff height and the mass of soil organic carbon
(MC) in a 1 m2column.
Figure 4.Soil organic carbon density in the top 1 m for terrain units with dif- ferent surficial geologies. The line in the middle of boxes represents the median, with lower and upper parts of the box representing 25% and 75% of the distribution, while the lower and upper whiskers represent the minimum and maximum of the distribution. Materials not sharing the same letter above the box plots are significantly different from each other based on the Tukey–Kramer HSD comparison of means (p<0.05).