The influence of skeletal micro-structures on potential proxy records in a bam- boo coral
Sebastian Flater, Jan Fietzke, Marcus Gutjahr, Jesse Farmer, Barbel Hanisch, Gernot Nehrke, Anton Eisenhauer
PII:
DOl:
Reference:
To appear in:
Received Date:
Accepted Date:
S0016-7037(18)30715-4
https://doi.org/10.1016/j.gca.2018.12.027 GCA 11060
Geochimica et Cosmochimica Acta 2 May 2018
18 December 2018
Please cite this article as: Flater, S., Fietzke, J., Gutjahr, M., Farmer, J., Hanisch, B., Nehrke, G., Eisenhauer, A., The influence of skeletal micro-structures on potential proxy records in a bamboo coral, Geochimica et CosmochimicaActa (2018), doi: https://doi.org/10.1016/j.gca.2018.12.027
This is a PDF file of an unedited manuscript that has been accepted for publication. As a service to our customers we are providing this early version of the manuscript. The manuscript will undergo copyediting, typesetting, and review of the resulting proof before it is published in its final form. Please note that during the production process errors may be discovered which could affect the content, and all legal disclaimers that apply to the journal pertain.
The influence of skeletal micro-structures on potential proxy records in a bamboo coral
Sebastian Flater\ Jan Fietzke\ Marcus Gutjahr\ Jesse Farmer2'3
, Barbel Hi:inisch2, Gernot Nehrke4,
Anton Eisenhauer1
1 GEOMAR Helmholtz Centre for Ocean Research Kiel, Wischhofstr. 1-3, 24148 Kiel, Germany 2 Department of Earth and Environmental Sciences and Lamont-Doherty Earth Observatory of Columbia University, 61 Route 9W, Palisades, NY 10964, USA
3 now at Department of Geosciences, Princeton University, Guyot Hall, Princeton, NJ 08544, USA 4 Alfred Wegener Institute, Am Handelshafen 12, 27570 Bremerhaven, Germany
Abstract
Assessing the physicochemical variability of the deeper ocean is currently hampered by limited instrumental time series and proxy records. Bamboo corals (lsididae) form a cosmopolitan family of calcitic deep sea corals that could fill this information gap via geochemical information recorded in their skeletons. Here we evaluate the suitability of high-resolution chemical imaging of bamboo coral skeletons for temperature and nutrient reconstruction. The applied elemental mapping techniques allow to verify the suitability of the chosen transect on the sample section for paleo-reconstructions and enhance the statistical precision of the reconstruction. We measured Mg/Ca via electron microprobe at 111m resolution and Ba/Ca via laser ablation ICP-MS at 35 11m resolution in a historic specimen of Keratoisis grayi from the Blake Plateau off Eastern Florida. Long-term growth temperatures of 7.1 ± 3.4
oc
(± 2 SD) that are in agreement with recent ambient temperature range can be reconstructed from Mg/Ca ratios provided that anomalously Mg-enriched structural features around the central axis and isolated features related to tissue attachment are avoided for reconstruction. Skeletal Ba/Ca measurements reflect mean seawater barium [Ba]5w concentrations ([Ba]5w =51± 24 nmol kg-1 (± 2 SD)), in agreement with instrumental data (47 nmol kg-1). We show for the first time that Ba/Ca forms concentric structures in a bamboo coral skeleton section. Our investigations suggest that, while bamboo coral skeletons do record environmental parameters in their mean chemical composition, the magnitude of environmental variability reconstructed from high-resolution chemical maps exceeds that expected from instrumental time series. This necessitates additional investigation of the factors driving bamboo coral skeletal composition.1. Introduction
Cold water corals (CWCs) are receiving rising scientific interest as potential proxy recorders of a rarely observed environment. These animals can thrive in the deep sea - a habitat comprising the largest carbon reservoir in the ocean. Importantly, ewes often inhabit hard substrates in environments where low sedimentation rates otherwise limit or even prohibit reconstructions from the sedimentary archive. Both global trends (such as changes in temperature or pH) and variable local oceanographic conditions (such as organic matter supply or shifting ocean currents) impact life in deep ocean ecosystems (Levin and Le Bris, 2015; Ruhl and Smith, 2004), but the spatial and temporal dearth of instrumental records is a major hurdle to our understanding of longer term environmental conditions and oceanographic variability in the deep sea.
The paucity of deep ocean instrumental data may be alleviated using detailed geochemical information from calcifying ewes (e.g. Robinson et al., 2014). ewes are surface- to deep-sea dwellers and have the potential to record environmental signals in their calcareous skeleton at up to sub-annual resolution (Sherwood and Risk, 2007). The high-magnesium calcite (HMC)-precipitating octocoral family lsididae- also called bamboo corals- lives in a depth range of less than 10 to more than 2000 m (Bostock et al., 2015; Thresher et al., 2016). They can therefore occur in waters well below the aragonite saturation Horizon (Guinotte et al., 2006) where only a small fraction of aragonitic ewes can survive (Cairns, 2007). Reconstructed bamboo coral radial growth rates range from 12 to 180 11m y(1 t armer et al., 2015b and references therein). Their calcitic ontogeny is sometimes characterized by growth rings (Noe and Dullo, 2006), and "spiral like" structures (Thresher and Neil, 2016), both of which can be observed by the naked eye. Geochemical analyses of these calcitic structures may therefore offer high-resolution environmental reconstructions, provided that ontogenetic effects on geochemistry can be understood. Because bamboo corals have long lifespans, sometimes in excess of 300 years (Andrews et al., 2009; Hill et al., 2011), splicing geochemical records of temporally overlapping specimens (Prouty et al., 2011) might allow reconstruction of (sub-)annual growth conditions over several hundreds of years.
Various elemental and isotope ratios have been analysed in both the organic nodes and calcareous internodes of bamboo corals (Robinson et al., 2014). For example, previous studies link internodal Mg/Ca to ambient water temperature (Thresher et al., 2004; Thresher et al., 2016; Thresher et al., 2010),
o
11B to ocean pH (Farmer et al., 2015a), ando
13C and 6180 to temperature (Hill et al., 2011;Kimball et al., 2014; Saenger et al., 2017). Additionally, bamboo coral Ba/Ca has been proposed as a nutrient proxy, with Ba/Ca indicating [Ba]5w (LaVigne et al., 2011; Serrato Marks et al., 2017;
Thresher et al., 2016) and/or [Si]sw (Thresher et al., 2016). In the organic nodes, bulk
o
15N was foundto serve as an indicator of food source and ecosystem trophic dynamics (Hill et al., 2014; Sherwood et al., 2009). Furthermore,
o
13C analyses on nodal organic material have been applied to reconstruct theo
13C of the exported surface ocean primary production (Schiff et al., 2014).Although previous studies have generally demonstrated the potential of bamboo corals to record environmental conditions, calibrations established with bulk measurements may hamper fine-scale reconstructions of past environmental conditions (e.g. Aranha et al., 2014). In order to assess whether fine-scale environmental information can be extracted from single specimens, skeletal microstructures and their influence on the proxy record need to be investigated. In this study we quantify the spatial and microstructural chemical composition of bamboo corals using element mapping approaches via laser ablation ICP-MS, electron microprobe analysis, and confocal Raman microscopy. These techniques allow us to gain detailed information at high spatial resolution regarding elemental composition of bamboo coral internodes, growth structures and mineralogy.
Specifically, we assess the ability of bamboo coral Mg/Ca and Ba/Ca to work as high-resolution temperature and nutrient proxies, respectively. To investigate the distribution of organic material, we mapped fluorescense and sulfur content via confocal Raman microscopy and electron microprobe, respectively. The employed techniques complement one another and shed light on how bamboo corals build their skeleton. Although LA-ICP-MS mapping has been applied as a promising new tool in paleoclimatic (Fietzke et al., 2015) and biomineralisation studies (Evans and Muller, 2013;
Oppelt et al., 2017), fine-scale mapping and subsequent reconstruction of environmental parameters presented here are, to the best of our knowledge, the first application to octocorals.
2. Oceanographic setting, material and methods
2.1. Specimen and sample
We selected Keratoisis grayi (Octocorallia, lsididae) specimen number USNM 10496 of the Smithsonian National Museum of Natural History because it grew in the western Atlantic on the Blake Plateau, where the Gulf Stream is formed. Scientific interest for this site is given by the observation that the Gulf Stream waters exert a major influence on the climatic conditions of Europe (Palter, 2015). Sample growth rate was previously constrained using radiocarbon
e
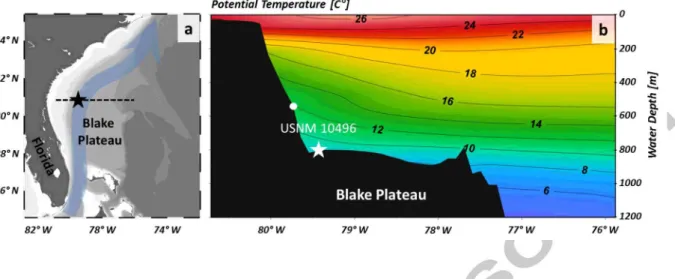
4C) (Farmer et al., 2015b), and the internodal sample section shows a pronounced visible ring structure that may be associated with compositional variability. The coral was collected alive in 1885 from 805 m water depth at 30.733° Nand 79.433° W off East Florida (Fig. 1) by the United States Fish Commission. No signs of bioerosion or diagenetic alteration are apparent, suggesting the coral was alive at the time of collection.2.2. Oceanographic setting
Surface ocean circulation over the Blake Plateau is dominated by the Gulf Stream (Fig. la). This boundary current is formed by the Florida Current (FC), which travels from the Gulf of Mexico through the Florida Strait, and the Antilles Current, which passes along the east coast of the Bahamas (Jahnke and Blanton, 2010). Ocean bottom water at the sampling site consists of modified Antarctic Intermediate Water, which is colder and less saline than the overlying water mass (Atkinson, 1983;
Kashgarian and Tanaka, 1991). Mean bottom water temperatures measured at mooring stations 80 km away from the sampling site (30.0° N and 79.4° W at 794 m depth) were 7.6 ± 1.2
oc
(± 2 SD) for March to September 1981 and 8.1 ± 1.2oc
(± 2 SD) for September 1981 to March 1982 (Lee and Waddell, 1983). Gridded potential temperatures according to the nearest 0.25° x 0.25° World Ocean Atlas 2013 (WOA) grid point at 30.625° N and 79.375° W at 800 m depth were ::::: 9oc
(Locarnini et al., 2013) (Fig. lb). While the seasonal temperature variation at the exact sampling location is unknown, available hydrographic data suggest the coral was likely bathed in highly variable ocean bottom temperatures. For example, Lee and Waddell (1983) found a total annual thermal variation of 3.9oc
above seafloor at the mooring closest to our sampling site. Seventeen years of CTD casts east of Abaca Island (Bahamas) show a long-term temperature variation of 6.0
oc
around a mean of 10.3 ± 2.6oc
(± 2 SD) at 800 m depth (data were collected as part of NOAA's Deep Western Boundary Current Time Series (DW~ and are available at www.aoml.noaa.gov/phod/wbts/. The FC exhibits a strong seasonal cycle With maximum current strength during summer in addition to inter-annual variability in water transport (Baringer and Larsen, 2001). Strong ocean bottom currents on the Blake Plateau (flow ::::: 5 to > 40 em s-\ Pratt, 1963) limit deposition of sinking particles and expose hard phosphorite grounds (Filippelli, 2011) and manganese pavements (Pratt and McFarlin, 1966) in otherwise calcareous sand (Milliman et al., 1972). The hard substrate and high currents on the Blake Plateau provide suitable habitats for deep-sea coral growth (Edinger et al., 2011; Reed et al., 2006).2.3. Confocal Raman Microscopy
To prepare USNM 10496 for analysis, we embedded a slice of the basal internode in Araldite resin under vacuum, dried it overnight at 50
oc
in an oven and polished it in a graded series with Struers Dia Pro water based diamond emulsion of 9 11m, 3 11m, and 111m grain size with a Struers TegraPol polishing machine. The sample was rinsed with demineralised water after each polishing step.The polished sample section was used to determine the mineralogical composition and distribution of organic components within the sample by means of confocal Raman microscopy (CRM). CRM measurements were performed using a WITec alpha 300 R instrument and a diode laser having an
excitation wavelength of 488 nm at the Alfred Wegener Institute, Helmholtz Centre for Polar and Marine Research in Bremerhaven, Germany. A Zeiss 20x Epiplan lens (NA 0.4) was used for scanning larger areas of the sample. Dedicated areas within these larger areas were subsequently scanned with a higher spatial resolution using a Nikon lOOx lens (NA 0.9). High spectral resolution of the Raman spectrum was obtained by using a UHTS300 ultra high throughput spectrometer (WITec GmbH, Ulm, Germany) equipped with 1800 mm-1 grating blazed at SOD nm. Data were measured and analysed using WITec ProjectFOUR software. An optical clear calcite single crystal (Iceland-spar from Mexico) was used as an in-house standard to obtain a calcite Raman spectrum under sample measurement conditions. Wall and Nehrke (2012) demonstrated that enhanced fluorescence in the Raman spectrum of corals correlates well with the distribution of organic compounds within the skeleton. We used this method to create Raman maps showing the distribution of enhanced fluorescence (using the spectral range from 2000 to 2400 em-\ i.e. the distribution of organic components within the skeleton.
2.4. Electron Microprobe Analyses
Calcium, magnesium and sulfur concentrations in the sample were determined by electron microprobe (EMPA) using a JEOL 1XA 8200 at GEOMAR Helmholtz Centre for Ocean Research Kiel.
Prior to analysis, the sample section was sputtered with carbon to avoid sample charging. Element distributions were simultaneously measured by wavelength-dispersive spectrometers. Ca was measured by using PET (pentaerythritol), Mg using TAPH (thallium acid phthalate, high intensity) and S using PETH (pentaery,thritol, high intensity) as diffraction crystals, respectively. An overview map of the whole sample was established with a 15 11m electron beam size, a dwell time of 25 ms pixer1 and a current of 100 nA. A high resolution transect across the radius with a width of 300 11m was performed with a 111m beam, a dwell time of 45 ms pixer\ and a current of 100 nA. The dwell time and current were chosen to assure high signal intensity while preventing the carbon coating from being removed by the electron beam. We can exclude sample damage via comparison of the actual Ca counts in a calcite standard with their theoretical counts based on the determined calibration factors from non-carbonate standards (see Fig. A 2). All maps were created integrating once on a single spot. Depending on the necessities of further comparison the element concentrations are given as absolute concentration in wt% based on the concentration calibration for one element or the relative concentration in mol mor1 based on the concentration calibration for two elements. The latter is calculated under the assumption that the sample material is only composed of calcium carbonate. Detection limits for 111m resolution were calculated as three times the standard deviation (SD) of the background signal for Ca, Mg and S for a single pixel analysis, and were 2.33, 0.46 and
0.01 wt%, respectively. The two-sided 2a relative variation of a single pixel's Mg/Ca ratio was based on counting statistics and is about± 15 %. These are the upper limits, which improved threefold upon averaging nine (three times three) neighbouring pixels for smoothing the Mg/Ca maps compared to a single pixel. About the same improvement was achieved by averaging 10 parallel Mg/Ca lines used for temperature reconstruction. S content was initially mapped as a potential indicator of organic matter distribution as proposed for scleractinians (Cuif et al., 2003). Electron backscatter images indicating the mean atomic number of the sample volume were taken after elemental maps were recorded.
2.5. Laser ablation inductively coupled plasma mass spectrometry
The fine-scale abundance of Ba and Ca was mapped by laser ablation inductively coupled plasma mass spectrometry (LA-ICPMS) with a Nu AttoM sector field ICP-MS coupled to an Electro Scientific Industries NWR 193 nm excimer laser at GEOMAR Helmholtz Centre for Ocean Research Kiel. The sample was investigated with CRM and EMPA prior to LA-ICP-MS to avoid multiple polishing steps, since laser ablation roughens the sample surface. The same section previously analysed with high resolution EMPA was chosen for comparability. Instrumental settings were tuned for hot plasma conditions according to Fietzke and Frische (2016). Any potential surface contamination and the carbon coating from EMPA measurements was removed by a previous measurement at the same site. The laser beam for data acquisition moved with 25 11m s-1 over the sample, had a diameter of 35 11m, a pulse rate of 25 Hz and a fluence of 2.5 J cm-2• The map was created by four runs of 20 parallel line scans with 10 11m overlap each. Upon completion of each of these four runs, a gas blank and a NIST SRM 610 glass standard were measured under the same ablation conditions. Data acquisition was performed during two sessions.
As the data reduction applied here is not a standard procedure, it is described in detail below. Data r duction was carried out offline, using 44Ca as an internal standard and NIST SRM 610 for external calibration. Individual lines were aligned based on the 44Ca intensity, separating the ablation from the background signal. By averaging 2x3 data points, a smoothed map of background subtracted values was created and statistical noise was lowered. The detection limits for a single pixel were 20 ppm for Ba and 250 ppm for Ca after smoothing. The 138Ba/4Ca ratios were then calculated after the smoothing procedure was applied to the raw counts per second of Ba and Ca. The offset between the four single maps was removed by averaging representative regions on all maps and subsequent application of a factor (0.94 to 1.07) to match the mean concentration of all selected regions. The resulting map of every ratio is 1.8 x 4.6 mm in size and contains 20,500 pixels. For [Ba]5w
reconstruction the mean of 20 parallel lines was used which resulted in a 2o relative variation of Ba/Ca lower than ± 0.1% based on counting statistics. This was done in addition to the initial smoothing applied to the raw counts of the Ba and Ca maps.
2.6. Etching and secondary electron imaging
After completing its chemical characterisation via CRM, EMPA and LA-ICP-MS, the sample was polished again using a 111m polishing emulsion, then etched for 5 minutes in 0.1 HCI and rinsed with deionised water to visualise growth structures and crystals. The sample was then coated again with carbon and secondary electron images were produced with a JEOL JXA 8200 microprobe.
Etching of the sample was carried out after chemical mapping to avoid potential partial leaching of the investigated elements and compounds.
2. 7. Age model
For temporal analysis of our geochemical mapping data, we used the linear 14C age model of Farmer et al. (2015b), which is based on three radiocarbon dates and yields a mean growth rate of 29 ± 10 11m y(1. A fourth innermost value was excluded due to potential infilling. While more complex nonlinear growth modes have been postulated for bamboo corals (e.g., Frenkel et al., 2017), we prefer the simple linear model for this sample, given the limited available chronological data and relative calendar age imprecision of the pre-bomb 14C dates. An absolute (calendar) age model was established for this specimen using the collection date (1886) and estimated mean growth rate (29 ± 10 11m y(1). To estimate the relative dating precision for a given sampling point, we started with the sampling date (1886) and integrated the growth rate uncertainty published by Farmer et al.
(2015b). This leads to an increase from no uncertainty in 1886 when the sample was collected alive, to +40 and -80 years at about 1740, when the coral is supposed to have started growing. The one- sided dating uncertainty ~t+;- in years was calculated as follows:
Eq. (1)
where d is the distance from the outer rim in 11m, GRm is the mean growth rate in 11m y(\ GR+·- are the respective upper and lower growth rate estimates in 11m y(\ and Aabs is the year of sampling.
3. Results
3.1. Visual sample description
3.1.1. Micrograph optical properties
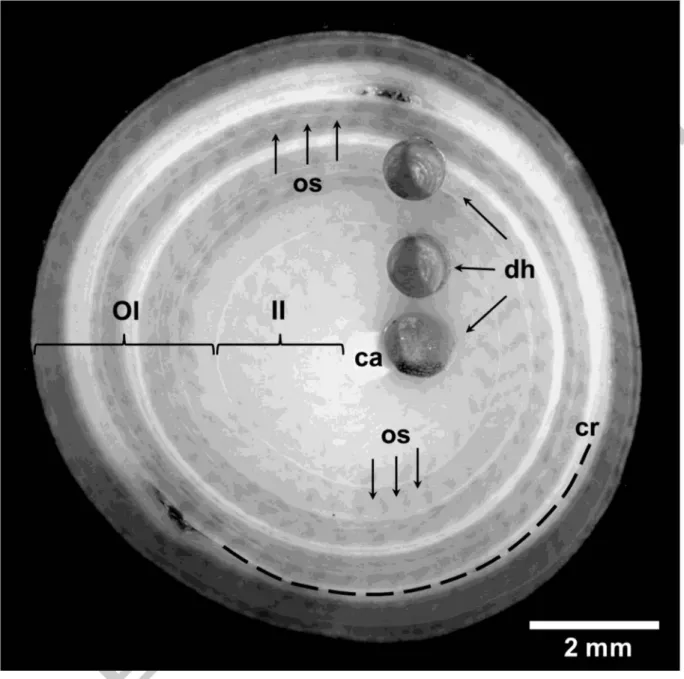
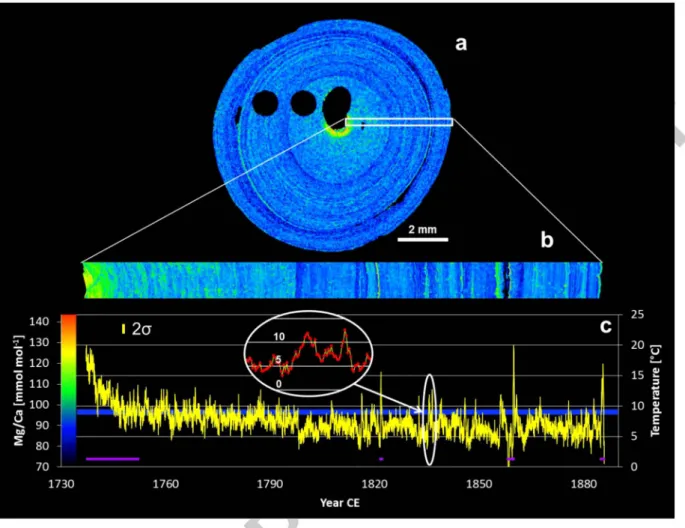
The internodal cross section of bamboo coral specimen USNM 10496 shows concentric visible rings and patterns of elongated opaque structures that are tilted with respect to the radial growth direction and more transparent areas between them (Fig. 2). Three drill holes from preceding growth rate investigations (Farmer et al., 2015b) are clearly visible, while drilling the innermost sample filled the otherwise hollow central axis with drilling dust. One concentric crack can be observed about 0.8 mm away from and parallel to the rim of the internode. Along this interruption two sites display a bump in the otherwise concentric visible growth rings. The sample exhibits two major bright ring features. More general features are the multiple alternating opaque-translucent inclined patterns embedded between two growth rings and will be referred to as inter-ring structures below. These patterns change orientation in one band from clockwise to counter clockwise with an apparently wave-like structure. The inter-ring structure is hardly visible within the 1.6 mm radius of the central axis. This inner increment is more uniformly opaque than the outer increment, where pronounced darker and brighter rings can be seen.
3.1.2. Etched surface structure
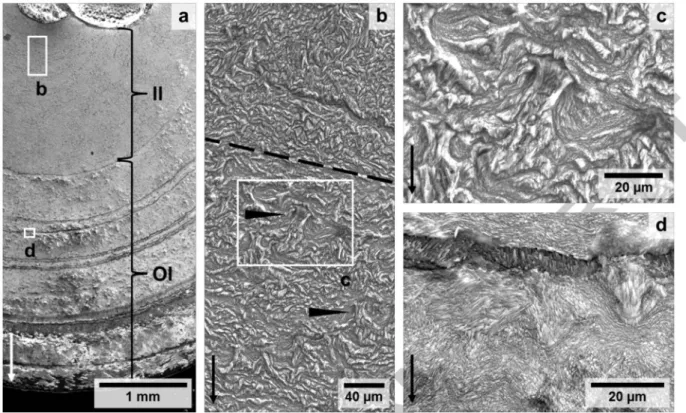
The etched sample surface shows concentric macroscopic bands, crystallite fascicles and microscopic mineralisation features of which the outer boundary forms a fan- or rivetlike shape (Figs. 3). The younger outer increment shows irregular banding while no growth banding is visible in the older inner increment. Etched bands resemble the optical properties of the unetched sample surface (Fig.
2). The centre and outermost layer contain smaller crystals than the remaining parts. Crystallites are generally flat in shape. The orientation of crystallite bundles is generally perpendicular to the growth direction but crosses it in various directions with a wavy microstructure (Fig. 3d). Micro-scale fan- shaped structures always widen in growth direction while the narrow part of the fan is located after a dark band on the secondary electron images. The arrangement of these fans (Fig. 4a) mirrors patches of optical opacity (Fig. 2) that occur between growth rings. The sizes of the fans are about 20 11m wide at their base 20 to 30 11m long. None of these fans can be observed in proximity to the dark bands in the 270 11m radius around the central axis in which also a finer less structured surface exists (Fig. 3b). In contrast, the remaining outer part of the inner increment does show fans.
3.2. Sample geochemistry
3.2.1. Mineralogy and organic matter distribution
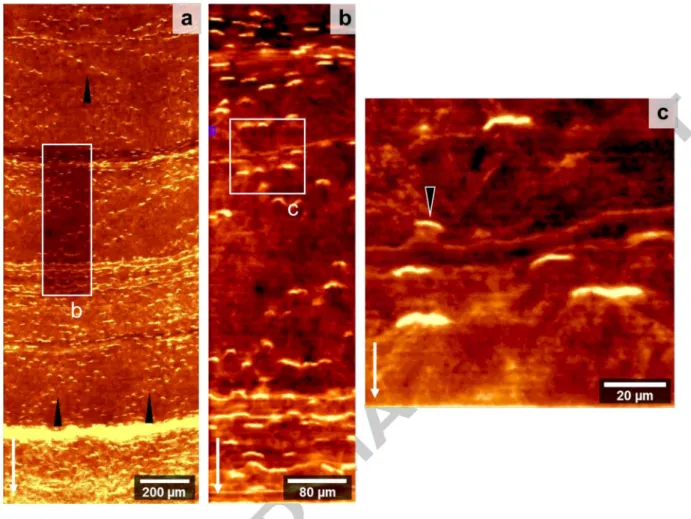
CRM measurements identify calcite as the only mineral phase present within the sample. The distribution of organic components (based on the fluorescence intensity images) can be seen from Fig. 4. The presence and absence of short organic bands in fluorescence resemble the pattern of inter-ring structures observed in visual opacity. The observed fluorescent bands are 20 - 80 11m in length and 1 - 2 11m in width and form step-like single or multiple row patterns (Fig. 4). The shape of these bands forms a wide U with the open part generally facing toward the growth direction.
3.2.2. Mg and S distribution
The EMPA scans resolve regular, non-stochastic growth patterns for Mg and S. The concentric banding (Fig. Sa & b) as well as the amount of data per analysed growth interval shown in Fig. Sc demonstrates that the observed Mg/Ca peaks are not random enrichments caused by measurement uncertainty. The counting statistics limit the precision of individual Mg and Ca data to about ± 7%
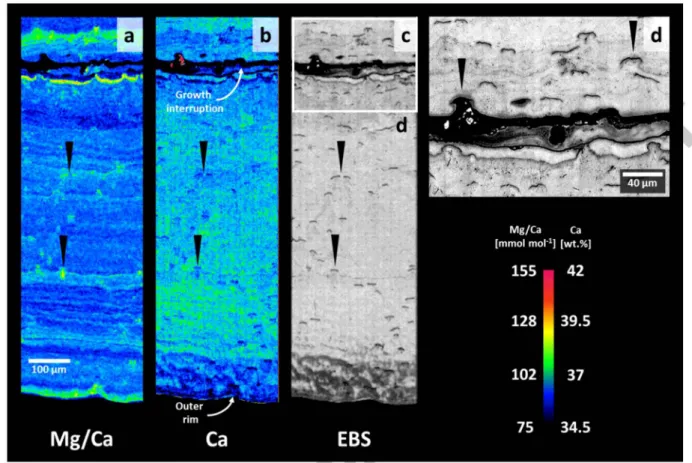
and ± 2% (± 1 SD) respectively at 111m resolution. Concentric Mg/Ca rings as well as granular Mg/Ca increases are visible (Fig. Sb). The Mg/Ca rings are clearly distinguished in the outer 2.6 mm of the section, but are not as clearly developed in the inner increment of the internode. No continuous rings in the range of tens of 11m (tl'ie expected annual growth rate) could be identified. In general, Mg/Ca decreases from the central axis to the outside of the internode. The greatest Mg/Ca decrease is observed in an about 0.4 mm wide band surrounding the central axis. Mg/Ca is roughly constant between 0.4 mm and 1.8 mm distance from the central axis, followed by a sharp decrease to another generally constant level. The location of this step-like change in Mg/Ca corresponds to the alteration in etched surface structure between what we define as the inner and outer increments (Figs. 2 & 3), with Mg/Ca ring patterns restricted to the outer increment. While Mg/Ca decreases from 130 to about 93 mmol mor1 in the inner increment, Mg/Ca is near constant at about 89 mmol mor1 in the outer increment. The total Mg/Ca range, excluding the innermost high Mg/Ca ring, is slightly less pronounced in the inner increment (26.8 mmol mor1) of the skeleton than in the outer increment (32.3 mmol mar\ Also, the Mg/Ca variability (± 2 SD) of the detrended increments is lower in the inner increment (7.7 mmol mor1) than in the outer increment (9.1 mmol mor1). The area of elevated Mg/Ca around the central axis coincides with the absence of fanlike structures observed by secondary electron imaging of the etched surface (Fig. 3b).
The high-resolution EMPA scan (111m spot size) of the outermost 1 mm of coral calcite shows well defined Mg/Ca growth rings that are sometimes disturbed by elongated features of high Mg/Ca ratios (Figs. Sb & 6a). These features always start at bands with low Ca content and low density
shown in the electron backscatter (EBS) images (Figs. 6b & c). The low-Ca bands observed here have the same size and shape as the ones imaged by Raman-spectroscopy (Fig. 4c). The detailed EBS scan shows that these short bands are the beginning of fans that widen always in growth direction. We also find fan-shaped cavities where the bands are located close to the concentric crack in the sample (Figs. 2 and 6d).
Mg and S show broadly opposite concentration distributions (Fig. 7). In particular, S/Ca is lower in the ring structures(< 10 mmol mor1) and the innermost part around the central axis(< 9 mmol mor1) of the coral section where Mg/Ca is higher (Fig. Sa). The inner increment shows a mean S/Ca value of 9.5 ± 1.7 mmol mor1 (± 2 SD) while the outer increment yields S/Ca=10.5 ± 2.9 mmol mor1 (± 2 SD).
Although an opposing behaviour is visible in Fig. 7a, the point-to-point correlation between Mg and S concentration is weak. The best fit using a non-polynomial equation can be found by using a power law relationship (R2 = 0.26, Fig. 7b).
3.2.3. Ba/Ca distribution
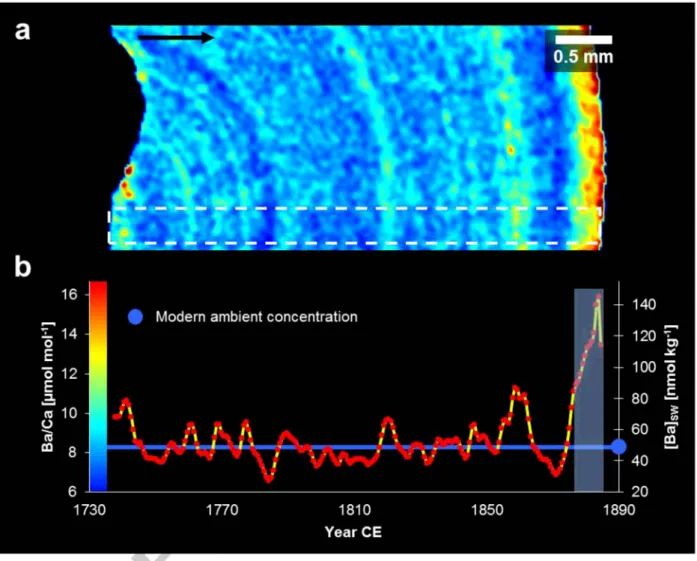
LA-ICPMS mapping shows concentric Ba/Ca banding over the whole sample section (Fig. 8). Following the growth direction on the sample section from the central axis to the outer rim, no secular trend for Ba/Ca is observed. Unlike S/Ca ana Mg/Ca, Ba/Ca does not show distinct behaviour surrounding the central axis and Ba/Ca is banded both in the inner and outer increments of the internode. A possible covariation between S/Ca, Mg/Ca and Ba/Ca was investigated using actual or interpolated data points positioned at equal distances from the rim. No similarities between the Ba/Ca and Mg/Ca or S/Ca spatial distribution on the sample section can be found (R2 < 0.01 and 0.15 respectively).
Ba/Ca is elevated in the outer 250 11m of the internode, with Ba/Ca values as high as 15.7 11mol mar\
while the mean Ba/Ca mean in the remaining part is 8.2 ± 1.9 11mol mor1 (± 2 SD). We applied a 40- point running mean to the Mg/Ca and S/Ca data before comparison, since Ca, Mg and S were measured with a spot size of 1 11m while Ba/Ca was measured with 35 11m spot size. In addition, we also considered signal smoothing by sample mixing in the laser ablation cell given by its wash out time. We evaluated this for Ba by measuring the time dropping from mean full signal intensity of
138Ba on NIST 610 to one percent of it after laser shut off. This drop happened in less than 1.8 seconds; which corresponds to a distance the laser moved of about 45 11m.
4. Discussion
In the following we will discuss the use of Mg/Ca as a potential high-resolution temperature proxy, the capability of Ba/Ca to reliably record [Ba]5w, and the limitations of both proxies in the bamboo
coral we investigated. We will present a recommendation which part of the skeleton should be included in an environmental reconstruction. Finally, a schematic model for the ontogenetic origin of the observed micro-fan structures will be provided.
4.1. Calcification temperature reconstruction
Assuming that bamboo coral internode Mg/Ca reflects growth temperature, we estimate bottom water temperatures using the calibration of Thresher et al. (2016) :
T CCC)= -23.9 (± 2.46)
+
0.34 (± 0.25)~:
(mmol moP) Eq. (2)The reconstructed bottom water temperatures (Fig. 5c) result in a mean of 7.5
oc
± 5.5oc
(± 2 SD) while exhibiting a generally decreasing trend from the central axis outwards within the inner increment, around a mean of 8.4 ± 2.8oc
(± 2 SD). The mean reconstructed temperature represented by the outer increment is 6.6 ± 3.6oc
(± 2 SD), where no trend can be observed. Based on the 14C age model (Section 2. 7), the pronounced step-like shift in the mean reconstructed temperature occurred around 1800 (between 1755 and 1820) (Fig. 5). In addition to the broad patterns between the outer and inner increment, short-interval total Mg/Ca variability corresponds to reconstructed temperatures ranging between 2 and 20oc.
This unrealistically large temperature range indicates the need for a detailed analysis of the investigated material before high-resolution reconstructions can be attempted.Before further statistical analysis of the reconstruction, two points must be addressed. First, we again note thavthe collection age of our specimen (1885) greatly predates any available hydrographic data.
Thus, our comparison between these reconstructed temperatures and modern hydrographic data is necessarily speculative. However, this comparison is still useful for illustrating how potential ontogenetic influences on Mg/Ca are manifest in temperature reconstructions. Second, some sections of the Mg/Ca data were excluded as shown in Fig. 5c. Similar to our observation, Thresher et al. (2007; 2010) and Sinclair et al. (2011) observed elevated Mg/Ca towards the centre of bamboo coral internodes. While anomalous geochemical behaviour near the central axis may relate to previous observations of amorphous calcium carbonate surrounding the central axis (Noe and Dullo, 2006; see Thresher et al., 2016), our specimen shows no amorphous calcium carbonate in the innermost part. This is indicated by the etched crystalline surface structure (Figs. 3a & b) and the
absence of a peak typical for this calcium carbonate polymorph in the CRM spectra, while an amorphous precursor of the skeletal HMC can neither be verified nor excluded with our measurements. We nevertheless exclude this portion of the skeleton from the temperature reconstruction because of the absence of fanlike structures suggesting a change in calcification mode in that part of the skeleton (see also Noe and Dullo, 2006). This distinct central part with elevated Mg/Ca will be discussed separately below in section 4.4. In addition to the central part, we excluded the band that showed a change in skeletal crystal structure (Fig. 3d), the material surrounding the growth interruption, the outermost rim and the high Mg/Ca fanlike structures (Fig. 6). All excluded regions showed anomalously elevated reconstructed temperatures of more than 15
oc.
Peaktemperatures of up to 20
oc
were recorded close to the central axis and in proximity to a concentric crack in the sample, which are unlikely to represent true ambient temperatures given modern temperatures of::::: 8°C (Section 2.2). Despite the exclusion of these four regions, we emphasize that these sub-sections comprise only a small fraction of the specimen and the vast majority of the coral section (88 %) was considered (Fig. 5c). The mean Mg/Ga of the outer increment does not significantly change (a= 0.05, t-test) when removing the mentioned regions.The mean reconstructed temperatures from the sample transect shown in Fig. 5c is 7 ± 3
oc
(± 2 SD).Although this is within uncertainty of the modern mean bottom water temperature at our sampling site of about 8
oc
(Lee and Waddell, 1983), a 1.5oc
warming of Florida Straits bottom water from 1900 to 2000 has been detected by Nagihara and Wang (2000) using borehole temperature measurements at the western margin of the Great Bahama Bank (Ocean Drilling Program Leg 166). If this warming trend is applicable to our coral specimen, then its Mg/Ca record appears slightly more favourable as a temperature proxy.Taken at face value, Mg/Ca in our bamboo coral specimen suggests a total temperature variability of up to 8
oc.
This exceeds the total temperature variability documented for the Blake Plateau (Lee and Waadell, 1983) by 4.1oc,
and from DWBC CTD casts spanning the years 2001- 2017 off Abaca Island by, 3.0oc.
One option is that the calibration of Thresher et al. (2016), which utilized bamboo coral specimens primarily originating from the southern hemisphere and included species other than Keratoisis grayi, is not appropriate for our specimen and/or for the high-resolution Mg/Ca mapping approach. Alternatively, the enhanced reconstructed temperature variability of our coral may not reflect calibration issues and instead may reflect physiological processes associated with octocoral growth. Aranha et al. (2014) documented similarly greater temperature variability recorded by skeletal Mg/Ca than in proximal instrumental measurements for Primnoa, another calcitic octocoral genus. A role for octocoral physiology in Mg/Ca is to some extent supported by findings from foraminifera despite expected differences in calcification, which for example leads to differential pH-regulation at the site of calcification in octocorals (e.g. Le Goff et al., 2017) and foraminifera (e.g. de Nooijer et al., 2009). Similar to bamboo corals, foraminifera build a calcite skeleton and do not exhibit distinct centres of calcification, as are observed in aragonitic scleractinian coral skeletons (Adkins et al., 2003). Large Mg/Ca variations have been observed by LA-ICPMS investigations in foraminifera (de Nooijer et al., 2014; Eggins et al., 2003; Hathorne et al., 2003; Hathorne et al., 2009;
Reichart et al., 2003; Sadekov et al., 2010; Spero et al., 2015), which may reflect light intensity (day/night cycles), calcifying reservoir depletion, the structural form of calcite, growth rate, authigenic surface coatings, and surficial as well as intra-shell organic matter. Although the majority of these factors cannot yet be considered for bamboo corals given the paucity of information on bamboo coral physiology, our fluorescence and S/Ca data provides some constraints on whether organic matter contributes to bamboo coral Mg/Ca variations.
Our EMPA analysis for Mg/Ca was performed without pre-treatment for organic matter removal (such as dissolution in ethylenediaminetetraacetic acid (EDTA) and centrifugation; Thresher et al.
(2016)). Thus, our measurements cannot distinguish between calcitic and organically bound Mg.
However, we discount a significant organic matter Mg contribution to this specimen because areas of enhanced fluorescence, which presumably represent increased organic matter contents, do not correspond to increased Mg; in fact, Mg and fluorescence appear to vary inversely (Fig. A.1). The inverse variation of Mg and Swill be discussed in detail in a separate section below.
While our data suggest that organic matter content does not principally drive Mg/Ca variations in this bamboo coral specimen, given the high variability of reconstructed temperatures found above we recommend to further evaluate the comparability of bulk skeletal Mg/Ca calibrations with high- resolution reconstructions from single specimens. Ideally, modern high-resolution bamboo coral Mg/Ca records should be compared to modern oceanographic temperature records; this would reduce uncertainty from our comparison of Mg/Ca in a ::::: 140 year old coral with modern temperatures. Another option would be to compare reconstructed temperature records of other local calcifiers-for which well-established temperature proxies exist-with a bamboo coral Mg/Ca record grown in proximity to the sampling site. The reconstruction could be done with, e.g., Li/Mg (Montagna et al., 2014) or
o
88186Sr (Ruggeberg et al., 2008) in scleractinian corals oro
180shell inbivalves (e.g. Schone et al., 2005). In addition, a comparison with another bamboo coral specimen of the same species and location is recommended to investigate the internal variability of the chemical composition (e.g., Thresher et al., 2007; 2010). Without any of these measures, a specimen-specific physiological non-linear response to temperature variation cannot be ruled out. Because of the low radial growth rate of bamboo corals, "core top" studies on live-collected coral skeletons as done by e.g. Thresher et al. (2016) may offer a more practical option than long time culturing experiments. An
improvement of the existing calibration might be realised by restricting the sampling area to the most recently grown material.
4.2. Potential Infilling
The innermost 440 11m of the Mg/Ca data were excluded from the temperature considerations due to their high ratios leading to unrealistic bottom water temperatures. Several investigations mentioned a potential secondary infilling around the central axis in bamboo corals as an explanation for observed geochemical features in this region. Noe and Dullo (2006) found what they called amorphous calcite. Further, Sinclair et al. (2011) and Thresher et al. (2010) found a central increase in Mg/Ca. Radiocarbon (Farmer et al., 2015b; Thresher et al., 2016) and 210Pb-based (Andrews et al., 2009; Tracey et al., 2007) investigations of growth rate report dates that are younger by the central axis than the surrounding, presumably ontogenetically younger calcite. The combination of anomalous dates and geochemical signatures led Farmer et al., 2015b and Thresher et al., 2016 to conclude that the material surrounding the central axis may be precipitated after the initial internodal skeleton was built in some specimens, although it should be noted that this feature is not shared among all bamboo coral specimens (Andrews et al., 2009; Farmer et al., 2015b; Thresher et al., 2004; Thresher et al., 2010).
In addition to the infilling hypothesis, theoretical considerations and our experimental findings allow another explanation. We suggest that the observed feature might be a growth rate artefact. This is based on the gradual rather than abrupt shift in Mg/Ca around the central axis (Fig. Sc) accompanied with no major change in the crystallite structure in that part (Fig. 3b). If secondary infilling were present, we would rather expect a sharp contrast in composition and crystallite structure between the infilled and the primary material, which is not the case. In order to create the observed pattern of gradual change, the precipitation would have to start at exactly the same Mg/Ca as the skeleton and then successively change towards a different composition, which seems unreasonable. Further, to the best of our knowledge there is no study published that describes living tissue in the central axis, while Alderslade and Mcfadden (2012) reported it to be filled with a transparent gelatinous material in a specimen of the bamboo coral subfamily Keratoisidinae. Given that no living coral tissue occupies the central axis, the infilling is highly unlikely to be actively produced by coral tissue. In that case the ions required for the precipitation of infilled calcite would need to be transported to the precipitation site through pores or channels in the nodes or internodes of this species, which were also not reported. To our knowledge, it has not yet been studied whether nodes seal the internodal axis or allow fluids to be exchanged. A strong argument against potential infilling is given by the
observed chamber-forming walls across the central axis of the lsidid sub-family Keratoisididae (Aiderslade and Mcfadden, 2012; Tracey et al., 2007). These walls would prevent mass transfer between chambers along the central axis and with that the supply of ions for precipitation of the secondary infilling.
Another way to test whether infilling occurs during specimen growth is to investigate the diameter of the internodes' central axis at different life stages of the animal. Tracey et al. (2007) observed an increase in diameter of the central axis towards the younger internodes for the bamboo coral genera Keratoisis and Lepidisis, which supports potential infilling with time. However, Alderslade and Mcfadden (2012) observe a progressive decrease in central axis diameter towards the younger internodes in the genus of lsidella. One explanation given by Tracey et al. (2007) for the increase was that it allows the growing coral to sway in the current to catch food particles. This does not necessarily imply that the diameter is changed after the internode was formed. It might be possible that new internodes are already initially built with a larger diameter of the central axis. To summarize, divergent observations of trends for central axis diameter along the main growth axis does not conclusively support or refute the infilling hypothesis.
A higher growth rate around the central axis auld favour higher Mg/Ca through enhanced Mg partitioning at higher calcite precipitation rates. For example, such an effect was observed in bamboo corals in a subset of the investigated samples of Thresher et al. (2016), and by measurements on coralline red algae conducted by Sletten et al. (2017), which contrasts with discrimination against Mg incorporation at higher precipit--ation rates in inorganic precipitation experiments (e.g. Gabitov et al., 2014). Further, high precipitation rates surrounding the central axis may explain patterns of reduced 6180 and
o
13C in the calcite surrounding the central axis of bamboo corals (Hill et al., 2011) through kinetic fractionation. We note that Hill et al. (2011) could not relate 14C-derived growth rates to 6180 ando
13C fractionation; however these growth rates are constrained by relatively few data points and do not necessarily preclude higher growth rates in a small skeletal domain surrounding the central axis. Higher growth rates during early growth explain the anomalously young 14C dates found near the central axis by Farmer et al. (2015b) and Thresher et al. (2016) through two mechanisms. First, it should be noted that central axis 14C dates are typically not significantly younger than surrounding dates (given the uncertainty of several decades on 14C measurements), but rather fall within uncertainty of surrounding dates (Farmer et al., 2015b; Thresher, 2009) and thus do not exclude high growth rates near the central axis. According to the available 14C data a linear growth rate was assumed but the uncertainty and resolution of the data can obviously not exclude small-scale nonlinear growth rates. Second, the 14C deviations near the central axis could reflect increased incorporation of respired C02 during rapid skeletal formation, which is presumably younger thanambient seawater DIC that is otherwise used for bamboo coral calcification (Farmer et al., 2015b;
Roark, 2005 and others). Although we cannot yet fully resolve whether the cause of the central anomaly is secondary infilling or a physiological process during early skeletal formation, we favour a physiological explanation given the gradual change in Mg/Ca alongside the distinct microstructural texture (Fig. 3) in the innermost part of our studied bamboo coral specimen. Further investigations on a larger set of adjacently grown bamboo corals and from multiple internodes of the same specimen would allow to shed more light on the observed feature.
4.3. Mg- and Ba-S relationship
Our EMPA results reveal a weak inverse relation of Mg to the distribution of S (Fig. 7), in agreement with earlier reports for the calcitic octocoral genus Corallium (Nguyen et al., 2014; Vielzeuf et al., 2013). Although we initially aimed to use S as an indicator of organic matter, its distribution turned out not to be related to organic content as indicated by comparison with CRM data. Instead, the S concentration seems to be inversely connected to processes driving the incorporation of Mg into the skeleton. Although elemental abundances show an inverse relation, the apparent correlation is not linear. The observed Mg/S relationship could be related to temperature or skeletal growth rate effects. We propose a temperature effect, since the skeletal Mg content seems to be mainly influenced by ambient seawater temperature and a growth rate effect, since the innermost part showing a Mg anomaly is assumed to grow faster. Furthermore, the incorporation of S has been linked to additional parameters. Based on infrared spectroscopy studies, it was found that S appears to substitute as sulfate for carbonate in the calcite lattice in bamboo coral internodes (Balan et al., 2017). These authors therefore postulated the ability of S in bamboo corals to record the sulfate concentrations in seawater. Also, an interaction between skeletal growth rate, carbonate ion concentration in the calcifying fluid and its reducing impact on the activity of sulfate ions was suggested by Nguyen et al. (2014) for the octocoral species Paracorallium japonicum. These authors found lower sulfur concentrations in skeletal portions secreted during warm seasons when the coral was growing fast. We speculate that the observed inverse correlation of Mg and S is related to growth rate; however this suggestion requires higher-resolution growth rate estimates than are currently available from 14C.
The different spatial distributions of Ba/Ca and S/Ca in the sample transect suggest that the incorporation of Ba and S may not be coupled. A dominant control on Ba/S by barite (BaS04 ) can be excluded for stoichiometric reasons, given the large difference in mean skeletal concentration of Ba (::::: 8 11mol mor1) and S (::::: 9000 11mol mor1). However, since the cause(s) of elemental variation in
bamboo coral skeletons (especially for S) are poorly studied, further investigations on the environmental and physiological factors influencing Mg, Ba, and S incorporation into the skeleton are needed.
4.4. [Ba]sw reconstruction from Ba/Ca mapping
Ba concentrations in seawater can be estimated by applying the equation of LaVigne et al. (2011):
Ba
_
1 _ Ca (!J.mol moP)- 4.205 (± 0.870) [Ba]5w(nmol kg ) - 0_079 (± 0.00
8) Eq. (4)
The reconstruction of [Ba]5w (Fig. 8b) is linearly related to Ba/Ca. [Ba]5w exhibits a mean value of 54± 37 nmol kg-1 (± 2 SD) with a maximum 145.3 nmol kg"1 close to the rim.
For further detailed discussion on the reconstructed concentrations we restricted the dataset.
LaVigne et al. (2011) used only the youngest outermost part of the skeleton for their calibration, allowing a comparison with recent instrumental [Ba]5w measurements. Our Ba/Ca data should be directly comparable to LaVigne et al. (2011) since both studies used unbleached bulk carbonate. In contrast, Thresher et al. (2016) excluded the innermost juvenile skeletal part from their calibration due to significantly elevated values, which were also found by Sinclair et al. (2011). However, we could not find any unusual values within this region but instead exclude the elevated values in the outer 250 11m (Fig. 8). Although the high Ba/Ca ratio found close to the rim might be a primary signal, these ratios are more likely an artefact of long-time storage in ethanol. For instance, Strzepek et al.
(2014) found that 13 months of storage in ethanol elevated the Ba/Ca ratio of bamboo coral samples by ::::: 8 %, though the influence found was small and might have been related to a simple offset caused by the applied LA-ICPMS method. Nevertheless, Strzepek et al. (2014) proposed that Ba had leached from the nodes and subsequently deposited on the internodes. The authors, however, provided no measure for the identification of potentially contaminated or altered material except by a higher Ba/Ca itself. LaVigne et al. (2011) did not mention whether their samples were stored in a preservative after sampling as our sample was. Since we cannot exclude a storage artefact as suggested by the latter we refrain from interpreting the elevated Ba/Ca data of the outer 250 11m.
From the remaining data we estimate a mean [Ba]sw for the coral's habitat of 50± 24 nmol kg-1 (±2 SD).
Evaluating our reconstructed [Ba]5w value with modern hydrographic data is hampered by the lack of data availability at the sampling region and water depth. However, we can approximate modern [Ba]sw with data from GEOTRACES section GA03 at around 800 mat 38.7" Nand 69.1° W (Mawji et al., 2015). Though this is about 1300 km northeast of our sampling site, given the residence time of Ba in seawater on the order of about 10,000 years (Chan et al., 1976), the reported concentration of 48 nmol kg-1 is assumed to be representative for a broad region, including the sampling site. Our reconstructed mean estimate of 50± 24 nmol kg-1 (± 2 SD), is in good agreement with the modern regional concentration. Since short term temporal variability of [Ba]5w is unknown from hyarographic data, we compare the variance with [Ba]5w from other oceanic regions. The total variability of our sample of [Ba]sw (27 - 89 nmol kg-1) is larger than the range observed available in the GEOTRACES dataset between 80 and 60
ow
in the upper 2000 m of the North Atlantic (i.e. [Ba]sw = 42- 58 nmol kg-1) (Mawji et al., 2015). Since the reconstructed values exceed the range of recent oceanic concentrations, an influence of factors other than [Ba]5w on the skeletal Ba/Ca composition cannot be excluded.We compared our Ba/Ca data with a record reported by Sinclair et al. (2011) from a bamboo coral sample from the Jacksonville Lithoherms, collected at 549 m depth about 40 km west of our sample location (Fig. lb). While the reconstructed nutrient concentrations of our Florida Strait coral agree better with ambient [Ba]5w than Sinclair's Jacksonville Lithoherms sample, both data sets display a similar degree of variability. Sinclair et al. (2011) measured a mean skeletal Ba/Ca ratio of 12 ± 2 11mol mor1 (± 2 SD), which, using equations 3, translates to 102 ±51 nmol kg-1 (± 2 SD) [Ba]5w.
Our values are with a mean of about 8 11mol mor1 nearly 30% lower than the values reported for the Jacksonville Lithoherms specimen. A reason for the offset could be related to the growth of their coral closer to the shelf break, and some 250 m shallower than our specimen. At the eastern continental margin of Florida, ground water is in contact with seawater until a water depth of at least SOD m (e.g. Hathaway et al., 1979; Kohout, 1965; Manheim and Pauli, 1982). It is known that groundwater aquifers are enriched in adsorbed Ba which can be released by salt water intrusions (Shaw et al., 1998). We therefore speculate that the Sinclair sample may have been influenced by Ba leached from the Floridan limestone aquifer, leading to higher skeletal Ba/Ca values in their sample.
The growth site of our sample might not have been affected by Ba-enriched seawater from this aquifer because of its greater depth of 805 m. Another reason for the observed offset could be that Sinclair et al. (2011) focused on the reproducibility of the measured Ba/Ca trends and not on their accuracy. Further could differing instrumental set ups and operational conditions have led to differing matrix effects. Hence, although the difference in mean Ba/Ca values of the samples may be due to a systematic measurement offset, the relative difference in estimated ambient water [Ba]5w could equally represent an environmental signal.
Our data show that skeletal Ba/Ca relates to mean ambient [Ba]5w levels. Our estimates are in good agreement with recent ambient instrumental values, supporting the use of bamboo corals as potential archives of ambient [Ba]5w levels over timescales of decades. The observed concentric Ba/Ca variation in our octocoral allows us to verify that the chosen sample transect for reconstruction is a representative selection on the sample section. This also resulted in an increase of statistical precision of the reconstructed [Ba]5w by being able to pool several data points for reconstruction. For a better understanding of the duration and timing of past concentration changes, a high-resolution chronology is important. The variation of our [Ba]5w estimates cannot currently be evaluated in the light of actual environmental changes due to the age of our specimen and a lack of hydrographic [Ba]5w time series. Though high-resolution LA-ICPMS sa piing of skeletal Ba/Ca is a promising tool to understand short term variability in [Ba]5w, further work on the potential impact of physiological processes on the Ba incorporation into bamboo corals is required. A future comparison of modern hydrographic [Ba]5w and Ba/Ca reconstructions from modern bamboo corals may better elucidate these potential impacts.
4.5. Ontogenetic limitations and growth model
One potential cause of variation expressed in isolated high-Mg/Ca features might be growth rate effects similar to those seen near the central axis, where Mg/Ca is most elevated. As shown by CRM- and EBS-imaging, high-Mg/Ca features always initiate at a short organic band from which a fan- or rivet-shaped feature develops (Figs. 3, 4, & 6). Fan-shaped or spherical arrangement of needle-like crystals so-called spherulitic structures which are typically associated with fast crystallite growth are ubiquitous in biogenic carbonates (e.g. Barnes, 1970; Cohen and McConnaughey, 2003). It must be pointed out that we use the term "fan-shaped" here as reference to the external shape only, not the internal crystallite arrangement which could not be investigated with the applied techniques.
Noe et al. (2007) describe fanlike crystallite arrangements in isidid skeletons which they call interfingering fascicles. We want to emphasise that these structures describe the bulk material around the here described fan-shapes but not the fans themselves. Calcite fans called loculi have been found e.g. in the octoral genus Plexaurella (e.g. Bond et al., 2005; Lewis et al., 1992). Loculi are the only calcified parts of Plexaurella's otherwise organic skeleton which together with the shape of loculi seem to be a weak match to the features discussed here. More similar fan-shaped structures regarding surrounding skeletal material and shape are those embedded in the spherulitic crystal bundles described in calcitic sea fans (Ledger and Franc, 1978), but their origin has not yet been determined. Here we suggest a bamboo coral growth model that focuses on desmocytes, which are
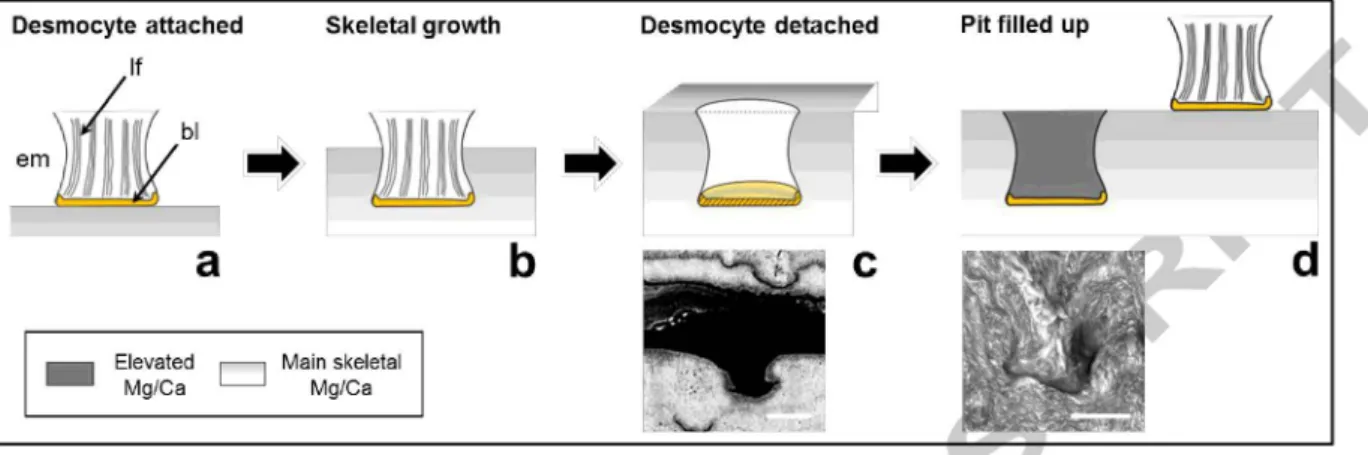
special cells observed in all three classes of cnidarian, and which connect the coral tissue to its calcareous skeleton (Muscatine et al., 1997). While Chapman (1969) suggested a development model of a desmocyte during growth in cnidarians, the authors did not focus on the carbonate skeleton in their model. Following these earlier observations, we propose a growth mechanism (Fig. 9) capable of explaining the observed chemical and morphological features of these fans.
Desmocytes link the coral tissue with the organic matrix of the skeleton via rod-like structures called fibrils and a basal lamina (Muscatine et al., 1997). While being attached to the skeletal surface, we infer that calcification occurs around the attached desmocyte. The surface of (dead) lsidid coral skeletons of the genus Orstomisis shows pits with diameters of about 50 11m (B yer, 1990). Similar pits have also been shown for several genera like e.g. Mopsea or Oparinisis in the family of lsididae (Aiderslade, 1998). Although similar features have not yet been reported in lsidids of genus Keratoisis, the basal diameters of these pits are within the length range of the observed low-Ca and high-fluorescence bands of the analysed Keratoisis sample (Figs. 4 & 6d). We propose that the observed bands are remains of the basal lamina and therefore represent sections of a three- dimensional cup-shaped structure. These structures could be left behind after calcification around the desmocyte reached a certain height (Fig. 9b) and the desmocyte is then detached by lowering the adhesion (Fig. 9c) (Muscatine et al., 1997). After detachment of the desmocyte the pit needs to be filled (Fig. 9d). As suggested by ou fluorescence data (Fig. 4) and also by transmission electron microscopy images of stained and decalcified thin sections of a scleractinian coral (Goldberg, 2001), calcareous infilling of the attachment scar appears to incorporate remains of the organic basal lamina at its base. Alternatively, it was also suggested that desmocytes as a whole become mineralised into the skeleton (Musca~e et al., 1997). However, since fluorescence mapping shows only a thin bright band instead of a bright fanlike structure (Fig. 4), our geochemical data do not indicate the presence of an organic structure at this site and instead support the concept of desmocyte detachment proposed by Muscatine et al. (1997) for the scleractinian coral Stylophora pistillata. While we observed fanlike features in the majority of the skeleton, these are absent in the central-most part around the central axis. This is consistent with independent observations of fewer and less ordered desmocytes in fast growing areas of the scleractinian coral Stylophora pistillata (Tambutte et al., 2007). Also, Clade and Marshall (2002) suggest that since scleractinian desmocytes are not involved in the calcification process, they would not be present in high density in regions of fast calcification.
Importantly, fanlike features are absent from the central region of elevated Mg/Ca ratios in our specimen (Fig. 3b), and we suggest that elevated growth rates in this area may cause elevated Mg/Ca.
As already mentioned by others (e.g. Thresher et al. (2010), see also section 4.2 above), specimens were found in which the central growth axis of bamboo corals seems to be mineralised in a different way than the remaining part of the skeleton. For example, Farmer et al. (2015a) found an elevated boron isotopic composition and related it to ontogenetic variability in calcification rate. A different mode of growth was suggested by Sinclair et al. (2011) based on Ba and Mg anomalies around the central axis of a bamboo coral. Our sample does not show a Ba/Ca anomaly in this region, although we found the lowest S concentrations of the sample there. Whatever the cause of the change in mineralisation is, our geochemical data suggest that the absence of fanlike structures (Fig. 3b) serves as one indicator for which parts of a bamboo coral should be avoided for Mg/Ca-temperature reconstructions. It has to be emphasized that in skeletal parts containing these structures only the material surrounding the fanlike structures should be used since the structures themselves show an elevated Mg/Ca. In addition, we suggest that the fanlike structures may reflect desmocyte attachment throughout individual sample sections. Further investigations of the fan ultrastructure using scanning electron microscopy (SEM) with gold coated etched samples, ion microprobe (NanoSIMS) for elemental mapping or polarized microscopy of thin sections would be helpful to gain a more detailed view on their internal structure and formation mechanism.
5. Conclusion
Our data suggest that integrated Mg/Ca ratios in bamboo corals faithfully record mean growth temperature, whereas integrated Ba/Ca ratios reflect [Ba]5w. However, we advise caution in interpreting high-resolution time series until reliable long-term time series information of these parameters becomes available for comparison to skeletal bamboo coral records. The reconstructed variability for all environmental parameters is larger than predicted from known recent environmental variations. This geochemical variability is most clearly expressed in isolated high- Mg/Ca skeletal features, which appear to be formed by rapid infilling of detached desmocyte spaces during biomineralisation, and a high Mg/Ca feature surrounding the central axis. The latter was not associated with anomalous Ba/Ca values. There is evidence that at least the Mg/Ca anomalies are related to locally elevated growth rates. To further improve existing calibrations for temperature and nutrient levels, we suggest to investigate the influence of growth rate and organic content on the incorporation of Mg and Ba into the skeleton of bamboo corals. In concert with a finely resolved chronology, this could lead to establish bamboo corals as high-resolution archives of ambient temperature and [Ba]5w. The presented data emphasise the advantage of elemental mapping compared to point or line scans by allowing for choosing representative sections on the sample and improving statistical precision by pooling data. Further we show that bamboo coral skeletons exhibit
isolated ontogenetic features that are geochemically distinct and can therefore be excluded for paleoenvironmental reconstructions. Although we found potential limitations for high-resolution environmental reconstruction on bamboo corals, these marine calcifiers remain promising candidates to serve as paleoenvironmental archives in the deeper ocean. Future studies on further specimens are needed to generalise our findings.
Acknowledgments
We thank Mario Thi:iner for help with the EMPA, Philip Alderslade, Jean-Pierre Cuif, Christopher Meinen, Dirk Nurnberg, and Rainer Zantopp for helpful discuss'ions. he CTD data from east of the Bahamas are made freely available on the Atlantic Oceanographic and Meteorological Laboratory web page (www.aoml.noaa.gov/phod/wbts/) and are funded by the DOC-NOAA Climate Program Office-Ocean Observing and Monitoring Division. Funding was provided through the Helmholtz Research School on Ocean System Science and Tecnnology and GEOMAR Helmholtz Centre for Ocean Research Kiel to S.F. Insightful and constructive reviews from three anonymous reviewers improved an earlier version of the manuscript. The associate editor Tom Marchitto is acknowledged for editorial handling and further constructive criticism. The data presented in this study are also available in digital format at www.pangaea.de.