1. Introduction
Permafrost in northern latitude ecosystems is becoming increasingly susceptible to climate warming, with strong implications for changes in carbon (C) cycling (Biskaborn et al., 2019; Bush and Lemmen 2019).
Much of the surface permafrost temperature in interior Alaska is just below the freezing point of water (Romanovsky et al., 2010), such that it is nearing a phase change. Models predict that interior Alaska, south- ern Canada, and southern Siberia will experience widespread loss of surface permafrost (top 1–2 m) this century (Schaefer et al., 2011), vastly transforming ecosystems and disturbance regimes (Lara et al., 2016).
This prediction is also significant because permafrost soils contain large quantities of C that could be re- leased as CO2 or CH4 to the atmosphere, thereby creating a positive feedback to climate warming (McGuire
Abstract
Permafrost thaw in northern ecosystems may cause large quantities of carbon (C) to move from soil to atmospheric pools. Because soil microbial communities play a critical role in regulating C fluxes from soils, we examined microbial activity and greenhouse gas production soon after permafrost thaw and ground collapse (into collapse-scar bogs), relative to the permafrost plateau or older thaw features. Using multiple field and laboratory-based assays at a field site in interior Alaska, we show that the youngest collapse-scar bog had the highest CH4 production potential from soil incubations, and, based upon temporal changes in porewater concentrations and 13C-CH4 and 13C-CO2, had greater summer in situ rates of respiration, methanogenesis, and surface CH4 oxidation. These patterns could be explained by greater C and N availability in the young bog, while alternative terminal electron accepting processes did not play a significant role. Field diffusive CH4 fluxes from the young bog were 4.1 times greater in the shoulder season and 1.7–7.2 times greater in winter relative to older bogs, but not during summer. Greater relative CH4 flux rates in the shoulder season and winter could be due to reduced CH4 oxidation relative to summer, magnifying the importance of differences in production. Both the permafrost plateau and collapse-scar bogs were sources of C to the atmosphere due in large part to winter C fluxes. In collapse scar bogs, winter is a critical period when differences in thermokarst age translates to differences in surface fluxes.Plain Language Summary
Permafrost thaw is occurring in Alaska which may result in a positive feedback to climate warming, due to the release of greenhouse gases such as CO2 and CH4 from soils. Here we examined greenhouse gas production along a gradient of “time since thaw,” hypothesizing that fluxes and microbial activities would be highest soon after thaw, and then decline. We observed highest rates of microbial activities, particularly methanogenesis, soon after thaw, coinciding with less decomposed organic matter and higher concentrations of dissolved carbon and nitrogen in soil, possibly of permafrost origin. However, field fluxes were higher in the young thaw site, compared to the older sites, in winter and not summer, a phenomenon that is currently not well understood.© 2021 American Geophysical Union.
This article has been contributed to by US Government employees and their work is in the public domain in the USA.
M. P. Waldrop1 , J. W. McFarland1 , K. L. Manies1 , M. C. Leewis1 , S. J. Blazewicz1,2 , M. C. Jones3 , R. B. Neumann4 , J. K. Keller5, L. Cohen6 , E. S. Euskirchen6 ,
C. Edgar6 , M. R. Turetsky7,8 , and W.L. Cable9,10
1Geology, Minerals, Energy, and Geophysics Science Center, U.S. Geological Survey, Menlo Park, CA, USA, 2Physical and Life Sciences Directorate, Lawrence Livermore National Laboratory, Livermore, CA, USA, 3Florence Bascom Geoscience Center, U.S. Geological Survey, Reston, VA, USA, 4Department of Civil and Environmental Engineering, University of Washington, Seattle, WA, USA, 5Schmid College of Science and Technology, Chapman University, Orange, CA, USA, 6Institute of Arctic Biology, University of Alaska Fairbanks, Fairbanks, AK, USA, 7Department of Integrative Biology, University of Guelph, Guelph, Canada, 8Institute of Arctic and Alpine Research, University of Colorado, Boulder, CO, USA, 9Geophysical Institute, University of Alaska Fairbanks, Fairbanks, AK, USA, 10Alfred Wegener Institute, Helmholtz Centre for Polar and Marine Research, Potsdam, Germany
Key Points:
• Permafrost thaw chronosequence shows methanogenic activity highest soon after thaw and then declines over decades
• Greater methanogenic activity in young collapse scar bogs results in higher winter, but not summer, fluxes
• Increased methanogenic activity is plausibly tied to increased dissolved organic carbon and nitrogen in young collapse scar bog soils
Supporting Information:
• Supporting Information S1
Correspondence to:
M. P. Waldrop, mwaldrop@usgs.gov
Citation:
Waldrop, M. P., McFarland, J.
W., Manies, K. L., Leewis, M. C., Blazewicz, S. J., Jones, M. C., et al.
(2021). Carbon fluxes and microbial activities from boreal peatlands experiencing permafrost thaw. Journal of Geophysical Research: Biogeosciences, 126, e2020JG005869. https://doi.
org/10.1029/2020JG005869 Received 30 MAY 2020 Accepted 31 JAN 2021
et al., 2018; Schuur et al., 2015; Turetsky et al., 2019). RCP 8.5 projections indicate that through the year 2300 thawing permafrost could release 200 Pg C through active layer thickening and another 100 Pg of C through abrupt thaw resulting from ground collapse and the formation of collapse-scar bogs and fens (McGuire et al., 2018; Turetsky et al., 2019).
Northern peatlands have been C sinks for thousands of years, due to the low rates of decomposition in cold, mostly anaerobic soils (Frolking & Roulet, 2007). Recently, however, studies of syngenetic permafrost peatlands (i.e., peatlands that accumulated peat simultaneous with permafrost aggradation) have pointed to large rapid losses of deep soil C following thaw (Johnston et al., 2014; Jones et al., 2016; O'Donnell et al., 2012). These studies occurred where postthaw subsidence resulted in inundation and the formation of col- lapse-scar bogs (Lara et al., 2016). After thaw, between 25 and 50 kg m−2 of the permafrost C was decom- posed in the first several decades to a century. Losses of permafrost C outweighed the accumulation of new C from peat growth for many decades, only establishing net C accumulation after centuries to millennia (Johnston et al., 2014; Jones et al., 2016; O'Donnell et al., 2012).
To sustain large losses of soil organic carbon (SOC) following permafrost thaw, microbial activities would have to be stimulated to substantially increase rates of CO2 and CH4. Field, model, and laboratory incu- bation data can be used to estimate rates of CO2 and CH4 fluxes needed to approximate the large C losses measured in soil cores (Schuur et al., 2009, 2015). The aerobic and anaerobic microbial respiration that drive these fluxes respond primarily to soil temperature and the availability of electron acceptors. Electron acceptors such as nitrate, sulfate, Fe(III), and organic terminal electron acceptors and electron donors, such as organic carbon (OC), could stimulate microbial activity in a young collapse-scar bogs if they are released from the permafrost into the new active layer (Keller et al., 2009).
To examine changes in C fluxes and microbial activities, we studied a permafrost plateau and three col- lapse-scar bogs that differed in “time since thaw.” We hypothesized that we would observe net losses of C and greater microbial activities (respiration, terminal electron accepting processes, enzyme activities) soon after thaw and that losses and activities would decline in older thaw features. We also examined whether these patterns were coincident with changing chemistry of postthaw soils (availability of terminal electron acceptors, dissolved OC and nutrients, and soil organic matter).
2. Materials and Methods
2.1. Site Description
The experiment was conducted at the Alaska Peatland Experiment (APEX) site within the Bonanza Creek Experimental Forest, approximately 30 km southwest of Fairbanks. This site is a boreal lowland containing a mixture of bogs, fens, and black spruce (Picea mariana) peatlands. The black spruce peatland plateaus are underlain by permafrost, while the collapse-scar bogs have a wetter surface and are dominated by mosses (primarily Sphagnum spp.) and sedges (Carex spp.). When the peat plateau thaws, the ecosystem transitions to collapse-scar bogs through thermokarst ground subsidence. Therefore, all collapse-scar bogs had sunken surfaces relative to the surrounding permafrost plateaus. Collapse-scar bogs typically occur as internal fea- tures within the larger frozen plateaus (Camill, 1999).
Collapse-scar bogs were selected based on size (assuming younger bogs are smaller), overflight photography (to identify bogs that previously had established forest cover), and plant community composition (younger bogs would have more sedge cover and standing dead trees while older bogs would have a small woody plants and no standing dead trees). Three different collapse-scar bogs were chosen based on these criteria as well as the adjacent permafrost plateau. The collapse scar bogs were termed “young,” “intermediate,”
and “old” based on their assumed ages. Permafrost plateau plots were located within 20 m of the edge of the young collapse scar bog. Macrofossil dating indicates that the old collapse-scar bogs began thawing and expanding 140 years before sampling. Both the young bog and intermediate bogs began to thaw within the past 50–75 years. However, the young bog only began to expand in the last 2 decades, while the interme- diate bog has been slowly expanding throughout this time (methods information below). For all sites, peat initiation ages began between 1,500–2,500 ybp and the permafrost aggraded at the end of the Little Ice Age.
Ice structures within the mineral soil suggest this permafrost is quasisyngenetic, a form of epigenetic per- mafrost (Mikhail Kanevskiy, personal communication).
Plant community composition (% cover) was visually assessed in four replicate 60 × 60 cm plots per site.
The understory vegetation of the permafrost plateau included big red stem moss (Pleurozium schreberi) with an understory dominated by bog blueberry (Vaccinium uliginosum), bog cranberry (Vaccinium vitis-idaea), cloudberry (Rubus chamaemorus) and Labrador tea (Ledum decumbens). Overstory was 70% black spruce, 26% tamarack (Larix laricina), and 4% willow (Salix sp). The young collapse-scar bog was dominated by Sphagnum spp, cotton grass (Eriophorum vaginatum), water sedge (Carex aquatilus), and creeping sedge (Carex chordorrhiza). The intermediate collapse-scar bog contained similar species as the young bog, but also included greater coverage of bog rosemary (Andromeda polifolia). The “old” collapse-scar bog also con- tained bog rosemary, tamarack, bog birch (Betula glandulosa), and some black spruce seedlings (Figure S1).
The number of Carex stems per square meter was significantly greater in the young bog (175 ± 38) compared to the intermediate bog (99 ± 26), old bog (64 ± 16), or peat plateau (63 ± 14) (mean ± s.e., p < 0.0001).
2.2. Soil Coring
Between 2011 and 2015 we cored the permafrost plateau and each bog (n = 2 to 5) to determine the date of thaw. We used a combination of a Snow, Ice, and Permafrost Research Establishment (SIPRE) corer (Rand
& Mellor, 1985) to sample frozen soils and a “frozen finger” to sample unfrozen bog soil. The “frozen finger”
is a thin-walled, hollow aluminum tube (∼6.5 cm diameter), sealed at one end, which was inserted into peat through to mineral soil. A slurry of dry ice and ethanol was poured into the corer, freezing peat material surrounding the corer to the outside of the barrel. The frozen finger, with the surrounding peat frozen to the outside, was removed and scraped with a clean metal spatula to remove any large roots or stuck foreign ma- terial. Core was subsampled every 2 cm and frozen. Plant macrofossils were used as evidence for transitions from permafrost plateau to collapse-scar bog (Jones et al., 2016). Two cc of sample was washed through a 250 µm screen using deionized water and examined under a microscope for changes in plant material in- dicative of bog, permafrost forest, or fen. Macrofossil 14C was run at Livermore National Laboratory Center for Mass Spectrometry (CAMS) or at Beta Analytic (Miami, FL) to estimate the age of transitions. Manies et. al (2017) describes additional sampling information.
Bog cores for microbial incubations were taken in summer 2014 when soils were thawed. In each bog, we collected three sets of three cores with a 4 cm diameter steel core barrel with cutting edge, which was slowly pushed into the bog while spinning until it reached c. 10 cm into the mineral soil. Each set of three cores, taken within close proximity, were split into four horizons and replicates were broken apart and composit- ed: (1) surface c. 40 cm: a surface horizon containing mostly Sphagnum spp., (2) c. 40–130 cm, “fen/silvic”:
organics containing plant material from previously frozen silvic and fen peats, (3) the 10–20 cm of organic soil just above the mineral soil: dark, smeary, humified organics; termed “basal organics,” and (4) the min- eral soil horizon. Soil was compacted during the coring process so horizon depths were estimated from prior knowledge of sphagnum depths and visual approximations of fen/silvic and basal layer depths. We do not know if horizon depths differ among the three bogs but observations indicate that there were not dramatic differences. Composited horizons were placed into 1 L jars with a small amount of water pulled from the same depth using a stainless steel fritted rod sampler. Jars were flushed in the field (N2 for 10 min), sealed, shipped on ice and stored at 4°C pending processing. An aliquot of the composite sample was freeze dried (Alpha 1–2 LD Plus freeze drier, MartinChrist, Germany) for DNA and enzyme analyses (see below).
Cores for forest (peat plateau) incubations were taken in winter 2014 using the SIPRE corer. They were shipped and maintained frozen (−20°C) pending subsampling. Forest cores were cut into horizons identified as moss, fibric, mesic, humic, and mineral soil, following standard protocols (Manies et al., 2017). We used different naming conventions for horizons in the peat plateau and the collapse-scar bog because of the large visual differences in soil color and structure between peat plateau and collapse-scar bog soils. No statistical compar- isons were made between horizons of the permafrost plateau and collapse-scar bogs due to the differences in horizonation (e.g., fen/silvic horizon of the bog would contain all organic horizons from the peat plateau).
2.3. Autochamber Fluxes
In 2014 and 2015, an autochamber (AC) system was deployed for continuous monitoring of diffusive CO2
and CH4 flux from our study areas. This AC system was designed by Greg Winston formerly of UC Irvine
and described in Natali et al. (2011). It consists of eight clear plastic chambers connected to a central unit that houses a pump to cycle air to and from each chamber, water and particle traps, flow controls (<1 L min−1), a LI-820 infrared gas analyzer, and a CR1000 data logger. We had tall (50 cm) and short (30 cm) chambers, with a 60 × 60 cm footprint, constructed of UV-resistant Makrolon, and seated on polyeth- ylene bases. Each base was cut into the soil to a depth of c. 5 cm the year before measurements began.
Chamber air was continually mixed using two small fans. There were four chambers per site. Although chambers differed by height, there was no significant difference in air temperatures among the different sized chambers (one-way ANOVA, p = 0.08, 645 observations), and there was a balanced number among sites.
Chambers were set up in mid-May and removed in mid-September. Measurements occurred sequential- ly every 12 min, with chambers open for 8 min and closed for measuring for 4 minutes. We measured ecosystem respiration (RE) approximately twice per week in mid-day by shrouding the chambers using a lightweight blackout curtain. Internal chamber air temperature and 5 cm soil temperature were meas- ured using custom built thermistors (10K ohm thermistor P/N PS103J2, U.S. Sensor, Orange, CA). Soil moisture below each chamber was continuously monitored using Campbell CS616 TDR 20 cm moisture probes. Raw CS616 data were corrected to soil moisture content using a three component dielectric mix- ing model based upon the top 20 cm soil porosity, soil temperature, and raw CS616 data from pure water and air (Kellner & Halldin, 2002). A Picarro G1112-i isotopic CH4 analyzer (Picarro Inc, Santa Clara, CA) and a Picarro G1101 isotopic CO2 analyzer (that also measures CH4 concentrations) were intermittently incorporated into the autochamber system to measure CH4 fluxes. The Picarro was connected to the au- tochamber systems by splitting the air stream leaving the LI-820 and siphoning a 20 mLmin−1 stream of sample gas.
Data were analyzed using Matlab (The Mathworks, Inc., Natick, MA). CO2 fluxes were calculated utilizing the last two minutes of the measured CO2 concentration data from the LI-820. Picarro CH4 flux data were analyzed by synchronizing the timestamp between the Picarro data and the output of the CR1000. We used the 30s integrated signal from the Picarro as it produced the most linear data. We utilized the ideal gas law to calculate mass (Mol) of CO2 and CH4 released from soils using gas concentration, air temperature, average daily barometric pressure, and the chamber volume.
In 2015 we measured soil temperature continuously at 16 depths to 150 cm within the center of each bog using a thermistor rod (10K ohm thermistor P/N PS103J2, U.S. Sensor, Orange, CA), calibrated according to Cable et al. (2016). Data were logged using a Campbell CR1000 datalogger (Campbell Scientific, Logan UT).
2.4. Shoulder Season and Winter Gas Flux
Shoulder season and winter fluxes were determined several ways. Shoulder season fluxes (October 2015) were measured as autochamber fluxes of CO2 and CH4 in the young and intermediate age bogs for one week after snow began to fall (n = 4 chambers per site, 25–40 measurements per chamber). After October, winter fluxes were estimated using a static diffusion-based technique (n = 3). First, gases were sampled under the snowpack and on top of the snowpack through bev-a-line tubing (3.2 mm I.D. and variable length). Tubing at the top of the snowpack ended in an 18-gauge needle (254 mm length; Popper and Sons, New Hyde Park, NY) that was lowered into the snowpack 10 cm using a 3 m boom to avoid disturbance. At 2- to 4-week intervals, surface and snowpack gas samples were taken using a 60 mL syringe of which 50 mL was trans- ferred overpressurized to preevacuated 20 mL serum vials crimp-sealed with 20 mm butyl rubber stoppers.
Next we calculated gas flux through the snowpack using a one-dimensional form of Fick’s law describing unreactive gaseous diffusion in a porous unsaturated media, following Striegl (1993):
d / d
A A A
Q D C z
where QA is the flux of gas A (mol m−2 d−1), DA is the effective molecular diffusion constant of gas A through air at ambient temperature and pressure, θ is snowpack porosity, τ is the tortuosity coefficient, and dCA/dz is the measured concentration gradient of gas A in the snowpack (mol cm−3 m−1). We corrected the diffusion constant for each gas to ambient temperature and pressure using the following equations (Striegl, 1993;
Wickland et al., 1999).
1.823
CO2 1.19 101,325 / / 273.15
D P T
1.823
CH4 1.69 101,325 / / 273.15
D P T
We collected temperatures at the snow-air interface, the peat surface, and at least one depth approximately mid-distance between these measurements using preplaced temperature loggers and portable temperature loggers. At all times we made sure not to disturb the snow near the sampling area. We collected density val- ues for the snowpack in the field using a RIP 2 Cutter® (250 mm; Snowmetrics.com). Porosity was calculated from density measurements as (1−ρ)/ρ−ρ)/ρice, where ρice is 0.91. We described tortuosity as a function of porosity using the theoretical relation 1/3 (Millington, 1959).
Finally, from October 2018 to April 2019, we used the Eosense Forced Diffusion chamber (Eosense, Dart- mouth, Nova Scotia) to quantify winter soil respiration from peat plateau (n = 2) and intermediate age bog sites (n = 1) to improve our estimates of winter flux beyond our manual measurements. Forced diffusion chambers were installed vertically in a 10 cm diameter collar. Fluxes were taken hourly and logged using the algorithm installed in the instrument. We logged approximately 4,000 measurements from each sensor.
2.5. Forest Aboveground NPP (ANPP)
In 2014 forest aboveground NPP was measured to account for C inputs missed by the autochambers in the permafrost plateau. For all trees within a 10 m2 plot, species, height, and diameter at breast height were recorded. Trees shorter than 1.37 m tall had basal diameter measured instead. Black spruce crown growth (g tree−1 year−1) was estimated using allometric equations (Alexander et al., 2012). Allometric equations for tamarack (Larix laricina; new branch growth) and willow (new branch growth plus foliage) were based on equations in Bond-Lamberty et al. (2002). There were no allometric equations for secondary (i.e. stem) growth. However, Alexander et al. (2012) found that secondary growth for an Alaskan black spruce forest was 1.13 times crown growth. Therefore, to estimate both crown and secondary growth for both tree species we doubled our crown growth estimates.
Two eddy covariance towers were located within the vicinity (c. 70 m) of the autochambers, one in the black spruce permafrost forest and another in the intermediate collapse scar bog (Euskirchen et al., 2014).
The black spruce flux tower was installed in June 2010 and the collapse scar bog tower was installed in November 2010. The eddy covariance system for measuring the fluxes of CO2, water, and energy was mounted in the center of the sites, at 3 m height on a tripod in the collapse scar bog, and at 5 m on a triangular tower in the black spruce forest. The instrumentation consisted of a 3-D sonic anemometer (CSAT-3; Campbell Scientific Instruments, Logan, Utah, USA) and an open-path infrared gas analyzer (LI-7500 IRGA; LI-COR, Lincoln, Nebraska, USA at the permafrost forest, and an EC-150; Campbell Sci- entific Instruments, Logan, Utah, USA, at the collapse scar bog). Flux data, collected at 10 Hz, and basic microclimate data, were logged on a digital datalogging system (either a CR3000 or CR5000; Campbell Scientific Instruments). Data processing and gap-filling was performed using standard procedures (Eu- skirchen et al., 2014, 2019).
2.6. Microbial Assays
We measured potential greenhouse gas production, including CO2, CH4, and N2O fluxes for all soil horizons in the peat plateau and collapse-scar bogs using six-month incubations. Although N2O flux may be unrelat- ed to C losses, it is a microbially mediated process that could be stimulated postthaw. Peat plateau horizons (fibric, mesic, humic, and mineral) were thawed and each horizon replicate homogenized with a spatula.
Unfrozen collapse-scar bog samples were immediately processed in a cold room (4°C) under anaerobic conditions (2% H2 atmosphere volume, balance N2). For collapse-scar bog samples, sphagnic, fen/silvic, basal, and mineral horizons were minimally homogenized using a food processor. All roots and large woody debris were removed prior to homogenization. Homogenized splits were allocated to either soil analyses, including moisture, pH, and total C & N content, to DNA extraction for assessing the abundance of Bacteria
and Archaea by qPCR, or to incubations of potential C mineralization, denitrification, electron shuttling by solid-phase organic matter, and speciation of solid-phase iron.
Anaerobic incubations (on soils from all sites) and aerobic incubations (on permafrost plateau soils only) were conducted on 10–12 g field moist soil in 120 mL serum vials. Aerobic incubations were conducted at field moisture and received no water amendments and were conducted in order to quantify the reduction of anaerobic respiration relative to aerobic respiration. Anaerobic incubations received 2–10 mL of sterile filtered and N2-sparged bog water collected from the same depth interval as the sample. Vials were crimp- sealed with 20 mm butyl stoppers and incubated for 6 months at 5°C. We determined trace gas production every week by the buildup of gases over 72 h. We removed 5 mL of gas from the headspace of each vial using an airtight syringe, fitted with a Luer-lock stopcock sealed with high performance vacuum grease and resampled three days later. Anaerobic vials were flushed with five volumes of N2 gas between sampling periods, while aerobic incubation units were vented to the laboratory atmosphere and covered with a 0.8 mil plastic membrane in between sampling periods to permit gas exchange and retard evaporative water loss. Cumulative incubation fluxes up to time t (Ct) were modeled using single exponential model Ct = Ao
(1−e−kt) in which Ao is the available substrate pool of C and k is the rate constant.
We determined concentrations for CO2, CH4, and N2O using a gas chromatograph preconfigured for green- house gas (GHG) monitoring (SRI 8610GC with FID-Methanizer and ECD, SRI instruments, Torrance, CA).
Peak areas for trace gases were calibrated using standard curves developed with certified gas standards (Air Liquide Specialty Gases, Plumsteadville, PA). Values for gas flux were translated to μmol g−1 C.
Denitrifier enzyme activity (DEA), Fe reduction, and organic reduction were measured on all collapse-scar bog soils. For DEA, we mixed 5 g sediment/peat and 7.5 mL DEA solution (1 mM Glucose + 1 mM KNO3 + 30 μM chloramphenicol) into three 60 mL serum vials representing duplicate vials for process measurement and a killed control (Tiedje, 1982). Additional controls contained 7.5 mL of DEA solution and no soil. Vials were crimp-sealed with a 20 mm butyl stopper and flushed with N2, then we replaced 5 mL of headspace with acetylene. Vials were shaken vigorously and placed on a rotary shaker at 100 rpm (5°C). Af- ter 1, 24, and 72 h we withdrew 5 mL of headspace gas for N2O measurement and replaced the volume with helium. We determined N2O concentrations by pulsed-discharge detection (Valco Instruments, Houston TX, USA) on a 6890 gas chromatograph (Agilent Technologies, Santa Clara, CA, USA).
To assess Fe reduction potential, we measured acid-extractable ferrous Fe(II), amorphous ferric Fe(III), and crystalline Fe(III)) (Lovley & Phillips, 1986; Roden & Zachara, 1996). Under anaerobic conditions, we extracted 1.5 g of homogenized soil in 15 mL plastic centrifuge tubes, with either 10 mL of 0.5 M HCl (acid extractable (AE) Fe), or 10 mL of citrate-acetic acid plus 0.5 g sodium dithionite (dithionite extractable (DE) Fe). Each assay (AE, DE) was conducted in duplicate. Samples were shaken at 200 rpm in the dark for 1 h, and then centrifuged at 4,500 rpm for 15 min. A subsample of the supernatant (100 μL for AE;
10 μL for DE) was added to 5.0 mL of ferrozine solution and vortexed for 10 s. Absorbance was measured at 562 nm after allowing a full minute for color development. To determine Fe(III), we subsequently added 0.25 mL hydroxylamine-HCl (0.25 M in 0.25 M HCl) to each AE tube, and reread absorbance at 562 nm, after allowing 20 min for the reduction of Fe(III) to Fe(II). We used a six-point calibration of Fe(II) standards (2–80 μg mL−1) to determine acid extractable iron fractions. Fe reduction was calculated as the increase in Fe(II) over 7d.
We used an electron shuttling capacity (ESC) assay to quantify the degree of reduction of solid-phase organ- ic matter (Keller & Takagi, 2013). ESC is determined by comparing Fe reduction rates using a ferrozine assay from chemically reduced (via palladium reduction) and biologically reduced samples over a 65-day period.
Detailed methods are given in Supporting Information.
Activities for extracellular hydrolytic enzymes (β-glucosidase, cellobiohydrolase, acid-phosphatase, and N-acetyl-ß-glucosaminidase) were determined colorimetrically based on the quantity of p-nitrophe- nol-[pNP] released when soil was incubated with a buffered substrate (Sinsabaugh, 1994). We mixed 2 g freeze-dried soil with 100 mL of 50 mM sodium acetate buffer (pH 5) and stirred vigorously in a 250 mL wide-mouth mason jar with a magnetic stir bar for 15 min. While stirring, mixture was pipetted with an 8-channel pipettor and large diameter pipette tips to 96 well plates containing eight analytical reps of blanks (buffer only), substrate controls (substrate + buffer), homogenate controls (homogenate + buffer) and the
soil enzyme assay (homogenate + substrate). Substrates were 2 mM pNP-ß-D-glucoside, 5 mM pNP-cello- bioside, 5 mM pNP-phosphate, and 2 mM pNP-acetyl-ß-D-glucosaminide, respectively. Absorbances were read on a microplate reader (Biotek, Winooski, Vermont) at 405 nM. The extinction coefficient for pNP was determined from standard curves.
2.7. DNA Extraction and Gene Quantification
Quantification of Bacterial, Archaeal, and methanogen gene abundance was done on DNA extracted from 0.15–0.35 g of lyophilized soil using the Power Soil DNA Isolation Kit (MO BIO Laboratories, Carlsbad, CA), according to the manufacturer’s protocols. The quantity and relative quality of the extracted DNA was assessed using a Thermo Scientific NanoDrop 2000 and the PicoGreen® dsDNA quantification assay (Molecular Probes, Inc., Eugene, OR). All reactions were performed on a Stratagene MX3005P quantita- tive PCR machine (Agilent, Santa Clara, CA, USA) in a 10 µL reaction volume containing 5 µL of Kapa SYBR FAST qPCR Master Mix (Kapa Biosystems, USA), 1 µM of each primer, and 0.5 ng of DNA. qPCR specificity was confirmed using melting curves and gel checking (1.5% agarose). All standards and sam- ples were run in triplicate. Details of the PCR primers and thermocycler settings are given in Supporting Information.
2.8. Carbon Chemical Composition
We examined solid phase soil organic matter chemical composition using Fourier Transform Infrared Spec- troscopy (FTIR) on a Nicolet iN 10 Infrared Microscope (ThermoFisher, Waltham, MA) fitted with an atten- uated total reflectance (ATR) accessory. Ground samples were pressed into a disk, placed on a glass slide, oven dried at 40°C for 24 h, and then stored in a desiccator. FTIR spectra were measured at three different locations within each disk by averaging 45 scans at a 4 cm−1 resolution over a range of 675–4,000 µm. Spec- tra were processed for atmospheric suppression, baseline correction, and ATR correction using the Omnic Picta software (ThermoFisher, Waltham, MA). Decomposition indexes were calculated using ratios between the following wavelengths: 1,030 cm−1 (which corresponds strongly to polysaccharides), 1,515 cm−1 (lignin/
phenol backbone), 1,630 cm−1 (lignin and other aromatics), 2,850 cm−1 (aliphatics), and 2,920 cm−1 (ali- phatics; Hodgkins et al., 2014).
2.9. Peepers and Porewater Isotope Model
In 2014, we installed three replicate soil passive diffusion “peepers” within each collapse-scar bog to quan- tify dissolved carbon, nitrogen, δ13CO2, and δ13CH4 at multiple depths in July and August and to use those data for process modeling. The peeper is a hollow perforated PVC sheath and contained an internal remova- ble solid PVC rod with horizontally drilled holes for holding removable 5-mL Nalgene cup sample collection
“cells” covered by a 0.2 μm, 45 mm polypropylene filter membrane (Pall Life Sciences). The outer rod was anchored into the sediment near the center of each collapse-scar bog and the internal rod would be filled with collection cups, inserted into the bog, allowed to equilibrate for several days, then removed and sam- pled (Thomas & Arthur, 2010).
Before installation, the peeper cells contained 200 μM potassium bromide solution made from distilled, deionized water free of gas bubbles. Br was used as a reverse tracer to allow for equilibrium correction.
Peeper cells were purged in a bath with N2 for 3 days to remove any dissolved oxygen. The sealed bath was transported to the field, and cells were placed into the peeper rods and into the installed PVC sheath within five minutes of opening the container.
After one week, we removed the peeper rods and sampled the water from the peeper cells by transferring peeper solution to preweighed 30-mL serum bottles flushed with N2, sealed with blue butyl rubber stoppers (Bellco Glass, Vineland, NJ), and preacidified with 100 µL of 85% phosphoric acid. We measured the con- centration of bromide tracer remaining in the peeper cells using high performance ion chromatography on a Metrohm 881 Compact IC pro (Anion) with a Metrosep A Supp 7-250/4.0 column. The eluent was 3.6 mM Na2CO3 with a flow of 0.8 mL min−1. Detection was by suppressed conductivity, the column temperature
was 45°C, and sample injection volume was 20 μL. DOC and TDN concentrations from the July sampling were measured on a Shimadzu TOC/TN analyzer (Shimadzu corp, Kyoto, Japan).
We measured the quantity and δ13C value of dissolved CO2 and CH4 using either a Picarro G2131-i isotopic CO2 analyzer or Picarro G1112-i isotopic CH4 analyzer. For each sampling timepoint, 5 mL of headspace gas from each serum vial was diluted with a known volume of either an isotopic CO2 standard (−32‰ at 1,000 ppm) or C-free air depending on analyte, and initial sample concentration to achieve gas concentra- tions (200–2,000 ppm CO2 or 1.8–1,000 ppm CH4) and volumes (50–140 mL) that fall within the operational range for each detector in continuous flow mode.
The reaction network model includes acetoclastic and hydrogenotrophic methanogenesis, fermentation, homoacetogenesis, methane oxidation, and fugitive CH4 (Neumann et al., 2016). Inputs to the model in- clude dissolved CO2 and CH4 concentrations and δ13CO2 and δ13CH4 throughout the depth profile of the three bogs in July and August of 2014 when surface fluxes were maximal. The model started with measured values from July 2014 and simulated CO2 and CH4 concentrations and isotopic compositions for August 2014. Following Wilson et al. (2019), more than one million Monte Carlo simulations were performed in which reactions rates and carbon fractionation factors were varied. The likelihood of each set of simulated values was calculated using measured concentrations and isotopic compositions for August 2014, assuming measurement errors were normally distributed. Likelihood values were used to generate probability distri- butions for the microbial rates and fugitive CH4.
3. Data and Statistics
Data were transformed prior to incorporation into ANOVA models to meet assumptions of normality and homoscedasticity. We analyzed cumulative CO2 and CH4 flux from laboratory incubations using a repeated measures ANOVA followed by LS means contrasts. The bog incubation fluxes were not statistically com- pared to the forest fluxes because horizon designations differed. However, rates of fluxes from the forest floor are presented for comparison. Other microbial data were analyzed with a two way ANOVA with bog age and horizon as main effects followed by Tukey HSD tests. Net ecosystem exchange (NEE) and CH4
flux data were averaged by month and compared using a repeated measures ANOVA with site, year, and month in the model. RE data were treated similarly but data were not averaged by month prior to repeated measures ANOVA. Statistical analyses were conducted using JMP software (SAS Institute Inc.). Data are presented as means and 1 standard deviation unless otherwise noted.
4. Results
4.1. Climate and Site Characteristics
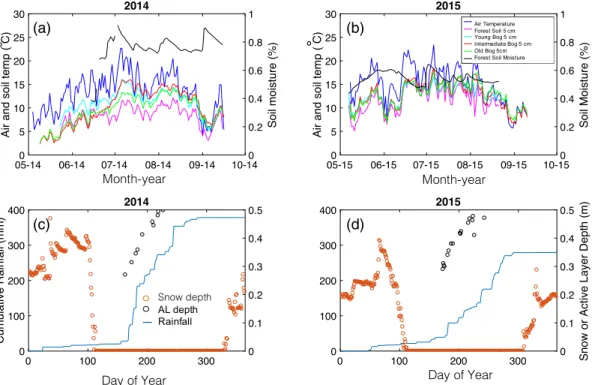
2014 was a 100-year rainfall record year receiving almost 400 mm of rainfall over the growing season (May–
September), whereas 2015 had precipitation nearer the long-term average (c. 300 mm). However, depth to water table from the peat surface did not differ among the two years (Neumann et al., 2016). Maximum snow depth was similar in both years, but 2014 had more snowfall earlier in the season (Figure 1). Greater precipitation resulted in higher soil moisture values in the forest in 2014 (often near 70%) compared to 2015 (near 50%). Forest soil temperatures at 5 cm depth were several degrees cooler than soil temperatures in the collapse-scar bog systems in 2014 (Figure 1), a pattern that diminished but was still observable in 2015.
Deep soil temperatures in the young bog were warmer earlier in the growing season than the two other bogs (Figure S2). For example, June and July soil temperatures in the young bog at 50 cm were 3–7°C warmer than the other bogs. No statistical test of this difference in temperature was made because there were no replicate thermistor rods. The surface 10 cm of the old bog had the warmest temperatures throughout the summer.
4.2. Field Fluxes
Autochamber estimates of NEE indicated that all three collapse-scar bogs were C sinks of around 100 gm−2 over the growing season while the permafrost plateau understory was a C source (Figure 2). Repeated meas- ures ANOVA revealed a significant site × month effect (p < 0.0001) and no effect of year (p > 0.05). While
all three collapse-scar bogs were significant sinks of C, the permafrost plateau understory was a signif- icant source of C which was highest in July and August. The autochambers only measured understory NEE, so we estimated the C sink in the permafrost plateau associated with tree growth as approximately 23.7 gCm−2 year−1. Adding this ANPP value to the understory NEE value continues to indicate that the peat plateau was an overall source of C to atmosphere. Annual NEE data collected from two on-site flux towers corroborate our characterization for the permafrost plateau as a C source (permafrost plateau NEETower: 69 gCm−2; Figure S3). While the bogs were C sinks during the growing season, flux tower measurements for Figure 1. Climatic parameters for the Alaska Peatland Experiment permafrost plateau and thaw bog sites in 2014 (a, c) and 2015 (b, d). Panels a and b: Air temperature, surface (5 cm) soil temperatures for each of the sites, and soil moisture in the permafrost plateau. Bottom panels c and d: snow depth (red circles), cumulative rainfall (blue line), and active layer depth from the permafrost plateau (black circles). DOY: day of year.
(d) (b)
(c) (a)
Figure 2. Net ecosystem exchange (NEE) from the permafrost plateau and the three thaw bogs varying in time-since- thaw (n = 4). Positive values indicate C source and negative values indicate a net sink of C. Data are averaged across years.
the collapse-scar bogs indicate it was an annual source of C to the atmosphere (intermediate bog NEETower:
∼125 gCm−2 in 2014, near neutral in 2015; Figure S3) primarily due to nongrowing season fluxes.
Summer ecosystem respiration (RE) displayed a significant year × month and year × site interactions. In 2014, the extremely wet year, RE increased from June through August whereas in 2015 RE declined from June to August (Figure 3). In 2014 and 2015 there were no differences in RE among any of the sites within a year, averaging 1.24 ± 0.65 gm−2 d−1 in 2014 and 2.03 ± 0.85 in 2015. But the permafrost plateau and young bog had higher RE in 2015 compared to 2014 (Figure 3).
Summer diffusive CH4 flux revealed a significant effect of year (p < 0.0001) and a significant site × month interaction (p = 0.026, Figure 3). We observed greater summer CH4 fluxes in 2014 (0.15 ± 0.09 g C-CH4 m−2 d−1) compared to 2015 (0.09 ± 0.08 g C-CH4 m−2 d−1) possibly due to the greater rainfall in 2014.
The site × month interaction indicated that fluxes increased over the course of the season, with greater in- creases in the oldest collapse-scar bogs. We detected no CH4 flux from the permafrost plateau in either year.
Winter CO2 and CH4 fluxes were measured using three techniques. In October 2015, we utilized the auto- chamber system in the young bog and intermediate age bog for a period of three days each. Net ecosystem exchange (NEE) did not differ between the two collapse-scar bogs and averaged 26 ± 127 mgCm−2 d−1 (Fig- ure 4). The high variability in this value occurred because C uptake was still occurring mid-day and meas- urements were taken without shrouding. CH4 flux rates for the October measurement period were greater in the young bog (82 ± 20 mgCm−2 d−1) than the intermediate bog (20 ± 7 mgCm−2 d−1, p < 0.0001). From December 2015 to February 2016, we used the manual diffusion-based technique to estimate CO2 and CH4
fluxes. There was a significant effect of site and date on CH4 fluxes (p < 0.0001). CH4 fluxes declined over the course of the winter, but the young bog had greater average winter fluxes than the other two bogs (young bog: 48 ± 10 mg C-CH4 m−2 d−1; intermediate bog: 29 ± 16; old bog: 6.7 ± 2.7, Figure 4). CO2 fluxes using the Figure 3. Summer ecosystem respiration (RE; panel a) and methane flux (panel b) from the permafrost plateau and three collapse-scar bogs. RE measurements were taken 1–2 times per week in June, July, and August by shrouding chambers (c. 60–80 measurements per site per summer). CH4 was not detected from the permafrost plateau. Letters denote differences for month × site interaction.
BC
0.0 0.5 1.0 1.5 2.0 2.5 3.0 3.5
June July August June July August June July August June July August Permafrost Plateau Young Bog Intermediate Bog Old Bog
Ecosystem Respiration (g C m-2d-1) 2014 2015
0 0.05 0.1 0.15 0.2 0.25 0.3 0.35
June July August June July August June July August Young Bog Intermediate Bog Old Bog CH4flux (g C m-2d-1)
diffusion technique showed no effect of site and only a significant effect of time (p < 0.0001) with fluxes declining from December to February (Figure 4). Average winter CO2 respiration for all three collapse-scar bogs using this technique was 87 ± 23 mg C-CO2 m−2 d−1. Recently (October 2018 to April 2019) we employed an Eosense forced diffusion chamber to make a second assessment of respiration from the peat plateau and the intermediate age bog. Eosense-based CO2 fluxes averaged 216 ± 80 mg C-CO2 m−2 d−1 for bog and peat plateau sites from November to February and 346 ± 62 in March to April. No differences in flux rates between sites were estimated from Eosense data due to lack of replication within a site.
4.3. Microbial Assays
There was an observable difference in cumulative CO2 or CH4 flux among soil horizons in incubated permafrost plateau soils, thus means averaged over all depths are shown (Table 1). Cumulative CH4 fluxes from col- lapse-scar bog soils displayed a site and a horizon effect (both p < 0.0001) and no interaction, and cumulative CO2 fluxes displayed a horizon ef- fect (p = 0.002). Cumulative CH4 fluxes were greater in the young bog compared to either the intermediate age or the old bog, and cumulative CO2 and CH4 fluxes were greater in the surface horizons compared to the deeper horizons (Table 1, Figure S4). Cumulative anaerobic flux from the peat plateau tended to be at the lower end of fluxes measured in the collapse-scar bog (bog basal and mineral horizons), and anaerobic respi- ration was c. 25% of aerobic respiration (Table 1).
We further examine the controls on cumulative fluxes in the collapse-scar bogs through analysis of fitted parameters Ao and k (Table 2). A difference in Ao would indicate a change in the size of the available substrate pool whereas a change in the reaction rate k would indicate a change in the abundance of microbial enzymes or changes in microbial substrate use (SOC) efficiency. Ao for CH4 flux showed a significant site × horizon effect (p = 0.028), and post hoc tests indicated a greater Ao in the young bog but only in the basal horizon (Table 2). Ao for CO2 flux showed a horizon effect Figure 4. Winter CO2 (panel a) and CH4 flux (panel b) from the
permafrost plateau and collapse scar bogs. October fluxes were measured using an autochamber system. Fluxes from December to February were used measured a diffusion based technique. There was no effect of collapse scar bog age on CO2 flux, but there was a significant site effect and time effect on CH4 fluxes, which were highest in the young bog.
October November December January February 0
50 100 150 200 250 300
CH4flux (mg Cm-2d-1) 0 100 200 300 400 500 600 700
CO2flux (mg C m-2d-1) Young Bog
Intermediate Bog Old Bog
October November December January February
Cumulative CH4 (μmol CH4 g C−1) Cumulative CO2 (μmol CO2 g C−1)
Peat Plateau Aerobic – 831 ± 79 a
Peat Plateau Anaerobic 48 ± 12 214 ± 71b
Young bog 171 ± 34 a 318 ± 111 a
Intermediate bog 69 ± 19 b 166 ± 38 a
Old bog 73 ± 20 b 227 ± 48 a
Sphagnic 160 ± 21a 348 ± 142 ab
Fen/Silvic 176 ± 35 a 363 ± 60 a
Basal 69 ± 26 b 134 ± 22 bc
Mineral 14 ± 5 c 104 ± 22 c
Notes. Peat plateau incubations were either aerobic or anaerobic. Bog incubations were only anaerobic. Letters (if present) denote significant differences from a post hoc test following a significant main effect from repeated measures ANOVA. There were no interaction effects between thermokarst age class and horizon type. The peat plateau incubation was conducted separately and there was no horizon effect so data were averaged to present overall means. No statistical comparisons were made between peat plateau and thermokarst bogs due to differences in horizon designations (see methods).
Table 1
Cumulative CH4 and CO2 From 6-Month Incubations
(p = 0.005) where Ao was greater in the fen/silvic horizon than either the basal or mineral horizon, and not different from the sphagnic horizon. The rate constant k for CH4 flux displayed only a horizon main effect in which the mineral horizon had a lower average reaction rate than all the other horizons (Table 2). The reaction rate k for CO2 flux showed a site effect and horizon effect in which the young bog had lower values than the older bogs, and k was highest in the basal horizon across all collapse-scar bogs.
Potential denitrification rates showed a significant site × horizon interaction (p = 0.001), in which greater rates of potential denitrification were observed in the basal organics of the young bog compared to the two older bogs (Table 2). N2O was detected during the incubations, but its presence was transient (< 72 h). We did not observe any Fe reduction in any of the collapse-scar bogs or horizons (data not shown). However, ratios of Fe(III)/Fe(II) were greater in the surface sphagnic horizon than in the deeper horizons, indicating possible reoxidation of Fe at the surface due to the interaction with the oxygen from the atmosphere or plant roots (data not shown).
Organic terminal electron acceptor reduction was not an important contributor to microbial activity in any of the collapse-scar bogs. The electron shuttling capacity of the biologically reduced and chemically re- duced treatments matched each other, suggesting that there was no measurable reduction of organic matter over the experimental incubation period (Figure S5).
Cellulose degrading and phosphorous releasing enzyme activities showed a decline with depth (two-way ANOVA main effect, p < 0.0006, Figure S6). Cellobiohydrolase also displayed a site effect in which the old bog had greater activities than the young bog. Phosphatase displayed a site × depth interaction in which activity was greater in the basal layer of the young bog compared to the basal layer of the older bogs.
Quantification of the abundance of Bacteria, Archaea, and methanogens showed significant depth effects but no effect of collapse scar bog age (two-way ANOVA depth main effect, p < 0.002 for all three amplicons, Figure S7). Bacteria and Archaea were most abundant in surface horizons and declined with depth whereas methanogens were most abundant in the fen/silvic horizon.
4.4. Porewater Model
In all three collapse-scar bogs, porewater CO2 and CH4 concentrations increased with depth and from July to August (Figure S8). Also, δ13CH4 became increasingly depleted while δ13CO2 became increasingly en- riched with depth, indicating the possibility of both methanogenic reactions and acetogenesis occurring.
Horizon Site
CH4 Ao
CH4 k
CO2 Ao
CO2 k
Denitrification
g C kg−1 g C kg−1 nmolg−1 h−1
Sphagnic Young 174 ± 103abcd 0.0138 ± 0.0045 0.0175 ± 0.0034
Intermediate 180 ± 69a 0.0120 ± 0.0033 133 ± 11 0.0153 ± 0.0010 17.09 ± 5.72ab
Old 152 ± 27ab 0.0156 ± 0.0039 325 ± 111 0.0176 ± 0.0027 10.94 ± 4.46abcd
Fen/Silvic Young 374 ± 149a 0.0138 ± 0.0046 530 ± 98 0.0089 ± 0.0006 15.3 ± 3.03abc
Intermediate 121 ± 31abc 0.0174 ± 0.0025 332 ± 107 0.0190 ± 0.0027 12.76 ± 3.79abcd
Old 128 ± 8ab 0.0186 ± 0.0068 350 ± 157 0.0264 ± 0.0019 9.17 ± 1.54bcd
Basal Young 204 ± 58a 0.0093 ± 0.0014 201 ± 48 0.0324 ± 0.0105 28.94 ± 2.78a
Intermediate 23 ± 3bcd 0.0121 ± 0.0013 87 ± 9 0.0523 ± 0.0065 5.5 ± 0.57bcde
Old 22 ± 14d 0.0190 ± 0.0041 122 ± 27 0.0810 ± 0.0083 6.05 ± 4.22bcde
Mineral Young 74 ± 29abcd 0.0031 ± 0.0005 167 ± 93 0.0070 ± 0.0030 1.34 ± 0.69de
Intermediate 16 ± 2d 0.0038 ± 0.0014 103 ± 32 0.0130 ± 0.0016 1.2 ± 0.38cde
Old 19 ± 5cd 0.0020 ± 0.0002 191 ± 87 0.0123 ± 0.0032 0.04 ± 0.04e
Notes. Different superscript letters indicate significant differences among sites using a two-way ANOVA followed by a Tukey HSD test. Flux data were fitted to the equation: Cresp = Ao (1−e−kt) where Cresp is the cumulative carbon respired up to time, t (d), Ao is the potentially bioavailable (180-days labile) pool (gCkg−1 dry) of soil C, and k is the instantaneous rate constant describing the daily release of C from that pool (McFarland et al., 2019).
Table 2
Kinetic Parameters From Microbial Incubations for Collapse Scar Bogs
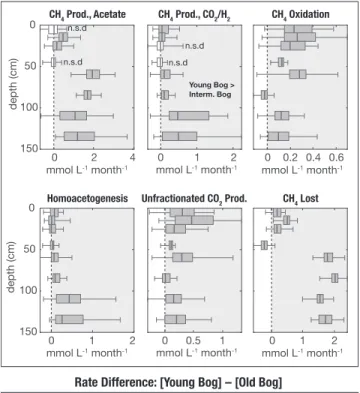
Model output showed that CH4 from acetate tended to dominate that of CH4 from CO2 reduction, but both processes were present at similar rates at depth (Figure S9). We compared modeled rates between the young bog and the two old bogs by taking the difference of 100 rates randomly sampled from the rate distributions for each collapse-scar bog developed from one million Monte Carlo simulations. Rates of CH4 and CO2
production, homoacetogenesis (the production of acetate from CO2), and the amount of CH4 lost (CH4 that the model estimates was produced but is no longer present in porewater), were all greater in the young bog compared to the two older bogs, especially at depth. But rates of CH4 oxidation were also greater in the young bog, mediating CH4 flux to the surface (Figure 5). Rate differences between intermediate bog and old bog were minor (data not shown).
4.5. Organic Matter Chemistry
The carbon chemical composition of the solid phase organic material in the collapse-scar bogs showed variation with depth and thermokarst age. Ratios of FTIR spectra data from the organic horizons indicating the degree of decomposition such as 1630/2850 or 1630/2920 (amide/aliphatics; Matamala et al., 2017) did not show any depth effect, but the ratio of lignin to polysaccharide (1515/1030) showed a depth main effect (fen/silvic horizon 0.30 ± 0.02a; sphagnic horizon 0.24 ± 0.03ab; basal horizon 0.20 ± 0.03b). The lignin to polysaccharide ratio also had a site main effect in which the young bog was greater than the older bogs (young bog 0.29 ± 0.04a; intermediate age bog 0.23 ± 0.03b; old bog 0.21 ± 0.04b). Dissolved organic carbon (DOC) concentrations showed a site × depth interaction (p = 0.004), where the young bog contained greater concentrations of DOC than the intermediate or old bogs, down to 65 cm (Figure 6). Soil solid phase % C had a depth × site interaction (p = 0.0011). Within the sphagnic horizon, the young bog had lower % C than the old bog (Table S1). TDN showed both a site (p = 0.013) and a depth effect (p < 0.0001) where N concentra- tions increased with depth until the mineral soil and they were greater in the young bog (1.87 ± 0.17 mgL−1) than either the intermediate age bog (1.39 ± 0.19 mgL−1) or the old bog (0.92 ± 0.18 mgL−1; Table S1).
Mirroring TDN concentrations, solid phase % N had both a site and depth main effect (Table S1). Percent N was greater in the young bog compared to the intermediate age bog or the old bog (p = 0.004). Percent N was highest in the basal and fen/silvic horizons, intermediate in the sphagnic horizon, and lowest in the mineral horizon (p < 0.0001).
5. Discussion
Our research shows that microbial activities may increase after permafrost thaw and then decline as col- lapse scar bogs age, but this pattern was mostly limited to methanogenesis and, at the field scale, it was sea- sonally dependent. Methanogenesis was clearly stimulated in the youngest collapse-scar bog, as indicated by the cumulative production of CH4 from the laboratory incubations (Table 1). This result was supported by our modeled rates of in situ methanogenesis (both acetoclastic and hydrogenotrophic) which were gen- erally greater in the young bog compared to two older collapse-scar bogs (Figure 5). However, surface fluxes measured with auto-chambers were not greater in the youngest collapse bog during the growing season.
The lack of differences in surface flux could have occurred because in situ CH4 oxidation was greater in the young collapse-scar bog (Figure 5), potentially mediating CH4 flux to the surface. Greater CH4 oxidation occurred in the young bog despite higher Carex abundance which should have increased GHG transport from the bog, stimulated CH4 production, and reduced CH4 oxidation (Turner et al., 2020). Oxidation is occurring relatively deep within the young bog (Figure 5), perhaps out of the zone of plant influence, and methane oxidizer abundance has been shown to be highest in early stages of thaw, particularly in deeper soil layers (Singleton et al., 2018). It is also possible we are not capturing the true rates of CH4 flux with our chamber based technique. Diffusional flux is a relatively small fraction of overall CH4 flux, and ebullition has been shown to be the dominant CH4 loss pathway, especially in the youngest collapse-scar bog (Klap- stein et al., 2014). Collectively, these results indicate that microbial rates of CH4 production were greater in the younge bog, potentially fueling higher rates of CH4 ebullition (Klapstein et al., 2014), but higher diffu- sive field fluxes were not observed possibly due to the mediating effect of CH4 oxidation during summer.
In contrast to summertime results, the young collapse-scar bog showed greater relative diffusive CH4 flux during the shoulder season and winter as compared to the older collapse-scar bogs (Figure 4). Our winter CH4 fluxes were within the range of winter CH4 flux measurements in other studies (Melloh & Crill, 1995;
Figure 5. Differences in reaction rates between young bog and the older bogs. Panel a: Process rates in the young bog compared to the intermediate age bog. Panel b: Process rates in the young bog compared to the old bog. Means appearing in the right shaded area indicate greater rates in the young bog. Boxes represent 25th and 75th percentile confidence interval and error bars represent 1% and 99% confidence intervals. Zero line indicates zone if the rates in the young bog and older bog were not different from each other. Model estimates in situ reaction rates by tracking the time evolution of porewater concentrations and stable carbon isotopes of CO2 and CH4. Process rates includes acetoclastic methanogenesis, hydrogenotrophic methanogenesis, methane oxidation, acetogenesis, respiration, and CH4 lost.
Treat et al., 2018). The switch from lower relative CH4 flux in the young bog in August to greater relative CH4 flux in the shoulder season and winter could occur if (1) CH4 production continues to be greatest in the young bog at depth, within the unfrozen talik, and (2) CH4 oxidation in limited in frozen surface soils. This pattern does not require a difference in CH4 oxidation among the bogs, but only a difference in CH4 produc- tion. This pattern also does not require there to be greater temperatures at depth in the young bog, which does not seem likely based on available data (See Supplemental data). Declines in CH4 oxidizer activity in the frozen surface of wetlands relative to summer have been observed, with continued methanogenesis in the unfrozen talik below, allowing CH4 to escape from deeper depths during the winter or contributing to a spring pulse (Denfeld et al., 2016; Pirk et al., 2016). Greater relative field shoulder season and winter CH4
fluxes from the youngest collapse-scar bog thus could have occurred due to greater continued belowground production and a reduction in surface oxidation, and movement to the surface through cracks or simple diffusion.
Although our porewater isotope model indicated that there were greater rates of in situ microbial CO2 pro- duction in the young bog (Figure 6), the three different aged collapse-scar bogs did not differ in laboratory measured rates of potential CO2 production (Table 1) or field estimates of summer (Figure 4) or winter eco- system respiration. This suggests that methanogens (and denitrifiers [Table 1]) are more responsive to “time since thaw” than other anaerobic microbial communities (e.g. fermenters). All collapse-scar bogs were a similar CO2 sink over the summer (Figure 3), but winter may be an important time of C losses. Eddy covar- iance data collected at the intermediate bog shows the bog as a summer sink and winter source of C to the atmosphere, resulting in annual net losses of C (Figure S2). Our estimates of wintertime C fluxes (including autochamber, Eosense, and manual measurements) calculate a six month winter C source of between 17 and 55 gCm−2 from the all the collapse scar bogs, supporting these tower observations.
Our autochamber and NPP data indicated that the permafrost plateau was a C source throughout summer (Figure 3), even after adding the contribution of aboveground plant growth. This pattern contrasts with the tower data (Figure S2), which shows that the permafrost plateau was a summer C sink, but placement of the autochambers versus the tower may explain this difference. The autochambers were placed in black spruce forest within 20 m of the bog edge, whereas the tower was located 70 m away from the actively thaw- ing bogs and in an area with larger trees and possibly higher productivity. Because our chamber locations were near the permafrost plateau edge, trees were short (generally < 2 m) and not highly productive. Our ANPP estimates on the peat plateau were very low, though near the range of black spruce NPP for poorly drained stands (Ben Bond-Lamberty et al., 2004). Our chamber data combined with estimated NPP indicat- ed that the near-bog permafrost plateau was a source of approximately 100 gC m−2 from May to September Figure 6. Dissolved organic carbon (DOC; panel A) and total dissolved nitrogen (TDN; panel B) concentrations among the three collapse scar bogs. DOC was measured using “peepers” deployed in July of 2014 in young, intermediate age, and old bogs. DOC concentrations were significantly greater in the young bog than the two older bogs down to 65 cm (significant site x depth effect). TDN displayed a significant site main effect in which the young bog had more TDN than the older sites.
in both years. In winter, tower data indicate that the permafrost plateau was a source of up to 70 gC m−2 from just October to December 2015. Although there is much interannual variability in NEE (Euskirchen et al., 2014), permafrost plateau soils and collapse-scar bogs can be sources of C to the atmosphere (Schuur et al., 2009; Wilson et al., 2017) especially in winter (Natali et al., 2019; Treat et al., 2018; Vogel et al., 2009).
But losses of C from the permafrost plateau edge before collapse occurs is an important and understudied phenomenon. Certainly, the permafrost plateau can become a source of C due to warming soils, deepening active layers, and reduced productivity. However, it is worth considering that some of these losses may be originating from the permafrost itself before it has completely thawed. Surface permafrost in this region is within a few tenths of a degree from 0 °C, and thus can contain unfrozen water, supporting microbial activ- ity and diffusion of greenhouse gases out of frozen ground (Öquist et al., 2009).
Overall, our laboratory incubations and isotope model support the idea that microbial activity, particularly methanogenesis, is stimulated soon after permafrost thaw. Other studies, including some at this site, have also shown that methanogenesis is greater when microorganisms have access to recently thawed perma- frost organic matter (Neumann et al., 2016; Chapman et al., 2018). Because differences in cumulative fluxes among bogs were primarily due to changes in Ao and not k, this indicates that increases in microbial activity were likely driven by greater substrate availability (DOC and TDN) present within the young collapse-scar bog (Figure 6), and not changes in microbial efficiency. DOC is a source of C for fermentation and methano- genesis, as well as priming of decomposition at depth (Drake et al., 2015; Walz et al., 2017; Yang et al., 2016).
Dissolved organic matter in peatlands is often derived from surface plant material that descends through the soil column, becoming substrates for methanogenesis (Klapstein et al., 2014; Tfaily et al., 2018). Howev- er, since the N concentration of solid phase organic matter was also highest in the young collapse-scar bog, it is also possible that microbial activity is responding to N sources from the thawing edge of permafrost.
Potential denitrification rates and phosphatase activity were also highest in the young bog, which is further evidence that microbes are less N limited in the youngest bog (Margalef et al., 2017). Despite the increased dissolved C and N in the young bog, the abundance of Bacteria, Archaea, and methanogens did not differ among thaw ages. This may indicate that microbial activity, but not abundance, were limited by C and N.
Two terminal electron accepting processes, Fe reduction and organic terminal electron acceptor reduction, were not occurring at significant rates in any of the collapse-scar bogs and thus had little influence over rates of microbial respiration observed. We had hypothesized that electron accepting compounds could be released from thawed permafrost that may stimulate microbial activities, but this theory was not supported.
Lipson et al. (2010) have shown that Fe cycling is a critical electron supply source for microbial activity in tundra systems. Tundra microbes in the active layer live in close proximity to mineral soil where Fe (III) for reductive processes may be present. Our collapse-scar bogs were approximately 150 cm deep, separating this important terminal electron accepting process from dominant microbial activity within this system. Greater rates of potential denitrification were observed in the deepest layers of the young bog (Table 2), possibly due to greater availability of N from the thaw front (Finger et al., 2016), and also contributing additional CO2
production in the young bog soils.
The solid phase SOM chemistry showed differences in the lignin:cellulose ratios that could be an indicator of the presence of vascular tissue. This ratio was highest in the fen/silvic horizon which likely contains the highest concentration of vascular plant tissues, as we assume that this horizon was derived in part from a former permafrost plateau. This ratio was also highest within the youngest bog, indicating that the organic matter within this collapse-scar bog was less decomposed relative to the older bog systems. The less de- composed organic material within the young bog is consistent with this bog providing fresher material for decomposition and this in turn supports greater levels of microbial activity soon after thaw.
6. Conclusions
At this lowland site in interior AK, collapse scar bogs and the surrounding permafrost plateau can be net C sources to the atmosphere in some years. We attempted to elucidate the microbially mediated mechanisms behind these fluxes through an examination of field and lab fluxes and microbial assays from across a per- mafrost thaw chronosequence. We observed greater rates of methanogenesis in the youngest bogs, linked to greater resource availability (DOC, TDN, less decomposed organic matter). Increased methanogenesis did