doi:10.1351/pac200880010105
© 2008 IUPAC
INTERNATIONAL UNION OF PURE AND APPLIED CHEMISTRY CHEMISTRY AND THE ENVIRONMENT DIVISION*
TRANSPORT OF PESTICIDES VIA MACROPORES
(IUPAC Technical Report)
Prepared for publication by
WERNER KÖRDEL1,‡, HANS EGLI2, AND MICHAEL KLEIN1
1Fraunhofer Institute for Molecular Biology and Applied Ecology, D-57392 Schmallenberg, Germany; 2Syngenta Crop Protection AG, CH-4002 Basel, Switzerland
*Membership of the Division Committee during the preparation of this report was as follows:
President:W. Klein (Germany); K. D. Racke (USA); Secretary:P. T. Holland (New Zealand); Titular Members:
E. Anklam (Belgium, 2002–2005); H. Behret (Germany, 1998–2001); P. Dysseler (Belgium, 2000–2005); J. Gilbert (UK, 2000–2001); L. Klasinc (Croatia, 2002–2005); W. Klein (Germany, 1994–2005); L. McConnell (USA, 2004–2007); J. Miyamoto (Japan, 1990–2001); W. J. G. M. Peijnenburg (Netherlands, 2000–2005); N. Senesi (Italy, 2002–2005); D. Turner (Sweden, 2000–2001); R. D. Wauchope (USA, 2002–2007); Associate Members:
R. Battalglia (Switzerland, 2002–2003); W. R. Benson (USA, 2004–2005); R. Cantrill (USA, 2002–2005);
A. Felsot (USA, 2002–2003); O. Hertel (Denmark, 2004–2005); P. M. Huang (Canada, 2002–2005); W. Kördel (Germany, 2004–2005); R. P. Martin (France, 1998–2001); S. W. Page (Switzerland, 2000–2001); Y. Shevah (Israel, 2000–2005); K. Tanaka (Japan, 2004–2005); H. P. van Leeuwen (Netherlands, 2002–2003); National Representatives:P. S. Fedotov (Russia, 2002–2005); M. Fritzgerald (Australia, 2004–2005); R. M. Harrison (UK, 2002–2003); S. H. Herve (Finland, 2004–2005); Y. H. Kim (Korea, 2002–2005); J. J. Pienaar (South Africa, 2002–2003); E. Resto (Puerto Rico, 2002–2005); J. Scott (Australia, 2002–2003); T. Tavares (Brazil, 2000–2005).
‡Corresponding author: E-mail: werner.koerdel@ime.fraunhofer.de
Republication or reproduction of this report or its storage and/or dissemination by electronic means is permitted without the need for formal IUPAC permission on condition that an acknowledgment, with full reference to the source, along with use of the copyright symbol ©, the name IUPAC, and the year of publication, are prominently visible. Publication of a translation into another language is subject to the additional condition of prior approval from the relevant IUPAC National Adhering Organization.
Transport of pesticides via macropores
(IUPAC Technical Report)
Abstract: This report provides an overview of the transport of solutes via macro- pores focusing on the practical relevance of the phenomenon. After a description of matrix flow and preferential flow in soil, information related to macropores, in- cluding their formation and measurement techniques, is briefly presented. Then, the influence of experimental conditions and of environmental and agricultural factors and pesticide properties is discussed, based on a statistical evaluation of all published studies offering sufficient quantitative information. Most of the ana- lyzed parameters do not significantly influence the experimental pesticide losses.
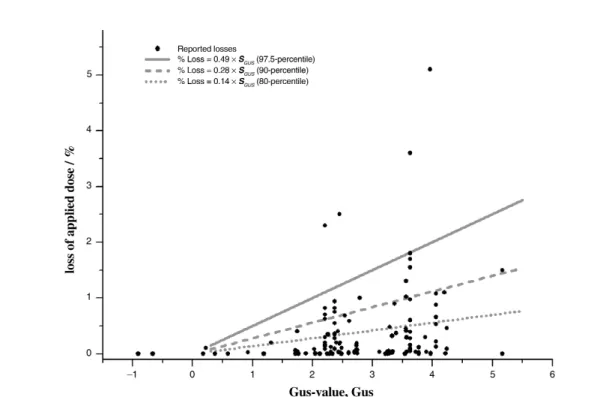
The groundwater ubiquity score (GUS) index turned out to be the most important compound property to describe substance losses through macropore flow.
In a third section, tools for modeling pesticide transport through macropores are presented and critically evaluated. Results of the computer model MACRO, which is also used in the EU pesticide registration process, are compared with ex- perimental losses. For five out of seven investigated pesticides (A–D, F), the sim- ulated losses are in agreement with the experimental data. However, for two com- pounds with very low KOCvalues, MACRO overestimated the losses.
Finally, the significance of pesticide transport via macropores for contami- nation of ground and surface water is assessed. Losses caused by macropore trans- port may considerably exceed losses caused by matrix transport at a specific site.
Therefore, a site-specific assessment of pesticide leaching is needed.
Keywords: preferential flow; pesticides; groundwater pollution; preferential flow models; IUPAC Chemistry and the Environment Division.
CONTENTS
1. INTRODUCTION
2. GENERAL CHARACTERISTICS OF MATRIX AND MACROPORE FLOW 2.1 Soil hydraulic conductivity
2.2 Formation of macropores and spatial variance 2.3 Measuring macroporosity
2.4 Water flow and substance transport in soil
3. EVALUATION OF PUBLISHED RESEARCH PAPERS ON MACROPORE TRANSPORT OF PESTICIDES
3.1 Database
3.2 General observations
3.3 Influence of environmental parameters 3.4 Influence of compound properties 3.5 Range and distribution of total losses
4. MODELING PREFERENTIAL FLOW PROCESSES 4.1 Simulating preferential flow
4.2 Performance of preferential flow models
4.3 Preferential flow models in the pesticide registration procedure 4.4 Comparison of model-predicted losses with experimental data
4.5 Limitations and challenges
5. SIGNIFICANCE OF SOLUTE TRANSPORT THROUGH MACROPORES
6. CONCLUSIONS
7. REFERENCES
APPENDIX 1: SHORT DESCRIPTION OF SOIL PHYSICAL PARAMETERS AND EQUATIONS APPENDIX 2: COMMON AND IUPAC NAMES OF PESTICIDES MENTIONED IN THIS REPORT
1. INTRODUCTION
While matrix flux is dominant in sandy soils, in structured (silty and/or clayey) soils, preferential flow is of highest importance. In clayey soils, macropores are predominantly formed by shrinking cracks and fissures, often starting at inhomogeneous microregions such as humus particles, small stones, or tap- roots. Formation and stability depend on the water regime of the soil, which is strongly influenced by weather conditions, plant cover, and management practices. In silty soils, biopores are the most impor- tant factor.
Soil chemical and physical properties, such as soil texture and humus content, determine the ma- trix or homogeneous water flux through soils. Sandy soils contain the highest amount of large pores leading to a hydraulic conductivity that permits an infiltration capacity which is sufficient for heavy rainfalls. However, in finer soils, hydraulic conductivity may be exceeded during heavy rainfalls. This leads to surface run-off or—if the soil contains a sufficient amount of active macropores—to macropore flux. Management practices (e.g., ploughing or non-ploughing) and weather conditions can signifi- cantly influence the soil surface (e.g., clogging after a rainfall) and, accordingly, the infiltration capac- ity.
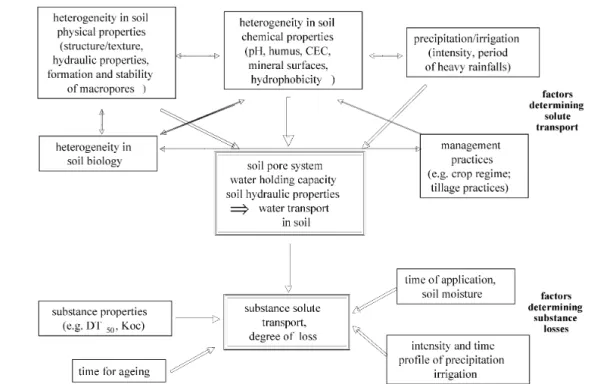
There is a large variability in soil physical and chemical properties, in soil biological activity, and weather conditions in space and time. Thus, solute transport in soils is highly variable.
Fig. 1Factors determining the leaching of substances.
The increase in the number of articles published over the last three decades on the flow of water and solute transport through soil macropores is impressive. An electronic search at Chemical Abstract Services yielded 2 references from the 1970s, 12 from the 1980s, and as many as 218 from the 1990s.
The increased research intensity illustrates the growing awareness of the significance of this transport mechanism in soil. Macropore flow is characterized by its velocity due to bypassing the “normal” ma- trix flow in upper soil horizons. Whereas macropore transport increases the rate of transported material rather than the total amount of conservative and nonadsorbing solutes (e.g., inorganic anions), its po- tential for diminishing the degradation of organic chemicals of anthropogenic origin may be drastic.
Apart from macropore flow, substance movement through the soil is slow and the residence time in the topsoil may be sufficient to allow for dissipation by degradation and adsorption before deeper soil hori- zons with lower degradation capacities and groundwater are reached. Macropore flow, however, may translocate pesticides to deeper horizons in appreciable quantities. As, in this context, pesticides are the most prominent class of anthropogenic compounds of concern, it is not surprising that research on macropore transport phenomena has mainly concentrated on this class of substance. Since a large pro- portion of published research papers and almost all contained quantitative information deals with pesti- cides, this compound class offers the largest database for understanding the phenomenon.
Solute transport through soil via macropores is a highly complex process strongly dependent on a multitude of factors. Not surprisingly, reported losses via macropores are highly variable. Factors commonly assumed to determine the extent of solute transport via macropores include factors deter- mining the abundance and stability of the different kinds of macropores, such as soil texture, organic matter content, actual soil humidity, cultivation practices, previously cultured crops, and many others.
Of similar importance are weather phenomena, in particular, frequency, intensity, and time-regime of rainfall, and further factors affecting percolation, such as irrigation and hydraulic conductivity of the horizon beneath the macropores. Finally, properties related to the inherent mobility and persistence of a solute are of relevance for the extent of its transport.
This report does not consider atmospheric deposition, and concentrates on applications according to agricultural practices. After a description of matrix flow and preferential flow in soil, information re- lated to macropores, including their formation and measurement techniques, is presented. Furthermore, the influence of experimental conditions, environmental factors, and solute properties is discussed, based on a statistical evaluation of all published studies including sufficient quantitative information. In a further section, tools for modeling pesticide transport by macropores are presented and critically eval- uated. Finally, the significance of the transport via macropores for a contamination of ground and sur- face water is assessed for pesticides.
2. GENERAL CHARACTERISTICS OF MATRIX AND MACROPORE FLOW For a discription of soil physical parameter, see Appendix 1.
2.1 Soil hydraulic conductivity
Pore size distribution, and hence water movement in undisturbed soils, strongly depends on soil type and composition. While the total pore volume of different soil types does not differ significantly, there are large differences in pore sizes (Table 1). Clayey soils contain many fine pores, whereas large pores dominate in sandy soils, leading to a pronounced differentiation in saturated hydraulic conductivity (Table 2). Accordingly, water movement in sandy soils is much faster than in silty and clayey soils. The saturated hydraulic conductivities were taken from a textbook showing mean values for silt, clay, and sand.
This explains the large difference between conductivity in sandy and clayey soils. However, the values may significantly differ for native soils depending on soil type, soil formation, and compaction.
Table 1Distribution of pore volumes [1].
Soil constituents Total pore volume/% Fine pores Medium pores Large pores (<0.2 µm)/% <10 µm/% >10 µm/%
Sand ~42 ~5 ~7 ~30
Silt ~45 ~15 ~15 ~15
Clay ~53 ~35 ~10 ~8
Table 2Saturated hydraulic conductivity of soil constituents [1].
Soil type Saturated hydraulic conductivity/cm d–1
Clay ~1 ×10⁻²
Silt ~1–4
Sand ~3 ×10²
Preferential flow ~3 ×10⁴
Pore water in soils is captured by capillary forces and the attraction of the water to the solid sur- faces (matrix potential). Consequently, at water-holding capacity, only very large pores are drained and air-filled. In a draining process, the largest pores drain first followed by the smaller ones. The pore space involved in the flow process is constantly decreasing, leading to a considerable reduction in hydraulic conductivity. As the finest pores with their low conductivity are involved minimally in solute move- ment, their pore water is usually fixed to the soil matrix.
Water flows through the tortuous pathways of the soil pores, interacting with the surface of the solid particles forming the boundaries of the pores. As structured soils are rich in silt and/or clay, they contain only a few large pores, resulting in a slow matrix flow. However, in these soils, matrix flux is usually accompanied by preferential or macropore flow. In structured soils, stable macropores can be formed (see Section 2.2). The volume of macropores depends on several factors that vary in space and time. However, in soils containing high numbers of earthworms, the macropore volume does not exceed a few percent of total porosity (e.g., 0.7–5.7 %) [2]. Schwarz et al. [3] measured about 0.2 % in soil horizons below 40 cm by staining macropores with a dyestuff.
There is no generally accepted definition of macropores. Beven and Germann [4] give a compi- lation of some definitions of macropores and macroporosity, which is extended by further citations.
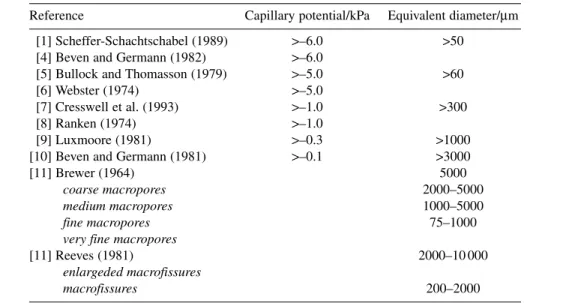
The compilation of definitions in Table 3 demonstrates that the term “macropores” covers a wide range of pore sizes, starting with very fine macropores with a diameter of less than 100µm and ending with biopores of Lumbricus terrestrisand cracks and fissures of clayey soils in the cm range.
Definitions based more or less on soil types define macropores as pores that drain at least at field capacity of soils. According to German nomenclature, this means at a potential of –6 kPa (equivalent to a 60-cm water column) corresponding to a pore diameter >50µm (pores of coarse sand without finer fractions). Authors dealing with field experiments define these macropores as “very fine macropores”.
However, macropores supporting fast water flux have a diameter of about 1.0 mm and larger.
Table 3Definitions of macropores.
Reference Capillary potential/kPa Equivalent diameter/µm [1] Scheffer-Schachtschabel (1989) >–6.0 >50
[4] Beven and Germann (1982) >–6.0
[5] Bullock and Thomasson (1979) >–5.0 >60
[6] Webster (1974) >–5.0
[7] Cresswell et al. (1993) >–1.0 >300
[8] Ranken (1974) >–1.0
[9] Luxmoore (1981) >–0.3 >1000
[10] Beven and Germann (1981) >–0.1 >3000
[11] Brewer (1964) 5000
coarse macropores 2000–5000
medium macropores 1000–5000
fine macropores 75–1000
very fine macropores
[11] Reeves (1981) 2000–10 000
enlargeded macrofissures
macrofissures 200–2000
For the comparison of hydraulic conductivities, the method of measurement has to be taken into consideration. The saturated hydraulic conductivity of sand is measured in the laboratory with a pure sand fraction using short columns. Therefore, in reality, conductivity will not reach the values given in Table 2. Nevertheless, the measured values for total hydraulic conductivity including macropores in undisturbed soils surpass those for matrix flow by 20 to 50 times. The flow velocity also depends on the amount of water supply by heavy rainfall and on the number and diameter of the active macropores, and may reach, for example, 70 cm d–1[12], 100 cm d–1[13], 240 cm d–1[14], and 100–220 cm d–1 [15]. Such high flow rates occur only in open-ended macropores. In experiments with large lysimeters, preferential flow was observed to be 100–400 times faster than matrix flow. These values were meas- ured in experiments that allow free drainage of macropores. Flow rates are much lower if macropores end in a subsoil and the overall water conductivity is controlled by homogeneous water transport in the pore system of the receiving soil horizon.
In practice, matrix and macropore flow occur simultaneously during heavy rainfalls. Both processes can overlap and contribute to the total vertical water movement in different ratios depending on rain intensity and duration, infiltration capacity of the soils, macropore characteristics, and inhomo- geneities in soil profile.
Matrix flow is most important for sandy soils, because their infiltration capacity is high and macropores are not stable in these soils. However, research has revealed that also in structureless, coarsely textured soils (sandy soils), an infiltrating water front may become unstable, showing a finger- like preferential flowpattern [16–18] with flow rates that are much higher than the saturated conduc- tivity of the soil matrix itself. Once a finger has been formed, water and solutes follow the same path during all infiltration events until its “memory”, based on the soil moisture characteristic curve, is lost by saturation or drying [19].
Macropore flowis most important for structured (silty, loamy, and clayey) soils, as these do not contain a sufficient amount of large pores like sandy soils and thus have a relativity low hydraulic con- ductivity by matrix flux. In silty soils, macropores are predominantly formed as biopores by decaying taproots and by earthworm burrows, whereas in clayey soils, macropores are predominantly formed by cracks and fissures during drying. Loamy soils may develop all types of macropores. Caused by the low infiltration capacity of these soils and the occurrence of stable macropores, macropores will become ac- tive during heavy rainfalls, transporting water into deeper soil horizons. A well-known phenomenon in drained soils is water flux through macropores that bypass soil segments that are not water-saturated.
After heavy rainfalls, water flux in drain pipes starts long before saturation of the whole soil.
Accordingly, the heterogeneity of the macropore system in silty and clayey soils leads to physical and chemical nonequilibrium conditions during periods of water flow and transport of chemicals in soils, combined with pronounced formation of wetting front instabilities. Therefore, water flow through macropores is not uniform, but exhibits highly variable velocities. MacCoy et al. [20] used the term
“short-circuit bypass” to indicate this specific form of preferential flow when water bypasses dry soil compartments in large continuous pores (open-ended macropores) in addition to bypassing slow-mov- ing water (matrix flow). For this phenomenon to occur, there must be small nonfilled pores in the vicin- ity of large pores which contain water.
A further type of fast flow can be described as “funnel flow” [21,22]. Funnel flow occurs in inho- mogeneous soils, for example, soils of coarse material containing subcompartments of tightly packed fine material. In this case, preferential flow pathways are formed between the edges of materials of dif- ferent porosity. As macropore flow through fissures and biopores is by far the most important process for fast vertical transport of chemicals, the following parts of the paper focus mainly on this phenomenon.
2.2 Formation of macropores and spatial variance
The formation of macropores and their stability and importance for solute flux depends on soil type, cultivation practices, and climatic conditions. In clayey soils, the formation of fissures and cracks built up during soil drying by physical stress is most important. The following description of the formation process of cracks in clayey soils was given by Dexter [23]:
“When a soil of medium to high clay content dries, it shrinks and vertical desiccation cracks are formed. If the drying is rapid, then the cracks will be closely spaced and will be narrow.
If the drying is slow, then the cracks will have greater space and will be wider. These cracks can form important pathways for rapid water infiltration, aeration and for deep penetration of roots though soils horizons, which might otherwise provide mechanical barriers. When these vertical (primary) cracks become wider than about 4 mm, significant convection cur- rents of air can occur within them and drying can then occur from the faces of the primary cracks. This can result in secondary cracks forming at right angles to the primary cracks. In some cases, tertiary cracks can form from the surfaces of the secondary cracks in the same way.”
The formation of cracks (i.e., the fragmentation of soil aggregates) can be induced by inclusions of materials of different porosity or composition. Large inclusions are of course more effective in in- ducing cracking than smaller ones. For aggregates containing multiple inclusions, stress within the elas- tic deformation zones is additive. Cracks will occur first where inclusions are closest together. Further stressors are roots. As they take water from the soil, soils will dry in the direct neighborhood of large roots. Roots may thus become starting points for cracks.
When soils become wet, they swell and the desiccation cracks close. The rate at which cracks close depends on water flux to and through the cracks and soil characteristics. However, soil will pre- serve a memory of where former cracks were located. Therefore, after repeated drying, cracks will be formed at the same locations.
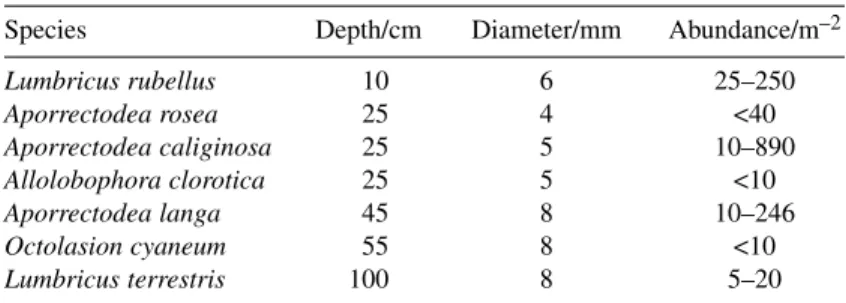
In silty soils, macropores are mostly created by biological activity, for example, by roots (old root channels) or earthworms [4,24]. Mitchell et al. [25] investigated the formation of biopores upon plant- ing of wheat and alfalfa. Stable macropores were formed by decaying roots of alfalfa, which has a tap- root system, whereas wheat with fine, fibrous roots did not produce any macropores. Macropores formed by earthworms can differ significantly in size and depth depending on worm species and abun- dance. Earthworms have an important impact on the soil structure by releasing soil nutrients, by im- proving aeration, water-holding capacity, and drainage, and by burying organic matter. An important
difference between cracks and biopores is that biopores are stable over longer time periods and coated by the excrements of the earthworms, which contain clay-humus complexes of hydrophobic properties.
In swelling soils, the cracks close, but the biopores do not. Therefore, biopores can continue to provide paths for water flux even in fully swollen soils. Table 4 provides an overview of common earthworm species taken from the publications of Fraser et al. [26], Emmerling [27], and Chan [28]. The abun- dances of the different species vary depending on soil types and cultivation practice. In general, higher abundances were found in organic-rich soil. Total organic carbon (OC) in surface soil generally in- creases as degree of tillage is reduced by supplementing soil with organic substances (e.g., from residues of crops and cover plants) [29–32].
Table 4Earthworm activities and abundances.
Species Depth/cm Diameter/mm Abundance/m–2
Lumbricus rubellus 10 6 25–250
Aporrectodea rosea 25 4 <40
Aporrectodea caliginosa 25 5 10–890
Allolobophora clorotica 25 5 <10
Aporrectodea langa 45 8 10–246
Octolasion cyaneum 55 8 <10
Lumbricus terrestris 100 8 5–20
Besides the formation of biopores, cracks, and fissures, cultivation practices that apply deep tillage destroy the soil structure up to a depth of about 60 cm (silty soils), whereas some heavy clay soils can only be ploughed to 20 cm depth. Deep tillage leads to a fast water flow through the produced fis- sures, which is comparable to a “funnel flow”, since the walls of the produced fissures are compacted.
After ploughing, the topsoil has a coarse structure with a relatively low density and a high infiltration capacity. This structure, however, will change within a relatively short time-period: after the first heavy rainfalls, the surface of tilled soils may clog and become crusted, which leads to a significantly reduced infiltration capacity and thus to enhanced run-off. Therefore, the inconsistent results of measurements of soil hydraulic and other physical properties under till systems and no-till systems may be due to the transitory nature of the soil structure after tillage, variable soil water content, site history, the time of sampling, and the potential for soil disturbance.
2.3 Measuring macroporosity
In principle, two approaches have been developed to quantify macropores. The first one attempts to de- termine the influence of macropores by measuring flow characteristics, for example, by plotting break- through curves, determining saturated or unsaturated hydraulic conductivity, and using tension infil- trometers. The second procedure is a direct approach that uses methods to determine the actual number, size, area, distribution, and continuity of macropores for various field conditions. The results of the di- rect approach are useful in developing mathematical models to predict the flow of water and chemicals through the soil profile.
Approach 1
The disc permeameter provides a rapid and convenient in situ method to measure soil hydraulic prop- erties, for example, the sorptivity (S0) and the hydraulic conductivity (K0) close to saturation.
If measurements are made under unsaturated supply conditions with disc permeameters of dis- similar radii [35], K0may be obtained directly from the unconfined, quasi-steady-state flux densities.
For slightly negative supply potentials, the method is particularly attractive, because the variability of soil hydraulic properties is reduced by the exclusion of the larger macropores from the flow. Therefore,
the hydraulic conductivity measured under a slightly negative supply potential provides a more appro- priate match-point than K0when employing ψ0to infer the shape of the unsaturated hydraulic conduc- tivity function in field soils [35].
In circular source-point infiltration experiments using tension disc infiltrometers, both the in situ hydraulic conductivity and the sorptivity of an undisturbed soil [34–36] can be determined. In addition, it is possible to estimate different length and time scales characterizing the soil [37], such as the mean pore radius which is hydraulically active for the imposed water tension. Moreover, by using the disc permeameter filled with a tracer such as chloride, it is possible to deduce the effective mobile water con- tent from samples extracted underneath the disc following a period of infiltration [38,39]. Jaynes et al.
[40] described a method applying a tension infiltrometer and a sequence of conservative tracers to esti- mate both the immobile water content and the solute exchange coefficient between the mobile and im- mobile water domains. This method does not require the assumption made by Clothier et al. [38], pre- suming negligible solute movement into the immobile zone before sampling.
Before irrigation, further tracers are used, such as 18O-labeled water, 15N-labeled urea, or 14C-la- beled pesticides on top of undisturbed soil cores.
Approach 2
To visualize macropores in undisturbed soil cores (lysimeter and field samples), dyestuff is sprayed on the plots followed by water infiltration. Then the distribution of the dyestuff in the soil profile is visu- alized by excavation and preparation of horizontal and vertical soil segments. A more advanced tech- nique is to generate color digital images of section samples by means of a scanner and analysis with a spectral image analysis system. The spectral intensity values of delineated features are grouped into classes to produce maps of their spatial distribution.
X-ray computer tomography is a further revealing tool for nondestructively measuring bulk den- sity and macroporosity. The method creates an image of the density distribution within a sample. In soil science, computer tomography has been used for several years to measure in detail differences in bulk density, porosity, water content, macropore size, and fracture width [41].
Algorithms based on fractal geometry were developed to estimate soil macropore properties such as macropore size/counts, area porosity, and/or saturated conductivity. Empirical equations were devel- oped to calculate macropore size, count, area porosity, and macropore conductivity based on three lev- els of available data. These are: soil texture and (1) an arbitrary size (Rx) and pore count above that size (Nx); (2) a measured macropore-saturated hydraulic conductivity (Kmacro); or (3) an estimated largest macropore radius (R1).
The form of all regression equations was consistent with equations from fractal geometry. The re- sults indicate that satisfactory estimates of macropore size/counts, area porosity, and saturated conduc- tivity are possible from more readily available macropore data.
The disadvantage of laboratory methodsfor measuring water fluxes is the small size of the soil samples. Macropores may be interrupted by the walls of the test cylinder, and the limited height of the test columns does not allow determination of length of macropores. Therefore, these test methods are of limited relevance for measuring macropore fluxes. However, in repeated experiments, they allow for estimations of the micro-heterogeneity of soils.
Frequently used techniques are porous suction cups or plates and tensiometers. Their advantage is that they are suitable for field measurementsand can be placed at lower soil depths. The main prob- lem is that the obtained values refer to a single point or rather small volume of soil; the textural and structural heterogeneity of structured soils is not taken into account. If, for example, one suction cup or tensiometer is placed below a macropore, whereas a second one is introduced in a finely structured sec- tion without macropores, quite different measurements for water flow or solute concentration will be obtained [42].
Large-scale lysimeters and effluents of drainage provide the most realistic information on sub- stance concentration in the leachate. However, flow patterns may be influenced by free draining of macropores during heavy rainfalls, thus essentially simulating a structured soil over a porous subsoil or bedrocks.
2.4 Water flow and substance transport in soil
Primary parameters determining the vertical transport of a substance in a soil profile are the water flow (including all parameters that have an influence on the water flow) and substance-related parameters, such as adsorption and desorption processes or degradation kinetics. For transport via matrix flow, these processes are fairly well understood and can even be simulated by mathematical models (see below). If macropore phenomena are involved, water flow and substance transport become much more compli- cated.
A more quantitative discussion of some of the phenomena described in the following paragraphs is provided on the section “Modeling preferential flow processes”.
According to the different hydraulic soil properties, water fluxes in most soils can be divided into the following distinct flow types:
• infiltration into fine to medium matrix pores
• percolation by flow in large matrix pores
• preferential flow in macropores
• plough layer or shallow interflow (subsurface run-off)
• surface run-off
• discharge by drain pipes
• deep seepage
Figure 2 depicts how prevailing flow types change during a rainfall event starting on dry soil and assumed to continue at a constant rate. At the beginning of rainfall, infiltration into matrix pores occurs, followed by percolation via matrix and macropore flow and, if the rainfall continues, by run-off through interflow and surface flow as well as drainage outflow (in case of drained fields). The figure shows gen- eralized possible behavior rather than absolute relationships and describes the different interacting processes in a simple way.
Fig. 2Time dependence of water flow during a continuing heavy rainfall. Infiltration and percolation processes.
The infiltration capacity of dry soils is highest, as the whole spectrum of matrix pores is not water-saturated. During a precipitation (or irrigation) event, the infiltration capacity is reduced, as fine and medium pores are water-saturated and only large pores are still active. If the capacity of matrix flux is exhausted, preferential flow through macropores becomes the dominating path in structured soils.
The infiltration capacity strongly depends on soil type, water content of soils, and characteristics of the soil surface. If the soil surface is clogged, the infiltration capacity is significantly lower compared to open structured surfaces (e.g., shortly after cultivation).
Water flow through dead-end macropores ceases with time: At the beginning, water from the macropores is infiltrating the soil matrix. Infiltration strongly decreases when the subsoil is water-sat- urated. Water flow through open-ended macropores, however, will continue in situations where the flow-event is directly linked with a coarsely structured subsoil, jointed rock, or karstic aquifer, or in drained fields (see Section 4.3).
Surface run-off
Surface run-off starts when the infiltration and percolation capacity of soils, including macropore flux, is exceeded. The pattern of run-off is spatially variable. Its importance is affected by agricultural management, particularly by the cultivation regime, the plant cover, or clogging of the soil surface and crust formation.
Plough layer flow, or shallow interflow
Water may move horizontally within the soil at shallow depths, often in zones of saturation overlying the topsoil/subsoil discontinuity (plough layer), where a “temporary perched” water table occurs.
Discharge by drainpipes
Water may move through the unsaturated zone of the soil to either peripheral or artificial within-field drains. It is the dominant flow in clayey and silty soils that have been drained.
Drainage flow is dominated by macropore flow, as only soils that have low water conductivity or contain hardly water-permeable subsoil horizons are drained. Therefore, drainage pipes are installed to guarantee a sufficient water percolation and to ensure feasible cultivation in autumn and early spring.
In addition, drains are installed to control a shallow groundwater table. In drained fields, water flow by macropores is very effective, as macropores are open ending in pathways directly connected to the drainage pipes. Therefore, substance concentrations measured in drainage pipes should be related to possible surface water contamination and not to direct groundwater contamination. The discharge by drainage pipes can be collected and measured quite easily by intercepting the drain lines and installing weirs or similar measuring systems.
Deep seepage
Water may leave the soil at the base of the profile into geological formations in an essentially vertical direction. It is generally assumed that it will continue to move to the groundwater. Deep seepage strongly depends on subsoil characteristics. If subsoils beneath the root zone consist of clayey or silty material, the initially preferential flow will be followed by a slow matrix flux showing characteristics of a water flow in dead-end macropores. If the subsoil beneath the root zone consists of porous mate- rial (sandy materials, gravels, or water-permeable parent rocks such as sand or limestone), macropores may drain without a larger depression. For very porous subsoils, water flow velocities by macropores may become similar to those of drained fields. From this it is obvious that the extent of deep seepage largely depends on the hydraulic properties of the subsoil layers. These aspects will be further discussed in Section 4.
Solute transport
Solutes are transported through advection by moving water unless they are retained by adsorption to soil constituents. Other processes like degradation and diffusion are also of importance. Figure 3 illus- trates the transport processes assuming a solute deposit on the surface of the soil (e.g., spray applica-
tion) before the beginning of a rainfall. First, the fine and medium pores will be water-saturated. Then, large pores will become active as well. Solute flux in large pores is much greater than in medium pores.
These differences in hydraulic conductivities lead to an uneven distribution of dissolved substances in the soil profile. If rain reaches a wet soil, the solute transport is much faster, since the flow proceeds di- rectly through large pores, bypassing fine pores already filled with rather immobile water.
This effect is even far more pronounced if macropores are activated by a rainfall intensity ex- ceeding the maximum matrix flow. In case of a continuing intense rainfall, macropores may become ac- tive even before the matrix pores are fully saturated, as the infiltration process occurs relatively slowly.
If the ends of macropores open into drainage pipes or highly permeable subsoils (e.g., karstic rocks or coarse gravel), the overall flow rate and, accordingly, the solute flux are high. This may lead to a sig- nificant solute transport through macropores, causing relatively high substance concentrations in the leachate, although the total macropore volume is low. Most significant transport occurs at the beginning of the first flow event after application of the substance on the soil surface, whereas later events trans- port lower amounts.
Fast water flux through macropores decreases the importance of sorption processes compared to bulk soil due to nonequilibrium conditions which result from a rate of transport exceeding the rate of adsorption. Nevertheless, enhanced adsorption of substances on the walls of biopores has been re- ported. Edwards et al. [43] found a significant adsorption of alachlor and atrazine within earthworm channels resulting in a reduction of the transport. Stehouwer et al. [44] confirmed this hypothesis by explicit determination of chemical properties of burrow linings as a function of soil depth. The burrow linings consist of earthworm excrements that contain hydrophobic clay-humus complexes. The levels of OC are 2 to 8 times higher in the linings than in the surrounding soil, and the adsorption of atrazine is stronger to burrow lining material. In addition to adsorption, some diffusion of solutes into the soil matrix surrounding a micropore does occur, particularly when the soil matrix is dry. The walls of bio- pores are colonized with macroorganisms and are well supplied with oxygen and nutrients.
Mallawantantri et al. [45] observed increased adsorption and mineralization of 2,4-D, carbofuran and metribuzin in surface linings of macropores and also increased mineralization for 2,4-D and carbo- furan.
Contrary to the situation in open-ended macropores, in dead-end macropores the macropore flow and the resulting transport of solutes ceases once the pores are filled. [46]. Further flow is determined Fig. 3Transport of solutes in soil.
by the hydraulic conductivity beneath the macropore zone. Therefore, the transfer of solutes from macropores into the matrix pores of the subsoil horizons is of high importance at the dead ends of macropores. As a consequence, deep seepage of solutes is dependent on the permeability of the subsoil.
However, dead-end macropores lead to “hot spots” (i.e., areas of relatively high substance concentra- tions) around the end of a macropore.
3. EVALUATION OF PUBLISHED RESEARCH PAPERS ON MACROPORE TRANSPORT OF PESTICIDES
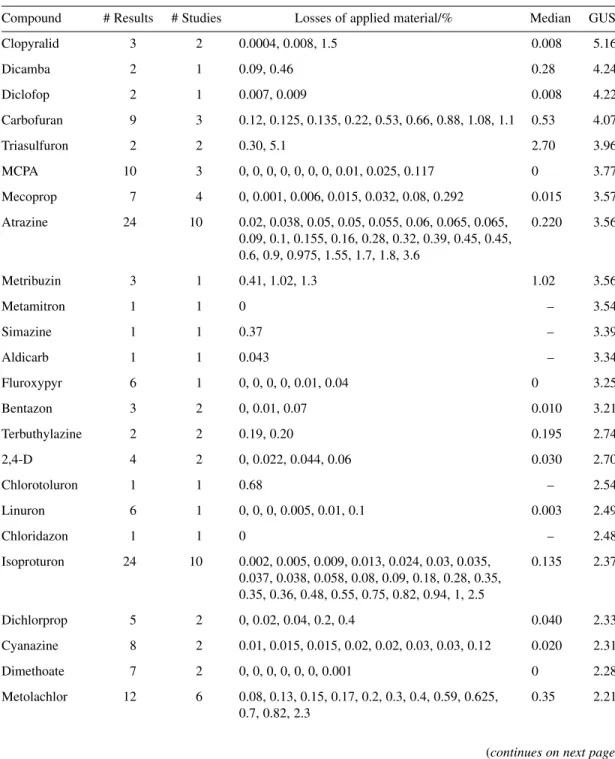
This section gives an overview of published papers dealing with quantitative aspects of the transport of solutes through macropore flow and identifies the parameters that predominatly influence the extent of that transport. To this end, we examine whether high amounts of substances in leachates (in the fol- lowing section, called “losses”) are more frequently related with certain environmental conditions and compound properties than would be statistically expected. Study types used to investigate the transport through macropore flow include measurements in artificially drained fields, lysimeters with structured soils, sampling of soil water with suction cups, and sampling of deeper soil horizons. For IUPAC nomenclature of the pesticides mentioned, see Appendix 2.
3.1 Database
The scientific literature was screened for all pertinent papers that showed clear evidence for macropore flow and that could be evaluated quantitatively. Although there are substantial differences between the suitability of sampling methods for the collection of preferential flow, it was not possible to differenti- ate among different methods. The main characteristics of transport mechanism through macropores (or other preferential pathways) are the solute concentration peaking at the beginning of a flow event and the maximum concentrations, which strongly decrease from event to event. A prerequisite for a quanti- tative evaluation is the availability of total losses (i.e., losses in percent of the material present on the soil surface at the beginning of the study). In many papers, these values are reported; in others, they could be derived from the concentrations and the amounts of leachate. To elucidate the influence of environmental and experimental parameters on the losses, sufficient information must be available.
Therefore, only papers containing this minimum of experimental information were selected for the eval- uation.
Many of the papers report on studies conducted under very artificial, unrealistic conditions such as lysimeter studies involving extreme watering rates shortly after application. As these conditions are inappropriate to draw conclusions of practical relevance regarding the losses via macropores, the se- lected studies were divided into a subset, including studies run under conditions realistic for moderate climates and a second one with studies run under artificial or otherwise highly atypical conditions, such as highly exaggerated irrigation rates within the first few days after application, or exposure to tropical rains, or forest soils. The validity of the conclusions is, therefore, limited to arable soils in moderate cli- mates.
The selected studies are compiled in Table 12 (realistic conditions) and in Table 13 (unrealistic conditions). The tables include the main experimental and environmental parameters, where available, as well as compound properties.
KOC(sorption constant related to OC content) and DT50(time where 50 % of the original amount has disappeared): If reported, values from a particular paper are listed; otherwise, averaged published values* are given as substitutes. Such “generic values” are written in parentheses.
*Values were taken from [47] or from [50].
Study description: Includes particularly percolation depths and, in the case of drainage studies, the spacing of drainage pipes (not available in all cases).
Experimental conditions: Include clay and OC content if available, tillage practice, date of appli- cation, description of irrigation, and other details about the study deemed important.
Duration: Time period between application of the compound and last flow event, hence includes the entire observation period. Although macropore flow implies a rapid flow event, losses may occur in subsequent flow events over a longer time period, most likely after translocation to deeper soil horizons in the early events.
First event: Interval between application of the compound and the first heavy rain or flow event reported. Although of high potential importance, this parameter is difficult to derive in many cases and is thus uncertain.
Cmax: Highest concentration reported during the entire study interval (mg/L).
Cmean: Mean concentration; calculated under the assumption of the total losses being evenly dis- tributed in the total percolate (mg/L).
Losses: Sum of all losses (i.e., material detected in the outflow of the test system) of the solute during the entire study interval, expressed in % of the applied material.
3.2 General observations
In many studies, researchers attempted to investigate the importance of specific factors. For example, by comparison of neighboring plots drained at different spacing of drainage pipes, the influence of the distance between drainage pipes was derived. Other investigations aimed at elucidating the effect of dif- ferent tillage systems by keeping other variables as constant as possible. Or, attempts were made to find out about the dependencies on compound properties by joint application of two or more compounds.
Can such investigations yield generally valid results? A closer look at the investigations summarized in Tables 12 and 13 shows that this is rarely the case. Factors that dominate in one study do not in others.
For example, in [49] dependence of losses on spacing of drainage pipes is reported, whereas in [50] no such influence was observed. While in [51] metolachlor losses were below those of atrazine, in [50] a reversed order was observed despite identical conditions for both substances. Lower losses are reported [52] in 1990 compared to 1989 for atrazine, cyanazine, and alachlor as expected from lower precipita- tion, lower percolate, and a longer interval to the first leaching event; carbofuran, however, strongly in- creased from 1989 to 1990 under the same study conditions.
These examples indicate that total losses via macropore flow cannot be attributed to factors in a straightforward manner, nor does one study allow drawing any general conclusion. Rather, the avail- able set of results is characterized by a pronounced diversity and inhomogeneity, demonstrating that the numerous factors interact and counteract in an unpredictable manner. Nevertheless, some rough con- clusions can be drawn from the studies compiled in Tables 6 and 7:
• Compounds with very high soil adsorption constants (KOC> 1000 cm3g–1) are found in the seep- age water in very small concentration, if it all.
• Very high precipitation or irrigation shortly after application increases the losses through macro- pores.
• Soil horizons of a thickness of less than 40 cm are not suitable for investigating transport phe- nomena via macropores under practical field conditions.
In the following section, a closer, statistically supported look will be made on the influence of parameters that may be of importance.
3.3 Influence of environmental parameters
Losses that could be used for the comparison are highlighted bold in Table 6. As a certain percolation of rain or irrigation water is a precondition for any parameter to influence the losses, experiments that did not show any percolation of water were not considered (e.g., [54]). In order to avoid overweighting of some studies, identical replicates were averaged (remark in the last column, e.g., [49,52]). For the final evaluation, there were 174 results available from 31 studies conducted with 33 different pesticides at 23 sites.
Comparison technique
Losses for individual compounds do not show a direct correlation with any of the environmental para- meters. The number of results per compound is too low, and the variability among the results is too high due to the dependence on many parameters. To have at least a rough statistical evaluation, despite the complex and variable dependence on the various factors, all parameters were examined individually as to whether they favor higher or lower losses. To this end, suitable binary designators were attributed to the losses (“high” or “low”) and to each of the potential impact parameters (derived from a ranking of the values, see following paragraphs). The statistical evaluation was done by a simple statistical exam- ination on whether the binary variables correlate (i.e., whether high losses occur more frequently in the subsets “high” or “low” for each of the parameters).
Because the losses, expressed in % of the applied material, are to some extent dependent on com- pound properties (see next section), these had to be eliminated. To this end, the assignment to the sub- sets was done individually for each compound by comparing each result with the compound-specific median value and transforming it into the comparative “loss parameter” with the values “+” (above me- dian), “–” (below median), or “0” (equal median). The “loss parameter” so defined merely depends on environmental factors.
Accordingly, the other parameters were assigned to two groups for each parameter. For the “de- scriptive” ones, the groups were formed as follows:
Type of investigation: “drainage” or “lysimeter”; the few studies of other types were not assigned to either group.
Season: “spring” or “autumn”, depending on the date of application of the pesticide (i.e., the start of the observation period). “Spring” studies started between March and June, most often in May; “au- tumn” studies started between October and February, most often in November.
Tillage: “deep” or “no”, depending on whether the tillage system involved deep or no ploughing.
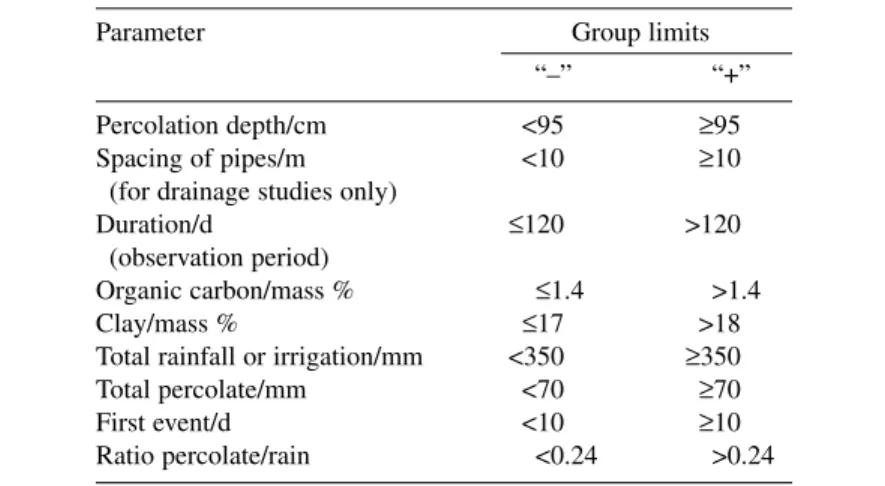
To all quantitative parameters, a value “+”, or “–” was attributed to each study, depending on whether the nominal value was “high” (= “+”) or “low” (= “–”), e.g., “high clay content” or “low clay content”. The group limits were selected such as to form similarly sized study subsets for this para- meter. If no value was reported for a given parameter, the study was not used to examine the influence of that parameter.
In addition to these directly observed parameters, the total percolate expressed as a fraction of the total rainfall or irrigation was calculated. The derived parameter is expected to be higher for rain falling on wet soil and might therefore be relevant for the extent of losses.
The base set of data consists of 174 loss results. They are expressed in “+”, “–”, or “0” along with the descriptive parameters mentioned above. The correlation between the loss and any environmental parameter was derived by counting the numbers of the combinations +/+, +/–, –/+, and –/– for the pair of variables in question, i.e., it was examined how many of the “high” and “low” losses were linked with either subgroup of a given parameter. The values “0” were assigned in half to both the “high” and
“low” losses. The statistical comparison of the numerical values connected with the distributions
“+/+”:“+/–” and “–/+”:“–/–” (or similar for other groups such as “spring/autumn”) allows the decision on whether the correlation is significant or not. Statistical testing was done with the χ2-test. Values for χ2> 3.8 prove two distributions to be significantly different at a probability level of 95 %; for details, see textbooks on statistics.
Table 5Group limits for different parameters.
Parameter Group limits
“–” “+”
Percolation depth/cm <95 ≥95
Spacing of pipes/m <10 ≥10
(for drainage studies only)
Duration/d ≤120 >120
(observation period)
Organic carbon/mass % ≤1.4 >1.4
Clay/mass % ≤17 >18
Total rainfall or irrigation/mm <350 ≥350
Total percolate/mm <70 ≥70
First event/d <10 ≥10
Ratio percolate/rain <0.24 >0.24
To derive the influence of the season upon the losses, for example, the distributions
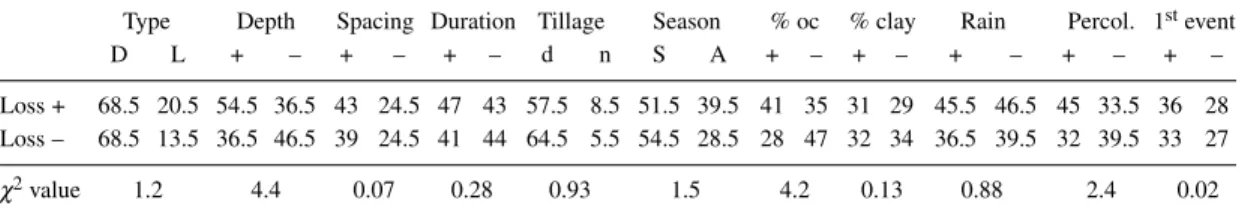
“S/+(loss)”:“S/–(loss)” and “A/+(loss)”:“A/–(loss)” are evaluated: the distributions are 51.5:54.5 and 39.5:28.5, hence showing a slightly increased frequency for autumn losses being higher than spring losses; the χ2value of only 1.5 suggests, however, that the difference is close to randomness.
The procedure was also used to examine the relationships between any other variables. Such comparisons are used in the next chapter to support the validity of conclusions by checking the plausi- bility of dependencies.
Discussion
The statistical procedure used allows determination of whether the frequency distribution of the losses is statistically linked to that of experimental or environmental parameters. As “correlation” does not necessarily mean causality, it has to be examined further whether any correlation between losses and any parameter is a simple consequence of a causal link to another parameter. Taking into consideration general experience and knowledge as well, the plausibility of conclusions with regard to correlations can be further substantiated.
Table 6 shows the detailed frequency distribution of the subgroups “high losses” and “low losses”
for the subgroups of the other parameters, illustrating the influence of the parameters on the losses. For example, high clay content is related to high or low losses, whereas % OC shows a positive correlation (i.e., a tendency for higher losses in soils with a higher OC content). In Table 7, the interrelations be- tween most other parameters are listed in a generalized form (the parameter “tillage” was omitted, as the low number of no-tillage experiments results in erratic correlations). Relation arrows are put in parentheses where a correlation between two parameters is apparent rather than causal. For example, the significant correlation in Table 7 between the study duration and % clay has no causal significance, but is simply due to the fact that the longer studies happened to be carried out more frequently on soils richer in clay. As the clay content did not turn out to significantly influence the losses (see below), this bias has no consequences for the outcome of the evaluation. Hence, some relations between different parameters are accidental and due to the limited number of available investigations, whereas others are as expected, for example, the higher total rainfall in studies starting in autumn. Such relations confirm the applicability of the statistical approach.
Table 6Dependence of losses on several environmental parameters.
Type Depth Spacing Duration Tillage Season % oc % clay Rain Percol. 1stevent
D L + – + – + – d n S A + – + – + – + – + –
Loss + 68.5 20.5 54.5 36.5 43 24.5 47 43 57.5 8.5 51.5 39.5 41 35 31 29 45.5 46.5 45 33.5 36 28 Loss – 68.5 13.5 36.5 46.5 39 24.5 41 44 64.5 5.5 54.5 28.5 28 47 32 34 36.5 39.5 32 39.5 33 27
χ2value 1.2 4.4 0.07 0.28 0.93 1.5 4.2 0.13 0.88 2.4 0.02
Table 7Relations between any parameter.
Study types and design Type of investigation
There is a slight tendency toward higher losses in lysimeter studies compared to drainage studies. This is not surprising, because in lysimeters the percolation is similar over the entire cross-section of the soil, whereas in drainage studies there is some dissimilarity due to a variable distance from the surface to the drainage pipes. It is therefore plausible that in drained fields the collected amount of percolating water is lower than in lysimeter studies, which results in the tendency for higher total amounts of percolate in lysimeter studies (Table 7). Although this is partly due to the random tendency to more rainfall in the lysimeter studies (correlation type/rain in Table 7), the explanation is further supported by the ratio per- colate/total precipitation (i.e., the fraction of the total precipitation that percolated). The 90-percentile of the ratio is 0.43 for lysimeter studies (i.e., 43 % of total precipitation percolated during the entire ob- servation period), whereas it is only 0.33 for drainage studies. This is confirmed by a clear dependency of type vs. percolate/rain in Table 7. Therefore, it is evident that the low difference in the losses between drainage and lysimeter studies is reasonable, and it can be assumed that the influence of the other para- meters is similar for both study types. It is thus justified to combine the results of all study types for the evaluation.
Percolation depth
Contrary to what might be expected, the group of studies with a deeper percolation depth (>95 cm) shows clearly higher losses. Although this finding confirms that macropore flow bypassing the soil ma- trix was measured in the studies under evaluation, the conclusion that losses generally increase with depth would, of course, be misleading. The finding may indicate that drainage pipes at a depth of more than 1 m more efficiently drain the entire fields (most studies were done on drained fields!). A lower depth would require much narrower spacing to obtain a similar efficiency. This conclusion is supported by a similar inverse correlation between the percolation depth and the total percolate: a χ2value of 6.1 proves that the draining efficiency is higher in fields with deeper drainage pipes.
The fact that all lysimeter studies are in the subgroup “>95 cm” has not biased the result. The un- expected dependence is even more pronounced for drainage studies only. For this study type, as ex- pected, the depth is strongly correlated with the spacing (χ2= 50), reflecting that the spacing is wider with increasing drainage depth (spacing vs. depth in Table 7).
Therefore, it seems that the correlation of the losses with the percolation depth is due to the higher drainage efficiency in the studies with larger depths, hence rather indirect than causal.
Duration (observation period)
Losses are not significantly dependent on the observation period. This finding is in agreement with the fact that losses are dominated by the first events after application. Losses occurring later are of minor importance, so that the extension of the observation period does not increase the losses significantly.
The early occurrence of the losses is another characteristic of macropore transport that is correctly re- flected in the evaluation of the studies. The observed dependence of the total precipitation and the total amount of percolate on the observation period are plausible, as both are increasing with increasing study duration.
Agricultural factors Tillage
There is no significant difference between no-tillage and conventional tillage. The slightly higher num- ber of higher losses in no-till studies is in the range of randomness.
This finding may be surprising in view of the many papers describing a strong influence of tillage practices on soil porosity. It was observed that tillage sequences had an effect on the aeration porosity, which was significantly higher for the minimum tillage. The effect was mainly due to the increase of the pores >300µm diameter (aeration pores), (e.g., [7,30,61]). Moreover, tillage practices have a strong impact on bulk density and, consequently, on water flow. Edwards et al. [62] noted that the bulk den- sity of a no-till soil was about 1.6 t m–3. If conventionally tilled, the bulk density of the horizon de- creased to about 1.0 t m–3shortly after tillage and reconsolidated to about 1.3 t m–3during the grow- ing season. Moreover, the ability of soils to absorb and transmit water is affected by the structural stability of the soil pores and by the moisture conditions of the soil at the time of measurement; both soil conditions are usually modified by tillage practices [63] and strongly dependent on weather condi- tions and sampling period after cultivation.
Therefore, it appears that the influence of tillage on macropore transport is very complex, and the various factors may, on the whole, average out, resulting in the observed absence of appreciable effects between tillage and no-tillage. Moreover, the total number of no-tillage studies (12) may be just too low to allow meaningful conclusions to be drawn.
Season of application
In agreement with the general experience, a slight tendency to higher losses of autumn-applied pesti- cides can be observed. However, the difference is low, and the slight trend does not allow for general- ization by concluding that losses in autumn are clearly higher than in spring. Table 7 reveals that total percolation (which influences the losses significantly, see below) on average is not higher in autumn than in spring. The higher percolation/rainfall ratio in autumn is obviously outweighed by more inten- sive rainfalls in spring. This conclusion does, of course, only apply to macropore flow. Without doubt, the matrix flow is higher in autumn as a consequence of a higher water saturation of the soil in the colder season in Europe and North America.
Soil parameters
Organic carbon content: The influence of the content in OC is significant: the higher the OC content, the higher the losses. As the macroporosity of the soil and the stability of the macropores increases with the content in OC, the dependence of the losses on % OC reflects the higher macroporosity, hence the higher leaching. This conclusion is supported by the equally high dependence of the total percolate on
the OC content (χ2value = 5.8). It also demonstrates that sorption processes are of less importance for preferential transport than for homogeneous transport.
Clay content
The clay content of the topsoils does not appear to be among the factors that dominate the solute trans- port via macropore flow. This is surprising, as macroporosity is generally higher in heavy soils and might be related to the fact that the present survey was limited to studies where macropore flow oc- curred (i.e., to silty and clayey soils). Although formation and flow characteristics may differ in clayey and silty soils (see Section 2.2), rapid solute transport will occur in both soils, leading to comparable results.
There are many studies illustrating that macropore flow and macropore transport are much more important for structured soils (i.e., soils rich in clay and/or silt). Bergström and Jarvis [53], for exam- ple, compared losses of dichlorprop and bentazon in lysimeters with different soils. Whereas clayey soils, and (even more so) peat, showed relatively high losses, losses were low in a sandy soil. Flury et al. [64]reported losses of triasulfuron, terbuthylazine, and atrazine through macropores of a loamy soil, whereas there was no leaching down to 40 cm in a sandy soil.
Factors related to rainfall, irrigation, and percolation Total precipitation and total percolate
The total amount of precipitation or irrigation appears to be of minor importance. More important is the amount that percolates. A tendency toward higher losses is indeed observed for higher amounts of per- colates. It may appear surprising that the influence of the percolation is not more pronounced. However, percolation depends on many factors that have not usually been recorded in the published papers, such as the humidity status at the beginning of the rainfalls, the extent of shrink fissures, and the duration of saturated percolation conditions.
First rainfall or drainage event
It is surprising that the delay of the first heavy rainfall or drainage event appears to be of no signifi- cance. According to experience, pesticides are more available for off-site transport shortly after appli- cation than after aging. This is corroborated in the many studies under unrealistic conditions sum- marized in Table 6, which show high losses upon very heavy rainfall or irrigation within the first three days. Why does this factor not manifest itself in the total losses? One reason may be due to the fact that aging of residues does not depend on the elapsed time only. For example, aging is slower on dry soils, because migration into micropores and to adsorption sites requires some mobile soil water, which is true for many degradation processes. In addition, moderate rainfalls, which do not lead to drainage events, will lead to a distribution of mobile and moderately mobile pesticides in the upper soil layer. This dis- tribution in a broader soil layer causes lower concentrations in the pore water of the soil, which will be transported through macropores by heavy rainfalls. Thus, there may be several factors significantly in- fluencing the losses. Moreover, the actual delay of the first event is difficult to abstract from the study, as comprehensive weather records are rarely provided. So, the delay listed in Table 6 has a relatively high uncertainty in many cases. This may explain why the delay of the first percolation event has no clear effect on the losses, except for the drastic examples shown in Table 6. The somehow erratic and uncertain nature of this parameter is underlined by the fact that there are various noncausal correlations with other parameters (Table 7).
Total losses vs. maximum concentrations in macropore flow
In the same way as described for the total losses, the maximum concentrations were statistically ana- lyzed. No statistically significant correlation could be derived with any environmental parameter. Even more than the total losses, the maximum concentrations depend on factors that are neither controlled nor recorded. They are assumed to be much more determined by the intensity of the first rainfall than by its duration. And, perhaps the fact most responsible for the impossibility to meaningfully interpret
![Table 2 Saturated hydraulic conductivity of soil constituents [1].](https://thumb-eu.123doks.com/thumbv2/1library_info/5141669.1660509/5.810.97.713.121.428/table-saturated-hydraulic-conductivity-soil-constituents.webp)