Whitehouse and Paul: An ABA-100 method for determining acetylator phenotype 533 J. Clin. Chem. Clin. Biochem.
Vol. 17, 1979, pp. 533-536
A Semi-automated Bratton & Marshall Micromethod for Determining Acetylator
Phenotype of Rabbits Using the Abbott Bichromatic Analyzer-100 By L. W. Whitehouse and C. J. Paul
Drug Research Laboratories, Drugs Directorate, Health Protection Branch, Health and Welfare Canada, Tunney fs Pasture, Ottawa, Ontario, CANADA K1A OL2
(Received August 21,1978/Februaiy 7,1979)
Summary: A micromethod for the determination of acetylator phenotype using the method of Bratton & Marshall ((1939) J. Biol. Chem. 128, 537-550) was adapted to the Abbott Bichromatic Analyzer (ABA-100). Advantages of this procedure include: (a) the requirement for small blood samples (20 ) making it a suitable pediatric method and eliminating the need for venipunctures;(b) elimination of tedious manual reading of absorbances of samples and mathematical manipulation of data by the automated capabilities of the ABA-100; (c) an increase in the accuracy of the assay by reading samples at two wavelengths thereby correcting for differences in background.
Eine halbautomatische Bratton & Marshall-Mikromethode zur Bestimmung des Acetylator-Phaenotyps von Kanin- chen mit dem Abbott Bichromatic Analyzer-100
Zusammenfassung: Eine Mikröinethode für die Bestimmung des Acetylator-Phaenotyps nach dem Prinzip von Brätton & Marshall ((1939) J. Biol. Chem. 128, 537-550) wurde an den Abbott Bichromatic Analyzer (ABA-100)
adaptiert. Die Vorteile dieses Verfahrens umfassen: (a) geringes Probenvolumen (20 Blut), weshalb die Methode für die Kinderheilkunde geeignet ist und Venenpunktion entfällt ;(b) Wegfall des ermüdenden Ablesens der Absorp- tionen der Proben und Datenverarbeitung durch die automatisierten Möglichkeiten des ABA-100; (c) eine Verbesse- rung der Analysengenaüigkeit durch Untergrundkorrektur infolge Messung bei zwei Wellenlängen.
Introduction
The N-acetylation of chemical agents with an aromatic amine character such as isoniazid, hydralazine, phenelzine, procainamide, nitrazepam, and sulfanilamide derivatives have been shown to exhibit a genetically controlled polymorphism in both animals and humans (1,2). This polymorphism in acetylation rate can alter the thera- peutic efficacy and toxicity of these and other chemical agents biotransforined by this metabolic pathway. For the purpose of treating individuals more effectively, evaluating toxicological data more thorougjtily and routinely phenotyping individuals in population genetic studies, a simple and rapid method of determining the acetylating ability of laboratory animals and/or humans using small blood samples would be desirable and useful.
In the course of our studies on the toxicity of isoniazid it became necessary to routinely determine the acetylator phenotype of rabbits. The method of Bratton & Marshall (3) using sulfadiazine as a substrate for the acetylating
enzyme, was scaled down to a micromethod and semi- automated by utilizing the Abbott Bichromatic Analyzer's (ABA-100) capability to automatically read samples at two wavelengths and convert the differences in absorbance ( ) to ^g sulfadiazine per milliliter of blood.
Materials and Methods Apparatus
An Abbott Bichromatic Analyzer-100 (ABA-100, Abbott Scienti- fic Products Division, South Pasadena, California, 91030) and a Cary-15 recording spectrophotometer equipped with a high- intensity light source (Applied Physics Corp., Monrovia, Cali- fornia, 91016) were used for all absorbance measurements.
Reagents
Sulfadiazine, sodium nitrite, N-1-naphthylethylenediamine dihy- drochloride, trichloroacetic acid and ammonium sulfamate were purchased from local suppliers. The sodium salt of sul- fadiazine was prepared by mixing equimolar concentrations of an ethanolic solution containing 80 g/1 sodium hydroxide with 0340-076X/79/0017-0533S02.00
© by Walter de Gruyter & Co. · Berlin · New York
534 Whitehouse and Paul: An ABA-100 method for determining acetylator phenotype an ethanolic solution of sulfadiazine. The resulting salt was
washed with ethyl alcohol and dried under vaccum. An aqueous stock solution of sodium sulfadiazine equivalent to 200 mg of sulfadiazine per liter was used for the preparation of working standards. The dosing solution, an aqueous solution of sodium sulfadiazine equivalent to 200 g/1 sulfadiazine, was administered at 0.1 ml/kg (20 mg/kg) over a 60 s time period in the marginal ear vein of male New Zealand White rabbits (1.8-3.5 kg) deprived of food for 16-18 h.
Procedure
Blood (20 μΐ) was collected with micropipettes (Microcaps, Drummond Scientific Co., Acadian Instruments Ltd., Etobi- coke, Ontario M9C 4V3) from the opposite ear vein at 20,40, 60,120, and 180 min after dosing with sulfadiazine and immediately transferred to 10 X 75 mm culture tubes containing 0.94 ml of water. Following complete hemolysis, proteins were precipitated with 0.24 ml of trichloroacetic acid (150 g/1) and the supernatants separated by centrifugation.
Aliquots (0.5 ml) of blanks, standards and sample supernatants were transferred to clean 10 X 75 mm culture tubes for the assay of free sulfadiazine. Reagent solutions were added to culture tubes using re/micropipettors (microre/pettor, Scientific Manufacturing Industries, Emeryville, California 94608). 50 μΐ of freshly prepared aqueous sodium nitrite (1 g/1) was added, mixed, and the solution allowed to stand for 3 min followed by 50 μΐ of ammonium sulfamate (5 g/1). After mixing again and allowing the mixture to stand for 2 min, 50 μΐ of an aqueous solution of N-1-naphthylethylenediamine dihydrochloride (1 g/1) was added. The contents were mixed, transferred to an ABA- 100 multicuvette and the color developed for 5 min then assayed with the ABA-100. The operating conditions for the ABA-100 were as outlined in table 1. For comparisons on the Cary-15 the assay was scaled-up by five-fold.
Tab. 1. Instrument settings for the ABA-100 for the assay of sulfadiazine.
Power Incubator Mode selection Reaction direction Analysis time Carousel revolution Filters
Syringe plate Sample size Decimal setting Calibration factor Zero
On30°C Endpoint Up5 min 2550/650 __ 000.0
Cone, of standard^ Λ c Absorbance (ΔΑ) 0000
For routine assays of blood for sulfadiazine the most convenient working standards were 1.667,0.833 and 0.333 mg/1 prepared respectively from 1.00,0.50 and 0.20 ml of stock sulfadiazine solution, 24 ml of trichloroacetic acid (150 g/1) and sufficient water to give a final volume of 120 ml. Blanks were similarly prepared with the exception that stock sulfadiazine was replaced with distilled water. When 0.50 ml of the sulfadiazine working standards were assayed as described above they repre- sented 100, 50 and 20 mg/1 of blood, respectively.
Data for the sulfadiazine standard curve and the sulfadiazine elimination curves from the blood were fitted by regression analysis using a Nova 800 minicomputer. Results obtained from the ABA-100 and the Cary-15 were compared using the unpaired Student Mest. Variance of the absorption coefficients were analyzed by an F-test.
Results and Discussion
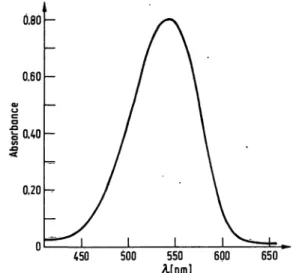
A scan of diazotized sulfadiazine between 450 nm and 650 nm showed a maximum absorption peak at 543 nm returning to the baseline at 650 nm (fig. 1). On the basis
of this observation the 550/650 filter supplied with the ABA-100 was chosen for the assay of sulfadiazine. Stan- dards equivalent to between 10 and 500 rrig of sulfadiazine per liter of blood were prepared in water and diazotized.
The bsorbance at 550 nm and the difference in absorb- ance (ΔΑ) at 550/650 nm were determined on the Cary-
15 and the ABA-100, respectively (fig. 2). Standard
Ο.ΘΟ
0.60
;0.40
0,20
450 500 550
Afnm] 600 650 Fig. 1. Representative scan of diazotized sulfadiazine. Sulfa-
diazine (3.85 mg/1 final concentration) was diazotized as indicated in the materials and methods and scanned with a Cary-15 recording spectrophotometer between 450 nm and 650 nm.
ca
ΙΛΟ 1.20 1.00 0.80 0.60 ΟΛΟ 0.20 0.0 ΙΛΟ 1.20 1.00 0.80 0.60 ΟΛΟ 0,20 0,0
"- α
100 200 300 500
100 200 300 400 Sulfadiazine, blood [mg/l] . 500 Fig. 2. Linearity of the standard curves assayed by a) the con-
ventional method (Cary-15, λ = 550 nm) and b) the described method (ABA-l 00, .filter 550/650). .
J. Clin. Chem. Clin. Biochem. / Vol. 17,1979 / No. 8
Whitehouse and Paul: An ABA-100 method for determining acetylator phenotype 535 curves with their slopes, Y-intercepts and correlation
coefficients were calculated (tab. 2). A statistical differ- ence in the slopes and the Y-intercepts of the two stan- dard curves could not be demonstrated. A slightly higher correlation coefficient was observed between the standard curve and the actual absorbance readings when the ABA-100 was employed, suggesting that the variance about the standard curve was less when the assay was per- formed with the ABA-100. Examination of the molar absorption coefficients (e) calculated from data obtained with the two instruments indicated that the e values were not significantly different, however the variance of e was found to be statistically smaller (F-test) with the ABA-
100 (tab. 2). The higher correlation coefficient and the smaller variance observed with the ABA-100 was probably the result of (a) the elimination of the human error associated with the manual estimation of absorb- ances with the Cary-15 and (b) the bichromatic features of the ABA-100.
The coefficient of variation (CV) for the determination of sulfadiazine in blood using the ABA-100 is presented in table 3. The overall CV was found to be 2.78% indi- cating this method to be a precise and reliable method for the determination of sulfadiazine in blood.
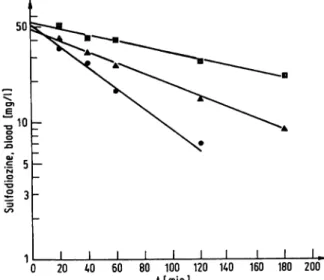
Using the ABA-100 method, sulfadiazine elimination pro- files from the blood of male New Zealand White rabbits were examined. Typical elimination profiles from slow, medium and fast acetylator rabbits with the corre-
Tab. 2. A comparison of the standard curves from the Cary-15 and the ABA-100.
Slope ± SE Y-intercept Correlation coefficient Molar absorption coefficient (e) ± SE
Cary-15 0.002498 0.000015 0.01107 0.00347 0.99957 50826
679
ABA-100 0.002489 0.000013 0.01478 0.00337 0.99966 51317
371
Probability*
NS NS
NS
Variance of e CV[%]
11.52 X 10⁶ 3.45 Χ 106 0.002 6.68 3.62
a Variance of e analyzed by F-test. All other comparisons were made using the unpaired Student Mest.
Tab. 3. Estimation of the precision of the ABA-100 method for the determination of sulfadiazine.
Concentration (mg/l) 400200
10050 10
n
55 5
Absorbance ± SE 1.028 ±0.005 0.5 30 ±0.004 0.273 ± 0,001 0.133 ±0.002 0.031 ±0.001
CV 1%) 0.981.58 3.151.64 6.56
sponding halflife, correlation coefficient and the elimin- ation rate constant (k) and its standard error are presented in figure 3. The frequency distribution of sulfadiazine half- life in 137 rabbits is illustrated (fig. 4). Two groups of animals were differentiated by a half-life antimode at 60 to 70 min confiimingFrymoyer&Jacox's (4) earlier finding.
The intravenous route of administration of sulfadiazine was used in both this study and that ofFrymoyer &
Jacox (4) and would be preferable for all phenotyping studies since the effect of absorption upon the apparent elimination rate from the blood could be avoided. How-
50
.οg ί 5Ο
'•Ό
= 3
l _L
20 40 60 80 100 120 140 t i m i n ]
160 180 200
Fig. 3. Typical sulfadiazine elimination profiles from the blood of aslow (o, k = 0.00514 ± 0.0036 min·1; r = 0.9927;
11/2 = 135 min),
medium (A, k = 0.00943 ± 0.00038 min'1; r = 0.9975;
11/2 = 74 min) and
fast (·, k = 0.01805 ± 0.00293 min"1;! = 0.9870;
tj/2 = 38 min)
acetylator male New Zealand White rabbit following the intravenous administration of sulfadiazine (20 mg/kg).
The elimination rate constant (k) and its standard error, the half-life of free sulfadiazine ti/2 and the correlation coefficient (r) for each of the animals were computed following regression analysis of the data from the ABA-100.
10
E 6
30 50 70 90 110 130 150 170 190 210 Sulfadiazine half-life [min]
Fig. 4. Frequency distribution of sulfadiazine halflife in 137 male New Zealand White rabbits assessed by the described ABA-100 method.
J. din. Chem. Clin. Biochem. / Vol. 17, 1979 /No. 8
536 Whitehouse and Paul: An ABA-100 method for determining acetylator phenotype
ever, intravenous administration of sulfadiazine or in fact any chemical agent to humans is associated with an additional patient-risk (hepatitis) and technological difficulties (the skills of a doctor or qualified nurse to make the actual intravenous injection). Recently Weber
& Brenner (5) and Hoo et αϊ (6) have published methods for the determination of acetylator phenotype in humans following oral administration of sulfamethazine, a dimethyl analogue of sulfadiazine. Since sulfadiazine and sulfamethazine are rapidly absorbed at similar rates from the gastrointestinal tract (7), it would appear that when circumstances dictate the oral route of sul- fadiazine administration could be used to assess the acetylator phenotype of individuals. If the oral route of sulfadiazine administration is to be used to phenotype humans then the blood collection times must be ad- justed so that they fall on the elimination phase of the
blood profile curve. According to Olson etal(8), with a 10 mg/kg dose of sulfamethazine the absorption phase was complete by 3 hours. To prevent extended waiting periods for ambulatory patients and facilitate the pheno^
typing procedure, the number of blood collections could be reduced to two samples, perhaps a 3 and 4 hour sample. Since only 20 μΐ blood samples are required for the assay, blood could be collected from finger or heel
punctures avoiding the difficulties associated with venipunctures and making this a microsemi-au torn ate d method suitable for large scale population genetic studies.
The modified Bratton & Marshall method described above offers a number of advantages over existing methods:
(a) The requirement for small blood samples (20 μΐ) makes this a suitable pediatric method whereby sufficient blood can be obtained from a finger or heel puncture.
(b) The capabilities of the ABA-100 to automatically read absorbances and express results in terms of mg of sulfadiazine per liter of blood reduces the assay time considerably and circumvents tedious manual calculations.
(c) Absorbance differences in the baseline due to tur- bidity or cloudiness are corrected by the fact that samples are examined at two wavelengths (550/
650 nm) with the ABA-100 and the assay based on the differences between these two absorbance reading.
(d) By using the pharmacokinetic approach instead of a single blood sample, phenotype misclassification, a real possibility (9), is minimized.
References
1. Evans, D. A. P. (1968), Ann. N.Y. Acad. Sei. 151, 723-733.
2. Lunde, P. K. M., Frislid, K. & Hansteen, V. (1977), Clin.
Pharmacokinetics2,182-197.
3. Bratton, A. C. & Marshall, E. K. (1939), J. Biol. Chem. 128, 537-550.
4. Frymoyer, J. W. & Jacox, R. F. (1963), J. Lab. Clin. Med.
62, 891-904.
5. Weber, W. W. & Brenner, W. (1974), Am. J. Hum. Genet. 26, 467-473.
6. Hoo, J.-J., Hussein, L. & Goedde, H. W. (1977), J. Clin.
Chem. Clin. Biochem. 15, 329-331.
7. Weinstein, L. (1970), In The Pharmacological Basis of Therapeutics, (Goodman, L. S. & Gilman, A. eds.), pp. 1177- 1203, The MacM lan Company, Toronto.
8. Olson, W., Miceli, J. & Weber, W. (1978), Clin. Pharmacol.
Ther. 23, 204-211.
9. Weber, W. W., Miceli, J. N., Hearse, D. J. & Drummond, G. S.
(1976), Drug Metab. Dispos. 4, 94-101.
Dr. L. W. Whitehouse Drug Toxicology Division Health Protection Branch Health and Welfare Canada Tunney's Pasture, Ottawa Canada, K1AOL2
J. Clin. Chem. Clin. Biochem. / Vol. 17, 1979 / No. 8