Human Factors as Causes for Road Traffic Accidents in the Sultanate of Oman under Consideration of Road Construction Designs
Inauguraldissertation zur Erlangung des Doktorgrades (Dr. phil.) der philosophischen Fakultät II (Psychologie, Pädagogik und Sportwissenschaft) der Universität Regensburg
Vorgelegt von Kai Plankermann
Burglengenfeld 2013
1 Erster Gutachter: Prof. Dr. phil. Dr. h.c. Alf Zimmer
Engineering Psychology Unit, University of Regensburg Zweiter Gutachter: Prof. Dr. rer. nat. Mark W. Greenlee Institute of experimental Psychology, University of Regensburg
2 Acknowledgement
I would like to express my deepest gratitude to my advisor Professor Alf Zimmer for accepting me as his PhD student and for providing me with his continuous support. I would also like to thank Dr.
Abdullah Al-Maniri who supported me throughout the data collection in Oman. Also, I owe my gratitude to Aisha Al-Belushia who conducted the interviews at Ibra Hospital. Finally, I would like to thank the following persons for contributing to this thesis in one way or another and apologize to those I forgot to mention.
The Engineers Altayeb Al-Harthi, Muhammad Al-Hosny (both Muscat Municipality) and Saleh Al- Shukaili (Directorate General for Road and Land Transportation) for providing the road data; the Drs.
Muhamad Zaheerudeen (Khoula Hospital), Salem Al-Abri (Nizwa Hospital) and Ali Al-Dawi (Ibra Hospital) for facilitating the data collection at the hospitals; the Engineers Jochen Zimmermann (IJK Associates), Jens Aalund, Klaus Andersen (both COWI) and Jürgen Piel (STRABAG) for fruitful discussions about road safety in Oman; Muhamad Al-Aamri, Mahmud Al-Khatri, Yousuf Al-Rawahi and Mazin Al-Wahibi for helping me during the data collection; Chantal Blake and Amanda Amarotico for proofreading first drafts of this thesis; Dr. Montasser Abdelghani for translating the German questionnaire into Arabic; my Nissan X-Terra for being a reliable and most importantly safe companion while travelling the ten thousand kilometers through Oman to collect the data for this thesis; and, last but not least, I would like to thank my wife Marlene and my daughter Lina for their patience as well as my parents for their support.
3
“Academic work needs to follow rules of good practice, but we should not confuse rigor with tediousness or objectivity with lack of personality. Academics are still ‘human after all’ – to quote
Daft Punk. And beyond the barren scientific facts that academics produce, they have a life, an upbringing, a cultural context they inhabit, with opinions and passions (Hassenzahl, 2010).”
4
Table of contents
Executive summary ... 8
Part I: Introduction ... 10
1. The global burden of RTAs... 10
2. RTAs in Oman ... 10
3. RTA research ... 11
3.1 The system approach ... 12
3.2 Education, enforcement and engineering ... 13
4. Objectives and structure ... 14
Part II: Theory and literature review ... 18
1. The human factor ... 18
1.1 The driving task ... 18
1.2 Driving and attention ... 20
1.2.1 Mental overload ... 20
1.2.2 Mental underload ... 22
1.3 Driving and perception ... 23
1.3.1 Speed perception ... 23
1.3.2 Time to collision ... 25
1.3.3 The Useful field of view (UFOV) ... 26
1.3.4 Where do drivers look and what do they see? ... 27
1.4 Information processing... 31
1.4.1 Bottom-up and top-down processing ... 31
1.4.2 Situation awareness and schemata ... 32
1.5 Driver behavior models ... 36
1.5.1 Risk threshold models ... 36
1.5.2 Compensation models ... 37
1.5.3 Risk avoidance models ... 38
2. Road design ... 39
2.1 The driving task and the road design ... 39
2.2 Road categorization ... 41
2.3 The self-explaining road (SER) ... 42
2.4 The forgiving road... 46
5
2.5 Design elements ... 47
2.5.1 Design and posted speed ... 47
2.5.2 Sight distance ... 51
2.5.3 Road signs ... 55
2.5.4 Road markings ... 59
2.6 Road location elements ... 61
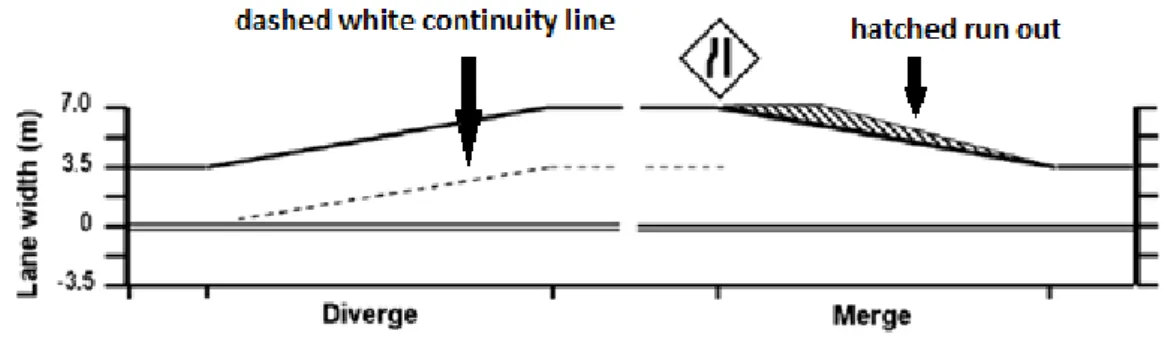
2.6.1 Transitions ... 61
2.6.2 Intersections ... 69
2.6.3 Horizontal curves ... 73
2.6.4 Straight sections ... 76
2.6.5 Roundabouts ... 80
Part III: Human factors ... 83
1. Methods ... 83
1.1 Data collection ... 83
1.1.1 Ethical approval ... 83
1.1.2 Participants and selection criteria ... 83
1.1.3 Location and period of data collection ... 84
1.1.4 The questionnaire based interview ... 85
1.1.5 Data handling... 87
1.2 Data analysis ... 87
2. Results ... 88
2.1 General results ... 88
2.1.1 RTAs per months ... 88
2.1.2 Road users ... 89
2.1.3 Nationalities ... 90
2.2 RTA types ... 91
2.3 Technical factors ... 92
2.4 Bivariate analysis ... 93
2.4.1 Common factors ... 93
2.4.1.1 Age ... 94
2.4.1.2 Intoxication ... 95
2.4.1.3 Inappropriate speed ... 96
2.4.1.4 Insufficient safety distance ... 98
2.4.1.5 Driving experience ... 98
2.4.2 Perception ... 101
6
2.4.2.1 Visibility ... 101
2.4.2.2 Obstructed view ... 103
2.4.2.3 Unintended blindness ... 103
2.4.3 Attention... 104
2.4.3.1 Fatigue ... 104
2.4.3.2 Distraction by technical device... 105
2.4.3.3 Distraction by non-technical device ... 106
2.4.3.4 Conversation... 107
2.4.3.5 Emotions ... 108
2.4.4 Cognition ... 109
2.4.4.1 Self-assessment of driving skills ... 109
2.4.4.2 Safety of own car ... 109
2.4.4.3 Route familiarity ... 110
2.4.4.4 Dangerous driving ... 111
2.4.4.5 Impatience ... 111
2.4.4.6 RTA history ... 112
2.5 Multivariate analysis... 112
2.5 Main human factors and RTA types ... 114
Part IV: Human road interaction ... 115
1. Methods ... 115
1.1. Data collection ... 115
1.1.2 Interview data and evaluation of RTA scene ... 115
1.1.3 Muscat Municipality and Directorate General of Road and Land Transport data ... 116
1.1.4 Complementing missing data ... 116
1.1.4.1 Curves ... 117
1.1.4.2 Intersections ... 117
1.1.4.3 Roundabouts ... 118
1.1.4.4 Roadside development (urban and rural roads) ... 120
1.2 Data analysis ... 121
1.3 Confounding and interaction... 125
2. Results ... 125
2.1 Specific objective one ... 125
2.2 Specific objective two ... 129
2.3 Specific objective three ... 130
2.3.1 Self-reported speed on straight sections ... 130
7
2.3.2 Self-reported speed on T-intersections and curves ... 133
2.4 Specific objective four ... 133
2.4.1 Straight sections ... 135
2.4.1.1 Straight sections and fatigue ... 135
2.4.1.2 Straight sections and speed ... 136
2.4.1.3 Straight sections and conversations ... 138
2.4.2 T-intersections ... 139
2.4.2.1 T-intersection and unintended blindness ... 139
2.4.3 Curves ... 140
2.4.3.1 Curves and speed ... 140
2.4.4 Roundabouts ... 142
Part V: Discussion and recommendations ... 144
1. General discussion ... 144
2. Design recommendations ... 150
2.1 Applying basic design standards on road design ... 150
2.2 Considering dual carriageways and overtaking lanes ... 151
2.3 Capturing the road users’ attention is insufficient for safe transitions ... 153
2.4 Reducing speed and restricting affordances at T-intersections ... 154
2.5 Improving visual guidance in curves ... 155
2.6 Marking roundabouts according to different categories ... 156
3. Behavioral adaptations and safety audits ... 157
4. Limitations ... 159
4.1 Interview data... 159
4.2 Road data ... 160
4.3 Culpability analysis ... 160
4.4 The effect of adjacent road location elements ... 160
5. Concluding remarks ... 161
Appendix A ... 162
Appendix B ... 170
Appendix C... 179
Appendix D ... 188
References ... 190
8
Executive summary
The Sultanate of Oman has one of the highest road traffic accident (RTA) related fatality rates worldwide (Al Lamki, 2010). Since Sultan Qaboos addressed this issue in a speech in October 2009, research institutions, ministries and NGOs alike have strengthened their efforts to cope with this public health burden. Yet, still little is known about the factors contributing to the high number of RTAs.
Evidence from research conducted in other countries suggests that the human factor and the interaction between the human factor and the road environment are among the most frequent contributors to the occurrence of RTAs. The ultimate goal of this thesis was therefore to provide recommendations on how to adjust the road design to the human factor. In order to meet this goal, two objectives were determined, namely to identify the main human factors that contribute to the occurrence of RTAs in Oman and to investigate the human road interaction as a contributing factor to the occurrence of RTAs in Oman.
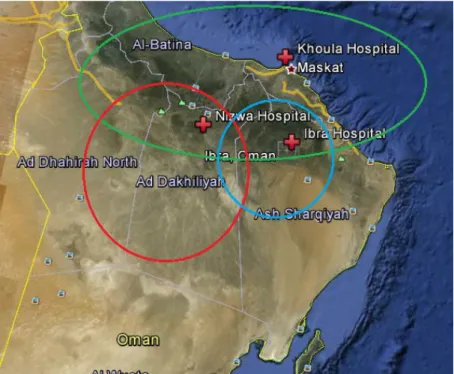
A total of 296 in-depth interviews were conducted in three Omani hospitals with road users who were involved in RTAs. The data collection took place between April 2011 and May 2012. Road and environmental information were collected by visiting the RTA locations and using Google earth. In addition, road data for each RTA location was requested and provided from Muscat Municipality and the Directorate General of Road and Land Transport.
For the first objective, identification of the main human factors that contribute to the occurrence of RTAs in Oman, the study on human factors conducted by Gründl (2005) was replicated. The results revealed five human factors that significantly increase the risk of causing an RTA in Oman. These factors are according to the strength of their impact: (1) inappropriate speed, (2) fatigue, (3) unintended blindness, (4) annual mileage between 20.000 and 40.000 km and (5) having a conversation with the passenger.
The second objective, investigation of the human road interaction as a contributing factor to the occurrence of RTAs in Oman, was split into four specific objectives. These objectives addressed the extent to which roads in Oman can be considered self-explaining, the subjective perceived safety of roads, road design elements that affect driving speed and the prevalence of selected human factors according to road design elements.
For the first specific objective, the extent to which the Omani road design corresponds to the recommendation on self-explaining roads suggested by Matena (2006) was investigated. It was found
9 that none of three recommendations are met and concluded that this discrepancy may add to the occurrence of the human factor inappropriate speed.
For the second specific objective, a logistic regression analysis was calculated with the dependent variable subjectively perceived safety of a road and various design elements as independent variables. The results indicate that the number of carriageways is the only design element that predicts subjectively perceived safety of a road.
For the third specific objective, correlations and linear regression models were calculated with self- reported speed as a dependent variable and various road design elements as independent variables.
It was found that speed is significantly higher in rural environments. The effects of lane and shoulder width on speed differ between rural and urban environments. Interestingly, driving speed did not correlate with the number of carriageways.
For the fourth specific objective, the prevalence of human factors according to various design elements was investigated using logistic regression models. Among others, the regression models revealed that the human factor fatigue occurs more frequently on roads with dual carriageway and that inappropriate speed occurs more frequently on curves without warning signs. Contrary to previous studies (Werneke & Vollrath, 2012), it was found that the human factor unintended blindness occurs more frequently at T-intersections characterized with a high traffic volume than at T-intersections with a low traffic volume.
Based on a discussion of the findings, the suggested recommendations focus on the following aspects:
Applying basic design standards on road design.
Considering dual carriageways and overtaking lanes.
Capturing the road users’ attention is insufficient for safe transitions.
Reducing speed and restricting affordances at T-intersections.
Improving visual guidance in curves.
Marking roundabouts according to different categories.
This thesis is the first scientific work that has investigated the role of human factors and their interaction with the road environment in the causation of RTAs in a Gulf country. Although specific recommendations are suggested, this thesis is to be considered a source for future research rather than a design guideline
10
Part I: Introduction
1. The global burden of RTAs
Road traffic accidents (RTAs) are a global public health problem. Currently ranked ninth, RTAs are predicted to be the fifth leading cause of death in 2030. Every year, more than one million people die worldwide because of RTAs, more than 2500 deaths every day. 90 % of RTA related fatalities occur in low and middle income countries (WHO, 2004).
2. RTAs in Oman
Until recently, the Sultanate of Oman was listed as middle income country (WHO, 2009). Due to its oil and gas wealth, Oman has experienced rapid social and economic modernization within the last decades. This development included an increase in the motorization rate and a growing road network. In 1970, only 1016 vehicles were registered in Oman and only three km of the roads were paved. In 2009, the number of registered vehicles and the number of paved road km has grown to 755.000 and 53.000, respectively (Al-Maniri, Al-Reesi, Al-Zakwani, & Nasrullah, 2012). This growth was accompanied by an increase in the number of RTA related fatalities (Al-Reesi et al., 2013). With around 30 deaths per 100,000 persons, Oman has one of the highest RTA related fatality rates worldwide (Al Lamki, 2010). Although the number of fatalities decreased in 2010, it increased in 2012 by more than 30 % (Figure 1.1). Due to increasing employment and more people obtaining driving licenses, it is likely that the rate of RTA related fatalities will further increase.
Figure 1.1. Number of road traffic deaths in Oman per year from 2001 – 2012. Note that Oman has only 2.7 Million inhabitants. Data from ROP (2012).
400 500 600 700 800 900 1000 1100 1200
1 2 3 4 5 6 7 8 9 10 11 12
11 To date, only little is known about the factors underlying this high number of road traffic related deaths. According to the Royal Oman Police (ROP), the main contributing factors are risky driving behavior (e.g. speeding and overtaking), vehicle defects, road defects, weather condition and fatigue (Al-Maniri et al., 2012; ROP, 2012). A recent study conducted by Al-Reesi et al. (2013) has confirmed that risky driving in general and aggressive violation of traffic regulations in particular are major risk factors.
A road inventory survey carried out in 2005 (DGRLT) to assess the existing road network and to provide required improvement components for future planning revealed that only 49.3 % of the surveyed roads were in a good condition, 43.7 % were in a fair condition and 5.5 % and 1.5 % were in a bad and very bad condition, respectively. In addition, it was found that a portion of the road network lacked functional categorization. Black spots - road locations with a high RTA frequency - were identified as major contributor to RTAs in Oman. Insufficient shoulder width and poor pavement of some road sections were listed as further contributing factors.
In order to cope with this public health problem, an action plan was developed by the Omani authorities in 2010. In addition to that, road safety campaigns from both governmental and non- governmental organizations have been launched, a new Highway Design Standard has been published and an up-to-date RTA database is currently being developed. The number of recently published papers on this issue and the establishment of a research institute devoted to RTA related research indicate the ambitions of both governmental institutions and scientists to further understand the factors contributing to this burden. Despite these efforts much more research is needed, but what should the scope of this research be?
3. RTA research
Research on RTAs has a long tradition in Western countries (USA, Europe, and Australia). Basically, there has been research ever since there have been motorized vehicles. In low and middle income countries, road safety research is still in its infancy and researchers argue whether or not it is possible to apply road safety measures from Western high income countries in low and middle income countries (Bishai, Asiimwe, Abbas, Hyder, & Bazeyo, 2008; King, 2005). Despite cultural and developmental factors that need to be considered in this debate, there is little reason to doubt that it is not possible to refer to basic frameworks in order to improve road safety in low and middle income countries. Two well established frameworks are the system approach and the triple E approach (Enforcement, Engineering and Education).
12
3.1 The system approach
According to the system approach, the occurrence of RTAs can be ascribed to various contributing factors, namely the human, the vehicle and the road environment. As shown in Figure 1.2, the three factors (human, vehicle and road environment) as well as their interactions vary in the strengths of their contribution. The strongest factor is the human (95.4 %) (Table 1.1) followed by the environment (Table 1.2) and the human – road environment interaction (HRI) with 44.2 % and 34.8
%, respectively.
Since the human factor contributes to 90 % of all RTAs, one may conclude that revoking the driver’s licenses from accident prone drivers would be an adequate measure to improve road safety. This measure would be in line with an approach known as the person approach (Reason, 2000) or the accident prone individual approach (Hacker, 2005). Both approaches, however, are controversial and won’t lead to an improvement in road safety. First of all, there is statistical evidence that excluding accident prone drivers from road traffic wouldn’t yield the desired outcome (Gründl, 2005; Hacker, 2005). Secondly, it would mean to isolate the human factor from the system context, thereby ignoring the remaining contributing factors (Reason, 2000). Yet, this is not to say that it would be unscientific to only investigate one of the three factors.
To better understand the difference between system and individual focused approaches, imagine the following situation. A driver is approaching an intersection. There is a bus-stop in close proximity to the intersection. The driver enters the intersection and collides with a vehicle coming from the right.
When being questioned by the police, the driver reports that he or she thought he or she had the right of way. The police officer, however, points to a stop sign telling the driver that he or she should have seen the stop sign. Followers of the person (accident prone driver) approach would, most likely, argue that the road traffic collision occurred because the driver didn’t pay attention to the scene ahead. Otherwise, he or she would have seen the stop sign. Followers of the system approach, on the other hand, would investigate the pre-crash phase of the collision. The first question they would most likely ask is why didn’t the driver perceive the stop sign? It is well documented in human factor research that a driver’s attention is often captured by those objects that pose the greatest threat at a given moment (e.g. Undeutsch, 1962). Recall that there was a bus stop in close proximity to the intersection. The driver might have paid attention to a bus parking at the bus stop, as the bus was perceived as a possible hazard. Consequently, the driver might not have perceived the stop sign. In this particular example, it can be argued that the road design was faulty. A bus stop should not be in close proximity to intersections. Hence, beside the human factor (attention), the factor environment contributed to the collision.
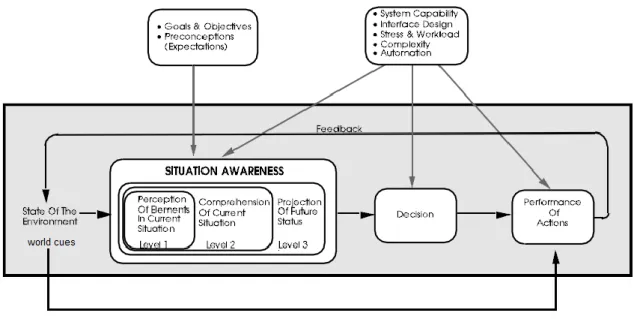
13 When talking about the system approach, a human factors researcher can't but refer to Reason and his famous Swiss Cheese model (Reason, 1997, 2000). According to Reason (2000), a system contains various safeguards and each safeguard can be thought of as a layer. With regard to the three factors the system road traffic consists of, each factor can be considered a potential safeguard (Figure 1.3).
Ideally, each layer would be intact. If one of these layers is not intact (has a hole), a RTA is likely to occur. With regard to the previous mentioned example, the safety layers environment and human were not intact. The extent to which each layer was not intact requires a close examination of the situation that lead to the RTA.
Figure 1.2. The distribution of how the three factors human, vehicle and (road) environment contribute to the occurrence of RTAs (Treat et al., 1977). The overlapping areas indicate the interaction of the three factors. Note that this distribution is based on North-American data. The percentages might be different in low and middle income countries.
3.2 Education, enforcement and engineering
This approach will simply be referred to as the triple E approach (Pease & Preston, 1967;
Zimmermann, 2009). Education refers to road safety education and ranges from awareness campaigns to driver training and education. Enforcement requires that authorities like traffic police ensure that road users comply with traffic regulations. Engineering focuses on the road design, layout and maintenance. The triple E approach suggests that in order to decrease the number of RTA related fatalities, systematic improvements in each of the aforementioned areas is necessary. Akin to the system approach, the interactions of the three areas of the triple E approach need to be taken into account. This interaction is demonstrated in a study conducted by Mutto et al. (2002). The researchers investigated the effect of an overpass for pedestrians in Kampala (Uganda). The construction of the overpass didn’t lead to a reduction in the number of RTAs involving pedestrians.
Whereas most pedestrians knew that the purpose of the overpass was to reduce the number of RTAs
14 involving pedestrians, some people believed that the overpass was only meant to assist children and elderly. Although the majority of pedestrians were aware of the overpass’s purpose, they refrained from using it because they argued that taking the overpass was too time consuming. This account clearly suggests that construction measures do not necessarily improve road safety unless they are accompanied by education and enforcement.
Figure 1.3. Reason’s Swiss Cheese model adapted to the three factors human, vehicle and environment. The human factors could, for example, be errors in perception, vehicle factors could be break failure and environmental factors could be lack of traffic separation or incomprehensible road signs.
4. Objectives and structure
Which of the three contributing factors should be considered for research and which of the three areas from the tripe E approach should be covered? As the main contributing factor, it would be recommended to focus on human factors. Only few studies on human factors have been conducted in low and middle income countries in general and in Oman in particular (e.g. Al Reesi et al., 2013).
When focusing on human factors it would be of high value to take into account a second factor. Such an approach would not only yield research results of two contributing factors, but also allow the investigation of the extent to which these factors interact.
Oman is a relatively rich country. However, large parts of the populations are not able to afford vehicles that comply with up to date safety standards, especially those living and working in rural areas. Consequently, the benefits of investigating the human – vehicle interaction which would result in recommendations on how to improve vehicle safety, would only be limited. Roads on the other hand are built and financed by the government. Focusing on the HRI and recommending methods to improve the road design in current and future layouts therefore appears to be the more valuable option. The importance of investigating road design as a contributing factor has also been
15 emphasized by the road inventory survey carried out in 2005 and by a more recent unpublished survey carried out by the Muscat Municipality in 2012.
Table 1.1. Human factors according to different categories contributing to the occurrence to RTAs as identified in various studies. Note that the categories are interrelated. For example, cognitive factors such as emotions are associated with factors related to attention such as distraction.
Categories General Attention Perception Cognition
Examples Speed (Gründl, 2005; D. Shinar, McDonald, &
Treat, 1978;
Undeutsch, 1962; Vollrath, Briest, Schießl, Drewes, &
Becker, 2006), Intoxication (D.
Shinar et al., 1978;
Undeutsch, 1962), Age (Undeutsch, 1962), Driver experience (D.
Shinar et al., 1978; Staubach, 2009)
Mental overload (distraction)(Hendricks, Fell, & Freedman, 2001; Otte & Kühnel, 1982; Undeutsch, 1962; Vollrath et al., 2006), Fatigue (D.
Shinar et al., 1978) and / or Mental underload (Hendricks et al., 2001;
Otte & Kühnel, 1982;
Vollrath et al., 2006)
Reduced vision (Hendricks et al., 2001; D. Shinar et al., 1978;
Undeutsch, 1962), Time to collision (TTC) (Undeutsch, 1962), Wrong focus (Staubach, 2009), Stimulus masking
(Staubach, 2009)
Activation of wrong schema (Hendricks et al., 2001; Malaterre, 1990;
Undeutsch, 1962), Emotions (D. Shinar et al., 1978),
Impatience (D.
Shinar et al., 1978), Navigation errors (Gründl, 2005)
Another argument that supports the decision to focus on HRI is that researchers and engineers alike generally agree that considering human factors in the design of roads leads to a significant improvement in road safety. The U.S. Transportation Research Board claims:
“Despite a widespread acknowledgement that traffic safety reflects the consideration and integration of three components - the roadway, the vehicle, and the roadway user - the information needs, limitations, and capabilities of roadway users are often neglected in traditional resources used by practitioners. In short, existing references applicable to road system design do not provide highway designers and traffic engineers with adequate guidance for incorporating road user needs, limitations, and capabilities when dealing with design and operational issues. (Campbell, Richard, &
Graham, 2008, p. 1.1)"
16 The ultimate goal of this thesis is therefore to provide recommendations for engineers on how to adjust the road design to human factors, thereby systematically contributing to the engineering aspect of the triple E approach, or, using Reason’s terminology, to improve the safety layer road. In order to meet this goal, two objectives are defined:
1. To identify the main human factors that contribute to the occurrence of RTAs in Oman.
2. To investigate HRI as contributing factor to the occurrence of RTAs in Oman.
The second objective is further structured into four specific objectives:
To assess the degree to which roads in Oman can be considered self-explaining.
To identify predictors for the subjectively perceived safety of a road.
To identify road design elements that affect driving speed (for a definition of design element see part II, 2.5).
To identify possible relationships between the occurrence of main human factors and road design elements.
This thesis is structured into five parts.
Part I: Introduction
Part II provides an extensive theoretical overview on human factors (e.g. Table 1.1), road design (e.g.
Table 1.2) and HRI.
Part III provides the methodology and results of a study that was conducted to address objective one.
This study is to a great extent based on a previous study on human factors conducted by Gründl (2005).
Part IV provides the methodology and results of a study that was conducted to address objective two. This study consists of four investigations each of which intended to address one of the four specific objectives.
Part V provides the discussion of the main findings and the design recommendations. An overview on road designs in which the human factor was not taken into account is provided in the Appendix.
Furthermore, the limitations of this thesis will be discussed.
17 Table 1.2. Road and environmental factors that are associated with RTA risk as identified in three different studies.
Road and environmental factors
Jennings & Demetsky (1983)
Fildes et al.
(1987)
Becher et al. (2006)
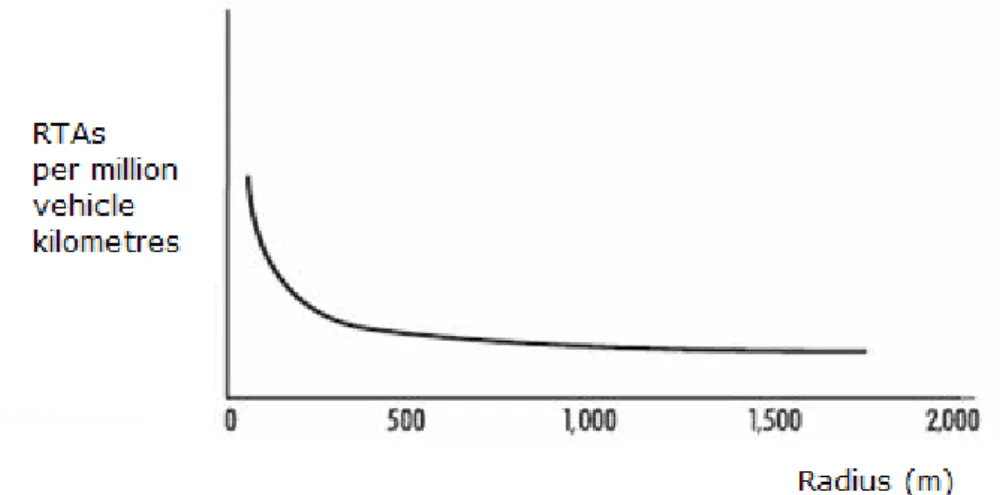
Curve radius Yes Yes Yes
Road and lane width Yes Yes Yes
Intersecting roadways or driveways
Yes Yes Yes
Road markings and delineators
Yes Yes Yes
Cognitive
characterization of road
No No Yes
Transition from road to intersection
No No Yes
Urban or rural
environment (Roadside development)
- Yes -
Sight distance Yes Yes Yes
Roadsidedevelopment Yes Yes Yes
18
Part II: Theory and literature review
1. The human factor
1.1 The driving task
Driving is a complex task. In order to understand how the human factor is associated with the occurrence of RTAs, it is necessary to understand this task. A well-established theoretical approach to distinguish between different aspects of the driving task is the synthesis of the task hierarchy model (Michon, 1985) and Rasmussen’s skill, rule and knowledge framework (Rasmussen, 1983, 1985).
Figure 2.1. The association between task hierarchy model (Michon, 1985) and task performance (Rasmussen, 1983, 1985). See text for explanation.
According to the task hierarchy model, the driving task can be divided into three levels: strategic, manoeuvring and control level. The strategic level is the navigation level; strategic level tasks might involve planning the route including the trip goal (highway A or highway B, turning left or right at the next intersection) as well as problem solving (finding alternative routes) (Becher et al., 2006; Michon, 1985). At the manoeuvring level, gained behavior-sequences (schemata, see 1.4.2) are executed (Becher et al., 2006). Examples for the manoeuver level would be turning, responding to traffic signs or overtaking. A wrong analysis of the situation ahead could lead to the activation of a wrong schema. The lowest level, the control level, is responsible for automatized tasks such as maintaining stable vehicle control. The driver controls speed and the leading headway (longitudinal control) as well as the position in the lane (lateral control) through shifting, braking, steering, etc.
19 Each level can be attributed to the level of task performance (Figure 2.1) as proposed by Rasmussen in his skill, rule, and knowledge framework. The knowledge based level comes into play in new, unfamiliar situations. At the knowledge based level, actions have to be planned on-line (Reason, 1990). In this situation, the action is goal oriented. The person needs to analyze the environment in order to find ways and / or methods to reach his or her goal. The knowledge based level corresponds with the strategic level. The rule based level is controlled by stored rules. The rule or schema is
"retrieved from memory simply on the basis of previous successful experience (Theeuwes, 2001, p.
244)". Although rule based behavior is also goal oriented, it is structured through "feed forward"
control through a stored rule. The goal might not be formulated, but found in the situation releasing the stored rules (Rasmussen, 1983). Errors usually occur when the situation is misclassified. Rule based behavior corresponds with the manoeuver level. At the skill based level, behavior represents sensory-motor performance during activities which take place without conscious control. According to Rasmussen (1983), the main difference between rule based actions and skill based actions is that at the higher level, rule based behavior coordination is generally based on know-how and that the person is able to report the applied rules. Errors at the skill based level are associated with intrinsic variability of force, space or time coordination (Reason, 1990). Skill based behavior corresponds to tasks at the control level.
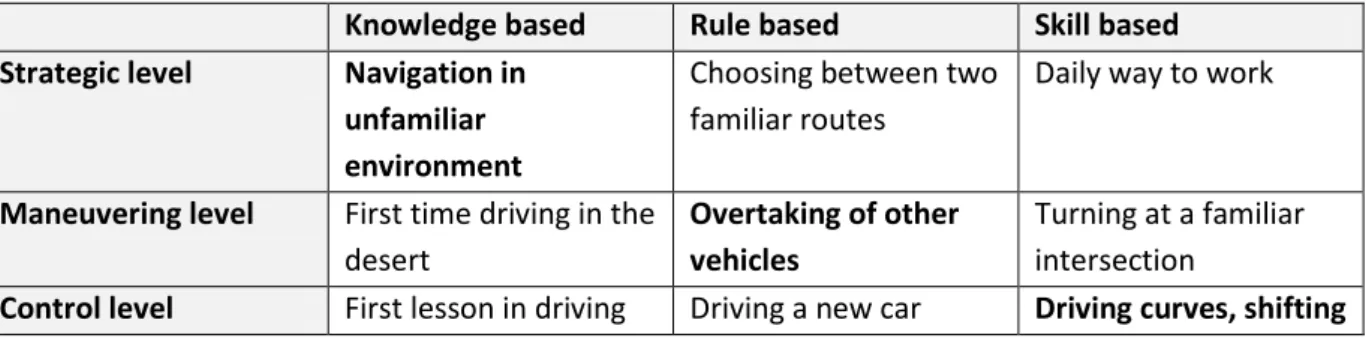
Driving tasks are not necessarily attributed to a specific level / behavior (Table 2.1) (Gründl, 2005). An experienced driver who is driving in an unfamiliar environment would perform tasks such as shifting at the control / skill based level and tasks such as turning at an intersection at the maneuver/rule based level. The more the driver gets familiar with the environment, the task turning at the intersection would move to the next lower level (control / skill level). Another example would be a novice driver who performs a task such as gear shifting at the knowledge based level, as he or she is not yet familiar with the gears. With increasing driving practice, the task will move to the next level.
Table 2.1. Relation between task hierarchy and the skill, rule, and knowledge framework (modified version from Gründl, 2005). The bold printed tasks are the most common tasks. Note that these are just examples. Whether or not one of the tasks can really be considered to be at a specific task and driving level depends on various factors, see also Hale et al. (1990).
Knowledge based Rule based Skill based Strategic level Navigation in
unfamiliar environment
Choosing between two familiar routes
Daily way to work
Maneuvering level First time driving in the desert
Overtaking of other vehicles
Turning at a familiar intersection
Control level First lesson in driving Driving a new car Driving curves, shifting
20 school
1.2 Driving and attention
Driving requires the driver's full attention. Generally, attention can be divided into mental overload and mental underload (Brookhuis & De Waard, 2010; De Waard & Brookhuis, 1991); the former leading to distraction, the latter to state of drowsiness.
1.2.1 Mental overload
Mental overload occurs when drivers have to attend to more one than one task. Any additional task has an adverse effect on driving. Various studies have for example demonstrated that a secondary task such as mobile phone usage or listening to the radio causes a decrease in brake reaction time (Brookhuis et al. 1994, Irwin et al. 2000, Consiglio et al. 2003). Consiglio et al. (2003) report that mean reaction time while using a mobile phone was 0,072 sec. higher when compared to the control condition (no mobile phone usage). Considering that every hundredth of a second can reduce stopping distance by 0,25 m at 90 km/h, (Warshavsky-Livne & Shinar, 2002), the interference (distraction) caused by a secondary task explains whether a driver is able to react in a timely fashion or not.
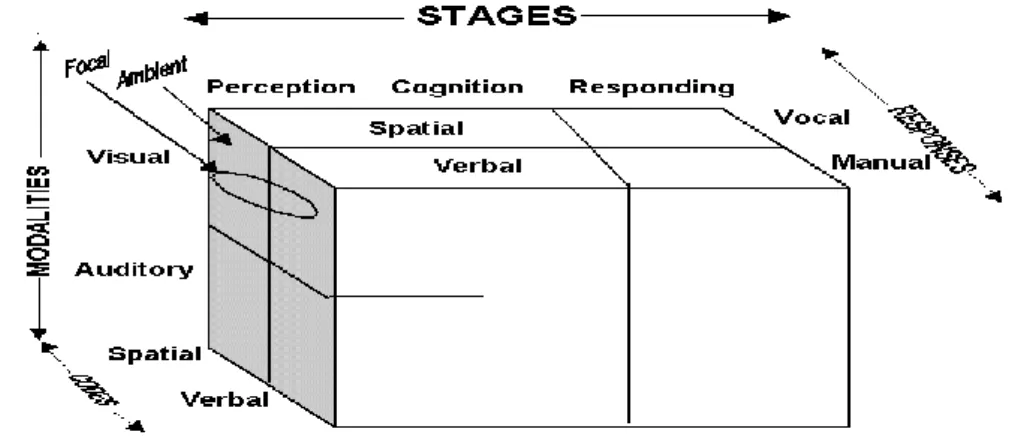
Figure 2.2. Multiple Resource Model (MRM) by Wickens (2002), modified version.
Wickens' Multiple Resource Model (MRM) (Figure 2.2) is a prominent model for explaining task interference (Wickens, 2002, 2003, 2008). Wickens assumes that human attentional capacity should be understood as multiple resource pools with dual task interference being greatest when tasks compete for similar processing resources and least when tasks draw from different resources (Matthews et al. 2008). The MRM consists of three dichotomous dimensions. The processing stages describe cognitive and perceptual activities (working memory, for example). The perceptual
21 modalities are categorized into visual and auditory. The processing codes are divided into spatial and verbal processes. Figure 2.3 illustrates the application of the MRM on the dual task driving and mobile phone usage.
According to a study conducted by the National Highway Safety Administration of the USA (2000), most RTAs that are associated with mobile phone usage occur due to the mental demand during the conversation and not due to the visual and motor processes like dialing or typing. Evidence to support these results can also be found by Consiglio et al. (2003). Interestingly, Consiglio et al. also found that the usage of hands-free phones deteriorates performance to the same extent as usual mobile phones. With reference to the MRM, these findings indicate that mobile phone usage and driving compete for mental resources rather than for the manual response. However, assuming that the mobile phone would be used for writing text messages, visual and motor processes would be required to a greater extent.
To which extent the driver is distracted depends on the driver him- or herself, how demanding the respective task is and the driver's willingness to engage in the task (Ranney et al. 2000). In other words, the proportion of mental capacity an operator is willing to allocate (Pauzié, 2009). The willingness or motivational factors to engage in a task is lacking in Wickens' model. He therefore recommends understanding what drives the allocation policy. In a laboratory, allocation policy is often driven by primary and secondary task instructions, but why someone would use a mobile phone while driving a car remains unclear (Wickens, 2008). Furthermore, the task level at which the driving task is executed should be considered. As skill and rule based behavior is less sensitive to secondary tasks, drivers might be more likely to engage in behavior that is detrimental for road safety.
Note that multiple resource theory and mental workload are two related concepts that are often confused. They overlap but are distinct (Wickens, 2008). With regard to this thesis, they have been introduced together for illustrative purposes.
Figure 2.3. The green fields in the left cube illustrate the resources for the driving task. Visual perception is required, the coding is spatial and the responses are manual. The blue fields (center)
22 illustrate the resources required for the mobile phone usage. Auditory perception is required and the responses are vocal and manual, as the driver talks and holds the phone in his or her hand at the same time. The cube on the right side illustrates where both tasks interfere with each other. Mobile phone usage and driving compete for the same resource (Humboldt University Berlin, department for Engineering-Psychology). With permission.
1.2.2 Mental underload
A lack of mental demands can result in mental underload, which can be as detrimental to performance as overload (Branscome & Grynovicki, 2007). Mental underload is especially likely to occur when the driving environment is predictable. While safe handling of a car requires a sustained level of alertness, the aforementioned factor leads to the opposite (Mets et al., 2011).
Mental underload is associated with a phenomenon referred to as “highway hypnosis” (Tejero &
Chóliz, 2002). The term highway hypnosis was first introduced by Williams (1963). Williams postulated that prolonged driving in a monotonous environment leads to a trance like state. This state, in turn, leads to drowsiness. He argues that mainly monotony as well as bright points of fixation are circumstances that have always been used to hypnotize people. Williams’ assumptions were questioned years later by Wertheim (1978). Wertheim, however, didn’t reject Williams’ theory that there are other states than fatigue leading to drowsiness, but rather Williams’ explanation.
According to Wertheim, monotony is not easily measured and not necessarily a contributing factor to the phenomenon of highway hypnosis. He therefore proposed a different explanation for this phenomenon. Wertheim’s starting point is the distinction between two different mechanisms of oculomotor control, namely attentive and intentive. “The attentive component refers to retinal feedback and the intentive component refers to the intention to move our eyes (Wertheim, 1978, p.
112).” Long prolonged driving in a predictable environment in which most of the present stimuli are not relevant to the driving task could lead to an increase of the intentive component at the expense of the attentive component. In a series of experiments, Wertheim demonstrated that an increase of the intentive component is associated with lowered alertness. As a consequence, a driver might no longer be able to detect changes in the lateral position of his or her vehicle. In short, Wertheim concludes that highway hypnosis is not induced by the degree of monotony, but rather by the degree of predictability: “A very monotonous road situation does not necessarily imply a very predictable one, as for example when driving in heavy fog. In that situation it is most unlikely that highway hypnosis develops (Wertheim, 1978, p. 128).” Another important aspect in Wertheim’s argumentation is that highways are more predictable than secondary roads. Hence, highway hypnosis is less likely to occur on secondary roads. This assumption has partially been confirmed by
23 Cerezuela et al. (2004). For a more comprehensive overview on mental alertness and monotonous environments see Thiffault and Bergeron (2003).
The conclusion from the preceding sections can be summarized as follows:
Provide information on different attentional levels. For example, rumble strips are perceived haptically and thus relieve the visual attentional level.
Mental underload is associated with predictability rather than monotony.
The road environment affects the mental demand.
1.3 Driving and perception
1.3.1 Speed perception
Inappropriate speed is among the main RTA risk factors. Rigorous and smart law enforcement is one way to control speeding behavior (Zimmermann, 2009). Research, however, has demonstrated that there are other ways to affect the road users' speeding behavior by affecting the road users' perception.
How does a driver perceive the speed he or she is traveling at? It could be argued that a driver checks the speedometer more or less frequently. Recarte and Nunes (2002), however, provide some evidence that contradicts this notion. The two researchers demonstrated that drivers tend to choose an optimum preferred speed in order to minimize mental effort dedicated to speed control. If drivers don't refer to the speedometer to regulate their speed, how do they control their speed? There are three factors that determine the perception of ego-speed, namely Edge Rate, Global Optic Flow Rate (Chatziastros, 2003; François, Morice, Bootsma, & Montagne, 2011; Larish & Flach, 1990; Recarte &
Nunes, 2002) as well as the Contrast and the Spatial Frequency in a scene (Blakemore & Snowden, 1999; Distler & Bülthoff, 1996; Johnston & Clifford, 1995; Pretto & Chatziastros, 2006; Stone &
Thompson, 1992; P. Thompson, Brooks, & Hammett, 2006).
The Edge Rate "corresponds to the number of texture elements that pass by the observation point in a given visual direction in a unit of time and is expressed in edges per second (François et al., 2011, p.
215)," hence the name Edge Rate. If a driver is driving through an alley, the Edge Rate would correspond to the unit of time at which the driver passes a tree. The shorter the distance between the trees or the higher the speed the driver is travelling with, the higher the edge rate. Edge Rate thus depends on texture density, but it is independent from eye height (François et al., 2011). There are some studies in which the role of Edge Rate on road safety has been investigated. Fajen (2005a)
24 for example reports that a decrease in texture density / Edge Rate has a negative effect on brake reaction time. Manser and Hancock (2007) modified the texture of tunnel walls by applying different visual patterns. The participants of their study decreased speed when decreasing width visual patterns were applied to the tunnel walls, but increased their speed under increasing width conditions. Manser and Hancock thus confirmed the results of a study conducted by Denton (1980) almost three decades earlier. Further studies on the effect of Edge Rate have been conducted by Anderson et al. (1999), Lewis-Evans and Charlton (2006) and Bing et al. (2008). Note, however, that despite these positive effects, Chatziastros (2003) points out that these effects might be temporary and that drivers return to their preferred speed as soon as they get familiar with the new situation.
In terms of the perception of ego-motion, the Edge Rate is similar to the effect of the Spatial and Contrast Frequency (Chatziastros, 2003). The difference is that the Edge Rate refers to salient objects in the environment with a high contrast. The effect of Spatial and Contrast Frequency on the perception of ego-speed tends to be stronger in the peripheral than in the foveal vision (Jamson, Lai, Jamson, Horrobin, & Carsten, 2008). Blakemore and Snowden (1999) found that a decrease in contrast leads to a decrease in perceived speed. Snowden et al. (1998) conducted an experiment in order to investigate how drivers perceive speed under foggy conditions. The participants increased their speed when the scene got foggier. The authors concluded that the drivers thought that they were driving slower due to the low contrast condition caused by the fog and therefore increased their speed. Pretto and Chatziastros (2006), however, argue that Snowden et al. produced unrealistic fog conditions in their driving simulator. Under real fog conditions, the contrast is exponentially reduced with distance which leads to higher perceived speeds. Pretto and Chatziastros (2006) were able to confirm this theory. They conducted an experiment in a driving simulator, in which the participants had to drive under normal and foggy conditions. Indeed, the participants reduced their speed under the foggy conditions. Pretto and Chatziastros concluded that fog masks distal portions of the scene, leaving only the proximal parts with higher angular velocity visible. The Global Optic Flow Rate will thus indicate a higher speed.
"The Global Optic Flow Rate is the optical velocity of ground surface texture elements in a given visual direction, and is proportional to observer speed assuming constant eye height (Fajen, 2005b, p. 740)" Unlike the Edge Rate, Global Optic Flow Rate depends on eye height. Yet, it is independent of texture density (François et al., 2011). This fact has some interesting implications for road traffic.
Drivers of large vehicles such as SUVs or trucks perceive speed differently than drivers of saloon cars (Fajen, 2005a; Rudin-Brown, 2004). Furthermore, this effect of Global Optic Flow Rate could affect speed perception when driving on a bridge. The effect of eye height on speed perception when Global Optic Flow Rate is investigated depends on the angular velocity. The angular velocity of an
25 object close to the center of the visual field is small, but the angular velocity of an object in the far periphery of the visual field is large. In the case where the driver's eye height above the road is reduced, the angular velocity in the peripheral visual field increases and indicates higher speeds (Jamson et al., 2008; Zimmermann, 2009). In other words, the closer the objects to a moving person, the higher the angular velocity and the higher the perceived speed.
It is difficult to say which of the three aforementioned factors has the strongest impact on the perception of ego-speed. Research results indicate that Edge Rate is the most important determinate (Chatziastros, 2003; Larish & Flach, 1990).
1.3.2 Time to collision
The time to collision (TTC) is defined as the time required for two vehicles to collide if they continue on the same path at their present speed (Hayward, 1972). For example, a vehicle traveling at 110 km/h and a second vehicle approaching from behind traveling at 130 km/h. Given that both vehicles maintain their current speed, they would eventually collide. The two vehicles would also collide if the second vehicle decelerates to 120 km/h and the first vehicle decelerates to 110 km/h. Hence, the driver of the second vehicle always has to adjust his or her speed to the speed of the preceding vehicle. Researchers have therefore attempted to investigate how drivers estimate TTC.
One of the most prominent models to investigate TTC is Lee's tau dot model. The tau dot model is a theory about the visual control of braking. The expansion rate of the retinal image of a stationary object that a driver is driving towards (the visual variable tau) specifies when the driver will collide with the object. By changing the speed, the driver can change the rate of expansion of the retinal image (tau dot = time derivative of tau) (Groeger, 2002; Lee, 1976). As long as the driver maintains tau dot within specific bounds, he or she is able of perform a controlled stop.
Hoffmann & Mortimer (1994) investigated the ability of a driver to estimate TTC when two vehicles are in motion. The participants in their study were presented with film segments that showed the driver's perspective in a car that was approaching a lead vehicle on a freeway. The participants were asked to indicate when the vehicle would have collided with the rear end of the lead vehicle. Special emphasis was given to the angular velocity. In order to judge TTC accurately, the angular velocity with which the visual angle subtended by the lead vehicle changes must exceed a threshold of 0.003 radians/sec (Hoffmann & Mortimer, 1994). If the angular velocity is above the threshold, short viewing times are sufficient in order to estimate TTC. Otherwise, the driver needs to detect spacing changes from which he or she can infer the speed of approach. In a tailgating situation, the distance between the two vehicles is rather short. Accordingly, TTC is low. Hoffmann & Mortimer have shown
26 that at low TTC values, drivers usually underestimate TTC. Nevertheless, the authors reported only a small percentage of occasions in which the participants overestimated TTC. Overestimating TTC would eventually lead to rear end collisions.
Gratzer (2009), with reference to Harvey &Michon (1971) also investigated TTC. Gratzer's findings confirm the importance of the threshold as reported by Hoffmann and Mortimer. Additionally, Gratzer argues, correct estimates of TTC depend on the observation period which has to be at least 0,2 sec. This time span complies with the time between two saccades (fixation duration). Given that the threshold is exceeded and the driver is not visually distracted, he or she should be able to estimate TTC appropriately. Furthermore, Gratzer reports that the threshold of the angular velocity has to be higher when the distance to the other vehicle is shorter and the difference in speed between the two vehicles is smaller. Correct speed estimation depends on the speed variance. The lower the variance is, the higher the likelihood for correct estimations (Zimmermann, 2009).
Caird and Hancock (1994) investigated TTC at intersections. The authors conducted an experiment in which 48 participants had to estimate TTC of vehicles within a traffic intersection scene. The results revealed that participants generally underestimated TTC. Women had significantly lower values than men. However, men were significantly more accurate at estimating TTC of motorcycles and trucks.
The researchers further report a significant main effect for distance. The closer the vehicles was, the more accurate TTC estimation.
1.3.3 The Useful field of view (UFOV)
The UFOV is defined as "the region of the visual field, from which information can be acquired without any movement of the eyes or the head (Ball, Beard, Roenker, Miller, & Griggs, 1988) and consists of the central and peripheral vision (Ball, Owsley, Sloane, Roenker, & Bruni, 1993). The size of the UFOV varies, as it depends on a multitude of factors like luminance level, light wavelengths, stimulus salience and the execution of secondary tasks.
Objects are most likely to be perceived when displayed within the center region of the UFOV (Dahmen-Zimmer & Zimmer, 1997). Factors that add to the detection probability will be described in 1.3.4. The peripheral region is also crucial to the driving task (Cohen, 2009). Peripheral vision has a sort of "alarm function". Objects can be detected in peripheral vision leading to an appropriate eye movement and a fixation of the object with the central (foveal) vision. Road characteristics such as road markings and lane width can be controlled by peripheral vision. Lastly, as elaborated in 1.3.1, peripheral vision is important for speed perception.
27 The UFOV deteriorates with age (Ball et al. 1990), when a secondary central task is added (Wood et al., 2006), under monotonous driving conditions (Rogé et al., 2004) and in addition to sleep deprivation (Rogé, Pébayle, Hannachi, & Muzet, 2003). The age related deficiencies can be compensated by experience or specific training up to the age of 75 (Cohen, 2009). The deterioration of the UFOV usually causes a "tunnel vision" (Rogé et al., 2003; Rogé, Pébayle, Kiehn, & Muzet, 2002) and is often considered a contributing factor for RTAs. Allahyari et al. (2007) conducted an experiment in which they investigated UFOV limitations in 90 drivers. They found that a 40 % reduction of the UFOV increased the risk of accident involvement regardless of age. Similar results are reported in a review conducted by Cohen (2009). Despite these seemingly dangerous reduction of the UFOV, Cohen argues in the same article that a deterioration of the UFOV can also be regarded as a useful selection process through which objects are only displayed on the fovea which allows a faster processing of the perceived information. In this regard, the UFOV limitation is a mechanism of avoiding "information overload".
1.3.4 Where do drivers look and what do they see?
It was argued in the previous section that the UFOV is the region of the visual field that can be acquired without any movement of the head or the eye. A person performing a task such as driving does not normally just stare ahead. In fact, humans scan the environment by moving their eyes.
These eye movements are guided by attention. Only in few cases, attention is captured by stimuli perceived in the peripheral vision; a process that would lead to a head movement (Dahmen-Zimmer
& Zimmer, 1997). The conditions that are required to attract the observer's attention are referred to as singularities. Singularities are stimulus configurations which are more salient than other stimuli in the environment (Braun & Sagi, 1990; Dahmen-Zimmer & Zimmer, 1997). According to Dahmen- Zimmer and Zimmer (1997), these singularities are:
Dynamic singularities: Movements in front of a background that changes in accordance with the motion parallax.
Geometric singularities: Stimulus configurations such as Y- or arrow-connections or semiotic singularities such as perceived curvature.
Symbolic singularities: Symbol or text information (only perceived within 30 degrees left / right of the visual field).
A combination of these singularities would yield the best results in terms of detection probability (Dahmen-Zimmer & Zimmer, 1997). In addition to that, there is evidence that singularities can be perceived parallel to focal visual attention (Braun & Sagi, 1990). These assumptions suggest, for
28 example, that human visual scanning behavior is not guided by conspicuous colors – an assumption that has been confirmed by Theeuwes and colleagues. The researchers (Theeuwes, Atchley, &
Kramer, 2000) conducted a number of experiments in which they asked participants to find a red circle among green circles. Although the red circle was more conspicuous than the green circle, the participants started searching randomly. These results indicate that even conspicuous road signs can be overseen by road users unless they search for the respective sign. Findings supporting this conclusion were reported by Hughes and Cole (1984). The researchers also demonstrated that commercials attract the road users' attention more than traffic signs (Hughes & Cole, 1986). It thus appears that drivers don't perceive all elements of a traffic scene that might be necessary to drive safely.
There are two other phenomena confirming this notion. Firstly, Dahmen-Zimmer and Zimmer (1997) point out that movements are processed in relation to reference systems. They argue that a cyclist who is riding behind a parking vehicle might not be perceived as a moving object but rather as partial movement within a texture which is only perceived with peripheral vision (Appendix A, Figure 1). As a consequence, the cyclist doesn't constitute an attractor leading to an appropriate head movement.
Secondly, some elements of a traffic scene might not be perceived by a driver - a phenomenon that is referred to as change blindness. "Change blindness is defined as the inability to detect changes made to an object or a scene during a saccade, flicker blink or movie cut...change blindness is especially pronounced when brief blank fields are placed between alternating displays of an original and modified scene (J. K. Caird, Edwards, Creaser, & Horrey, 2005, p. 236)." This technique is generally known as Flicker technique (Simons & Levin, 1997). A few studies have been conducted in which the flicker technique has been modified to investigate drivers' attentional capabilities at intersections (Batchelder, Rizzo, Vanderleest, & Vecera, 2003; J. K. Caird et al., 2005; Edwards, Caird, & Chisholm, 2008). In these experiments, participants are generally presented with a series of pictures. The first picture is grey. The second picture shows a traffic scene, usually an intersection. The third picture is grey and is meant to represent the saccade, etc. The fourth picture shows the traffic scene.
Sometimes, however, this traffic scene has been modified. After being presented with the series of pictures, the participants have to make the decision whether they would turn or not. Research has shown that turn decision accuracy is associated with age (Batchelder et al., 2003; J. K. Caird et al., 2005), but not with experience. Novice drivers showed the same turn decision accuracy as experienced drivers (Edwards et al., 2008). It was also demonstrated that longer gaze duration are related to greater turn decision accuracy and that accuracy was greater when vehicles were the changing objects (Edwards et al., 2008). Edwards et al. (2008), however, believe that the detection of vehicles as changing objects is not related to the object size. It is possible that objects are rather detected because, unlike pedestrians, they pose a greater hazard (Undeutsch, 1962).
29 Thus far, it can be concluded that road users do perceive certain features unconsciously, while the majority of perceived information depends on the drivers' visual attention. Nevertheless, it is possible that important elements of a scene are not perceived. It is noteworthy that the perception of information depends to a great extent on driver experience (yet, as shown in the previous paragraph, there appears to be no relationship between driver experience and the effects of change blindness). Experienced drivers, for example, are more capable of keeping the vehicle in the lane when focal visual attention is not directed to the road markings than novice drivers (Heikki Summala, Nieminen, & Punto, 1996). The next paragraphs will provide more information on the drivers' gaze preferences.
Mourant & Rockwell (1970) investigated the effects of route familiarity and driving conditions (open road vs. car following) on visual scanning patterns of experienced drivers. Their results revealed that the driver's visual scanning systematically depends on the task to be performed. In the scenario where drivers were not familiar with the road, their fixations were widely dispersed and rather concentrated above and on the right side of the road, those sites where they were expecting road signs. As soon as the drivers were familiar with the road, their scanning behavior moved far down the road, "where drivers can obtain information with maximal lead time (Shinar, 2008: 381)". In a second study, Mourant & Rockwell (1972) compared visual screening patterns of novice drivers to screening patterns of experienced drivers. In contrast to experienced drivers, novice drivers' fixations were distributed on a much smaller part of the visual scene and mostly direct on the road in front of the car, on the right side of the road, as well as on road markings. Furthermore, novice drivers used rear and side mirrors less frequently than experienced drivers.
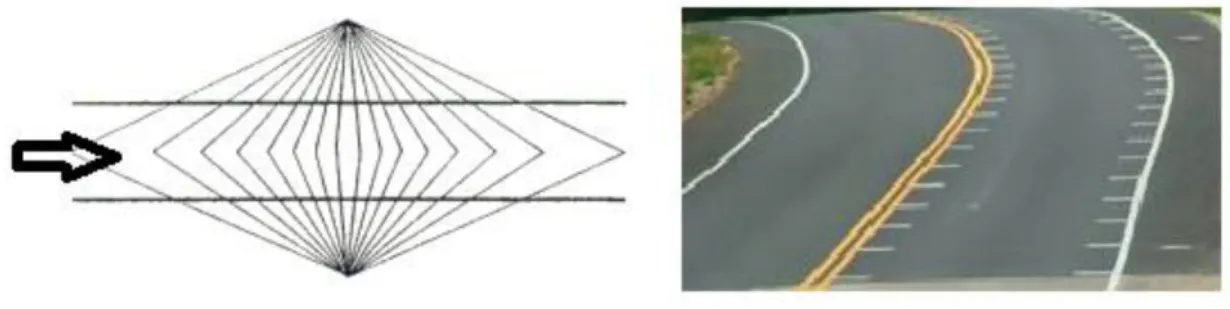
Research on visual behavior in curves has shown that drivers look at the tangent point (Figure 2.4) on the inside of the curve (Land, 2001; Land & Lee, 1994; Mars, 2008). "The tangent point is the point where the driver’s line of sight is tangential to the road edge or centre line, and it moves around the curve with the driver (Land, 2001, p. 227)". Drivers start searching for the tangent point about 1-2 seconds before entering the curve and return looking at it many times while passing through it. This visual strategy allows the driver to predict the curvature of the curve (Underwood, Chapman, Crudall, Cooper, & Wallen, 1999). Interestingly, the fixation of the tangent point takes more time in curves with high RTA frequency compared to curves with a low RTA frequency (Appendix A, Figure 2).
Becher et al. (2006) conclude that the longer fixation period is associated with a higher mental demand. According to Land (2001), drivers behave differently to near and far regions of the road:
"When only the far part of the simulated road was visible, drivers matched curvature well, but their lane keeping performance was poor; and when only the near part was visible lane keeping was better, but steering was unstable and jerky (p. 232)." Land concludes that the near and the far region
30 provide different and complementary information. "The distance region (including tangent points where visible) supplies feed-forward information about the future curvature of the road, and the near region supplies feedback information about position in lane (p. 233)." The near and the wide region have also been taken into account by Kandil et al. (2010). The researchers argue that drivers tend to look at the end of the curve when they attempt to partially leave the lane (cut the curve). The amount of gazes to the tangent point further depended on openness (defined as sight distance at the start point of the curve segment) and curvature. The stronger the curvature or the lower the values of openness, the more often drivers looked at the tangent point. Lastly, the researchers demonstrated that road users tend to look more often at the tangent point in right-hand curves than in left-hand curves. Given the importance of tangent points for curve driving, this finding would explain why RTAs occur more frequently in left-hand curves than in right-hand curves. Curves will be further discussed in 2.6.3.
Figure 2.4. The tangent point, the point drivers tend to fixate when negotiating a curve. Modified version from Mestre (2001).
Werneke and Vollrath (2012) investigated the influence of intersection characteristics on visual attention. The authors found that the intersection characteristics have an effect on how drivers allocate their visual attention. For example, at intersections with a low traffic volume, drivers tend to gaze less often to the left before making a right turn compared to intersections with a high traffic volume. Werneke and Vollrath also found that since drivers pay more attention to the traffic at complex intersections, RTAs are more likely to occur at less complex intersections. Note, however, that the authors only considered a small number of independent variables. Intersections will be further discussed in 2.6.2.
A few important conclusions can be drawn from the aforementioned studies. The most important one is that visual screening patterns seem to be systematic depending on groups (e.g. novice vs.
experienced drivers) and scenarios (e.g. straight road vs. intersection). Also, novice drivers apparently compensate their missing experience by referring to road markings and traffic signs (at the right side of the road). They also seem to be visually overloaded (Shinar, 2008). Experienced
31 drivers, on the other hand, look further down the road to detect possible hazards in time. Both findings will be essential when discussing the role of road markings and traffic signs later on. It should be mentioned that although eye tracking systems have been improved within the last years, Mourant & Rockwell's results were confirmed by other studies. A good overview on their work and the replication of their findings is provided by Shinar (2008). Moreover, visual behavior in road traffic has occasionally been considered in design principles such as "do not place intersections on curves"
(Appendix A, Figure 3). "The flow of visual information for drivers on a curve is at different speeds for the left and right eyes. On curve to the left, the flow of information is faster for the driver's right eye than for the left eye. As a result for this difference, drivers are less able to judge the relative speeds of cars on an intersecting road at the end of their curved path (Basacik, Luke, & Horberry, 2007, p.
17)."
The conclusion from the preceding section can be summarized as follows:
The road environment has a large impact on speeding behavior.
Certain features can be used to affect the drivers' speeding behavior.
In general, road users are able to correctly estimate TTC. This estimation, however, depends on various factors like secondary tasks or speed variance between two vehicles.
Road users are likely to oversee important elements of a traffic scene. Therefore, important elements have to be designed in a way that considers human limitations, captures the road users' attention and are in accordance with the road users' expectations (e.g. place a road sign where road users would expect it).
Avoid elements at the outer side of a curve that might capture the road users' attention.
Note, however, single chevrons have a positive effect on both speed perception and guidance.
Consider differences in visual search behavior among different groups of road users.
Do not place intersections on curves.
1.4 Information processing
1.4.1 Bottom-up and top-down processing
The senses are the human's window to the world (Cohen, 2009). The most important sense for the driving task is vision. About 90 % of all information required for the driving task is perceived visually (Sivak, 1996). Yet, good vision isn't a sufficient condition for safe driving (Cohen, 2009). Perception can be divided into two processes, namely bottom-up and top-down processing. Bottom-up (stimulus