telligent Miner
HizirSofyanand Axel Werwatz 1
1
InstitutefurStatistikund
Okonometrie,HumboldtUniversitat
zu Berlin,Spandauer Str. 1, 10178,Berlin
Summary
This paper is anexample of data mining in action. Thedatabase we are
miningcontains1085prolesofindividuals whohavedownloadedthesta-
tistical softwareXploRe. Each prole contains theresponses to an online
questionnairecomprised of questions about such thingsas anindividuals'
computing preferences (operating system, favourite statistics software) or
professionalaÆliation. After formatting and cleaning the rawdata using
MS Excel,weuseIBM'sIntelligent Minerto perform aclusteranalysis
ofthedownloadproles.
Wetrytoidentifyasmallnumberof\types"ofusersbyemployingacluster-
ingalgorithmbasedontheNewCondorcetCriterion, which isparticularly
well-suited for our all-categorical data. We identify three clusters in the
mining run: Academia,Unix/Linux users and Researchers. The three
variabelsthataremostimportantinidentifyingtheclustersareanindivid-
ual'skindofwork,thewayheorshegottoknowXploReandtheoperating
systemofhis orhercomputer.
Recently,thecapabilitytobothgenerateandcollectdatahasbeenexpanded
enormouslyand providesus with hugeamountsof datathat are often rou-
tinely collected during daily operations. To store, organize and access the
data powerful and aordable database management systems are available
(Ha,1998).
Theaimofdataminingisto-intelligentlyandautomatically-extractuse-
fulinformationfrom these databases. It triesto discoverpatterns andrela-
tionshipshiddeninthedatausingsuitablestatisticalmodelsandtechniques.
Thus,dataminingmayyieldprotableresultsforalmosteveryorganization
thatcollectsdataonitscustomers,markets,productsorprocesses.
Thispaperisanexampleofdatamininginaction. Thedatabaseweare
miningcontainstheprolesofindividualswhohavedownloadedthestatisti-
calsoftwareXploRe. XploReisaimedatsophisticateduserswhoarelooking
for a exible, programmable statistics package with an emphasis on more
advanced procedures (Hardle, 1999). It is thereforeparticularly important
for the makersof XploReto get to know those who are interested in their
product.
BeforeafreetrialversionofXploRecanbe downloaded, customersare
askedinanonline questionnairetoprovideinformation, forinstance,about
their identity, occupation and computing preferences. The raw data thus
consistsof1085multivariateprolesofindividualswhodownloadedXploRe
betweenNovember1,1999andOctober31,2000.
Ourminingrunconsistsofthefollowingsteps:
organizeandcleantheASCII rawdatawithMS Excel
transferthedatatoIBM'sIntelligent Miner
performaclusteranalysisof thedownloadproles
In the cluster analysis, we try to identify a small number of "types"
of users. We identify three clusters: Academia, Unix/Linux users and
Researchers. Thethreevariabelsthataremostimportantinidentifyingthe
clustersareanindividual'skindofwork,thewayshegottoknowXploReand
theoperatingsystem(Windows,Unix,..) forwhich shedownloadedXploRe.
Theremainderof thepaperis organizedasfollows. Inthenextsection,
we describe the online questionnaire used to collect the data and how the
rawdatawasorganizedandcleaned. Beforeweturnto thecluster analysis,
wesummarizethedata andexplainourchoiceof miningsoftwareandclus-
teringalgorithm. Thisisfollowedbyadiscussionoftheresultsofthecluster
analysis. Thenal sectionconcludes.
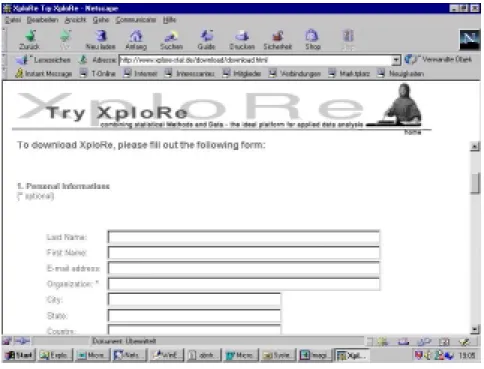
Figure1: Personal Questions
2 The data
2.1 Getting the data
ThoseinterestedinthestatisticalcomputingenvironmentXploRecandown-
loadafreetrial versionfrom its homepage. All versions of XploRe(except
for the Linux local version) are demo-versions that expire after about two
months,arelimitedto 1000observations anddonotinclude allofXploRe's
featuresandcommands. TheLinuxlocalversionhasnoexpirationdateand
nolimitonthesizeofthedata.
Beforetheactualdownloadisstarted,customersareaskedtointeractively
provideinformationabouttheiridentity,computingpreferences,etc.
TherstpartoftheonlinequestionnaireisshowninFigure1. Customers
arepromptedtotypeintheirname,aÆliationandaddress. Alloftheseitems,
exceptfortheaÆliation,mustbeansweredto beableto downloadXploRe.
Wewill refertothis groupofquestionsas"personalquestions".
The nextset ofquestions isshownin Figure 2. Users areaskedto pro-
videinformation onthe kind of worktheyneed XploRefor, the waythey
learnedaboutXploRe(get information)and thestatistical software
theycurrentlyuse. Allthesequestions areansweredbyselectingitemsfrom
alistofpossibleresponses. Answeringthemisnotrequiredfordownloading
Figure2: SubstantiveQuestions
XploRebuttheiroptionalcharacterisnotexplicitlyrevealed. Theresponses
tothese questionswillplayaprominentrolewhenwetrytoform groupsof
homogeneoususers. Thisis thereasonforreferringtothemas\substantive
questions".
Thelastpartofthequestionnaire,notshownheretosavespace,contains
rather "technical" questions. Users have to select the version of XploRe
they would like to download. They can choose from a list of operating
systems (Windows, Linux, etc.) and between the local version of XploRe
and the Java-Client-only version. They also can opt to subscribe to the
XploRemailinglist.
As partof thedownloadprocedure,thedateandIP-addressareauto-
matically recorded. The raw data thus consists of multivariateproles for
1085individualswhodownloadedXploRefromNovember1,1999toOctober
31,2000.
2.2 Cleaning the data
Eventhemostsophisticatedstatisticalmethodswilldelivererroneousresults
ifthedataareofpoorqualityorsimplywrong: "garbagein,garbageout",as
thesayinggoes. Wethereforethoroughlycleanedtherawdatabeforeusing
Those that download XploReclearly would like to complete the down-
loading process as swiftly as possible and probably prefer to be asked no
questionsatall. Ifaskedtoomany,toocomplicated,ortoocuriousquestions
people mightgetannoyedandgivewrongorincompleteanswers.
InthecaseofXploRe,thereareonlyafew\substantive"questionsand,as
showninFigure2,theyarealleasytoanswer.Buttheyarepreceededbythe
mandatoryquestionsonauser'sidentitytowhichquiteafewpersonsgavean
intentionallywronganswer. Wetookobviouslyfalseanswerstothe"personal
questions"asindicatorsthattheanswerstothe"substantivequestions"may
alsobewronglyanswered. Suspiciousobservationswereinspectedone-by-one
anddroppedaccordingtoaset ofcriteria.
It should be pointedout, that this part of thedata mining process can
hardlybemadefullyautomatic. Therearesimplymorewaystosupplyfalse
informationthananycomputerprogramcanidentify.
2.3 Summary of the data
Beforeturningtotheclusteranalysis,wewillgiveasummaryofthevariables
thatcomprisethedownloadproles.
All ofourvariables arecategorical(whichwill be reectedin ourchoice
ofclusteringmethod). Hence,itmakessense tousethemodalcategoriesof
each variable to createthe \typical"person whodownloadedXploRe. This
person works at an Europeanuniversity, hasheard of XploRe on the web,
usesMS Exceltodostatistics,andhasdownloadedthelocalWindowsversion
ofXploRe.
Turningtothevariablesone-by-one,about80%oftheusersworkeitherat
auniversity(46%)oraresearchinstitution(34%)whileonlyasmallfraction
of the downloadsare initiated by people working for private, non-research
companies.
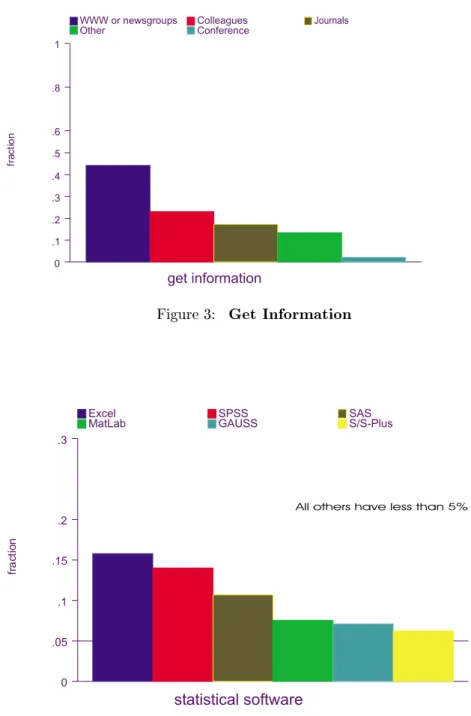
Figure 3 shows that information about XploRe has been disseminated
throughvariouschannels,withtheworldwidewebalreadyplayingthemost
importantrole.
Two-thirdsofalldownloadsrequesttheWindowsversionofXploRe,with
Linux comingin secondat about30%. Thepopularityof theLinuxversion
issurely boosted byits relativeattractiveness (noexpiration date, nolimit
onsize ofdatasets). Allotheroperatingsystemsplayaveryminorrole.
Wewerequitesurprisedto learnthatwhenpeoplewereaskedaboutthe
statistical software they currently use, the most frequent response was MS
Excel. XploReisacommanddrivensoftwarewithacomparativeadvantage
inratheradvancedstatisticalmethods,particularlysmoothing. Weexpected
programssimilarindesignandscopetoXploResuchasS-PlusorGAUSStobe
themostfrequentchoicesinthiscategory. Whiletherearesubstantialshares
of S-Plusand GAUSSusers (both account for about 7% of all downloads),
Figure 4 shows that most downloads are made by users of more standard
fr ac tio n
get information
0 .1 .2 .3 .4 .5 .6 .8 1
WWW or newsgroups Colleagues Journals
Other Conference
Figure3: Get Information
fra cti on
statistical software
0 .05 .1 .15 .2 .3
Excel SPSS SAS
MatLab GAUSS S/S-Plus
All others have less than 5%
Figure4: StatisticalSoftware
may befacing astatistical problem that requires aprogrammable, matrix-
orientedtoollikeXploRe.
Finally,themajorityofthedownloadsaremadebyresidentsofGermany
(22.5%), the U.S. (almost 18.8%), and Italy, France, and the UK (which
combinefor17.51%). About10%ofthedownloadsaremadefromAsiawhile
AustralianandAfricandownloadsareveryrare.
3 Mining Technology
3.1 Mining Software
Theprimarygoalofourminingrunistoidentify asmallnumberof\types"
ofusersbyperformingacluster analysisofthedownloadproles. Wechose
Intelligent Minertodotheclusteranalysisforseveralreasons.
Firstly,theclusteringalgorithmofIntelligent MineremploystheNew
Condorcet Criterion (NCC), which is particularlywell-suitedfor adata set
like ours that consists entirely of discrete (categorical) variables. We will
discussNCCinmoredetailinthefollowingsection.
Secondly,Intelligent Minercomeswithaclustervisualizationtoolthat
greatlyhelpsinsolvingoneofthemainproblemsofclusteranalysis:guring
out what the clusters mean and translating those insights into meaningful
customersegments. An exampleisshown inFigure 5of section4wherewe
willexplainandutilizeIntelligent Miner'sgraphicaloutput.
Finally,thewelltestedparallelalgorithmofIntelligent Mineriscom-
putationallyeÆcient.
3.2 Clustering Method
Clusteranalysis partitions theobservations into disjointgroups (synonyms
are \classes"and \clusters") such that observations belonging to the same
class are very similar while observations belonging to dierent classes are
verydierent. Thesimilarityofobservationsismeasuredbysomedistance
function (such as the Euclidean distance for continuous variables). Once
a rule for computing the distance between any two observations has been
determined, one can compute for a given partition the distances between
observationsofthesameclass(within-grouporintraclassdistances)andob-
servationsofdierentclasses(between-grouporinterclassdistances). These
individualdistancesarecombinedbyapartitioncriterionthatcanbeused
tocomparedierentpartitions. Sinceitis ingeneralimpossibleto consider
allpossiblepartitionsoftheobservations,aclustering algorithmalsohasto
haveastrategyforsearchingfortheoptimalpartition.
Various choices exist for all aspects of this problem: the distance, the
partition criterion and the optimization strategy. We will not attempt to
provide acomprehensivediscussion herebut rather focus onthe algorithm
CondorcetCriterion
Theclusteringalgorithm usedin thispaperis basedontheNewCondorcet
Criterion(NCC)ofMichaud(1997). ItisinspiredbyCondorcet(1743-1794)'s
workonndingadesirablewaytoaggregatevotes(rankings)in anelection.
TheNCC combines intraclass agreement as well as interclassdisagreement
such that \good" partitions, i.e. those with small intraclass distances and
largeinterclassdistances,gethighervaluesofthecriterionfunction.
Specically,foragivenpartition P, thegoodnesscriterionis
G(P)= p
X
k =1 X
i2L
k 0
@ X
j2L
k
;j6=i (m d
ij )+
X
j62L
k d
ij 1
A
: (1)
Theindexoftheleftmostsumisoverthepclasses(clusters)whiletheinner
sumsrunovertheobservationsthatarewithinandoutsidesomeclusterL
k :
Thesummandsarethedistancesd
ij :
Forcategorical variables,the distanced betweentwoobservationsi and
j isthenumberofvariablesforwhichthetwoobservationstakeondierent
values,i.e. thenumberofdisagreementsbetweenthetwoobservations. Ifm
variables are measuredfor each observation then it follows that m d
ij is
just the opposite of d
ij
: the number of agreementsbetween observations i
andj.
G(P)calculatesforagivenpartitionP thesumofallintraclusteragree-
mentsand all intercluster disagreements. Dierent partitions may then be
ranked accordingto their valueof G(P){ the higherG(P); the betterthe
partition. Indeed, if we interpret intracluster agreements and intercluster
disagreementsas"votes" foragivenpartition,then theconnectionto Con-
dorcet'sworkbecomesapparent: thewinneramong allcandidates(i.e. par-
titions)oftheelection(i.e. theclusteranalysis)istheonereceivingthemost
votes(i.e. thehighestvalueofG(P)):
It remains to explainIntelligent Miner'sstrategyfor nding theop-
timalpartition (i.e. theonewiththehighestvalueof G(P)). Intelligent
Minerconsidersallpartitionswhosenumberofclusterspissmallerthanthe
maximumnumberofclustersspeciedbytheuser. Thatis,iftheuserwants
tondthebestpartitionamong thosewith, say,atmostthreeclustersthen
Intelligent Minerwill calculate G(P)for all partitions with one, two or
threeclusters.
4 Results and Discussions
Theclustering algorithm described in the previoussection requires two in-
maximum number of clusters per partition. We have tried various combi-
nationsofvariables andmaximumnumberofclusters, basically following a
heuristic"backwardselection"strategy. Thatis,westartedwitharelatively
largenumberof variablesand maximumnumberof clusters, aimingto nd
asmaller,moreparsimoniouspartition.
Inthispaper,wewillshowtwostages alongthispath. First,wepresent
the results of a partition based on ve variables and a maximum of ve
clusters per partition. Then we present a more parsimonious, \optimal"
partition,basedonthree variablesandamaximumnumberofthree cluster.
N=1085
Global CondorcetValue=0.4722
Id ClusterSize ClusterSize Condorcet
(Absolut) (Relative) Value
0 324 29.86 0.4923
1 220 20.28 0.5121
2 191 17.60 0.4584
3 203 18.71 0.4402
4 147 13.55 0.3690
Table1: ClusterCharacteristics
Tables1,2and3summarizetheresultsof thecluster analysiswith ve
variables and amaximumof ve clusters. The ve"active" variable (that
wereactuallyusedinformingtheclusters)arekind of work,statistical
software,get information,country,and operating system. There are
alsotwosupplemental variables(get on mailing list,kind of server).
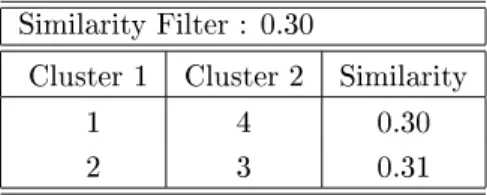
SimilarityFilter: 0.30
Cluster1 Cluster2 Similarity
1 4 0.30
2 3 0.31
Table2: SimilarityBetweenClusters
Table1 gives the value of the overall goodness criterion G(P) of equa-
tion (1) ("Global Condorcet Value = 0.4722"), as well as the intracluster
agreements(column"CondorcetValue")foreachoftheveclusters. Table2
reportsinterclusteragreementsfor selectedclusters. All measuresare stan-
dardizedtofallbetween0and1. Aperfectpartitionwouldattainavalueof
of0foreachinterclusteragreement.
Theglobalcondorcetvalueandallintraclusteragreementsobviouslyleave
roomfor improvement. Thereportedinterclustersimilarities betweenclus-
ters1and4(0.30)andclusters2and3(0.31)arebothrelativelyhigh. This
suggeststo merge these pairs of clusters to arriveat a moreparsimonious
partition.
Id Name Modal Modal Noof Condorcet
Value Freq. Values Value
1 OSPlatform 5 65.53 5 0.5342
2 KindofWork 1 45.90 5 0.3488
3 GetInfo 2 44.15 6 0.2960
4 SoftwareStat. Excel 15.76 16 0.1004
5 Country Germany 22.49 68 0.1026
6 [MailList] 0 80.65 2 -
7 [Server] 1 96.77 2 -
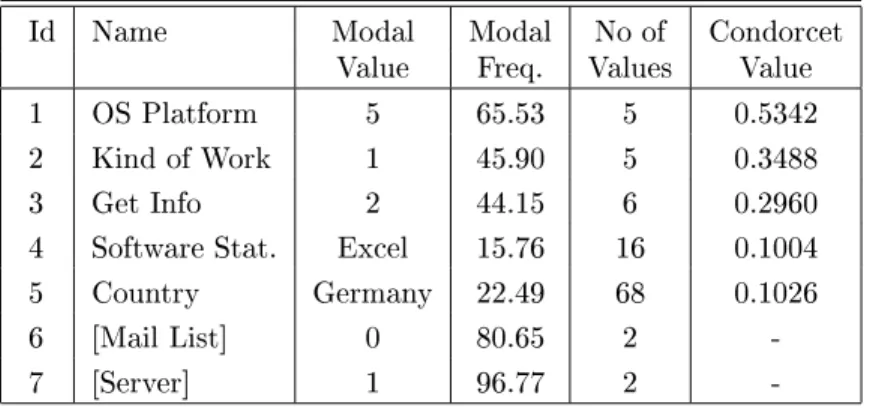
Table3: VariableCharacteristics
Regarding the role of the variables in forming the clusters, Table 3 re-
ports {additional to somesummary statistics{ a 2
-typevalue (also called
\Condorcet Value") that reects how much the distribution of each vari-
able varies across clusters. The distribution of the operating system (OS
Platform)showsthegreatestvariation acrossthe veclusters. Hence,this
variableplayed thegreatestrole in seperatingtheobservationsinto theob-
servedpartition. kind of workand get infoarethe onlyother variables
withcondorcetvalueofmorethan0.30. Wethereforechose tocontinuethe
analysiswiththesethree variablesonlyanddonotgiveaninterpretationof
theve-clusterpartition.
N=1085
Global CondorcetValue=0.6166
Id ClusterSize ClusterSize Condorcet
(Absolut) (Relative) Value
0 420 38.71 0.6355
1 352 32.44 0.5977
2 313 28.85 0.6063
Table4: ClusterCharacteristicswiththreeclusters
Clustering using the three most influential variables
39
0
32
1
29
2
kind of work
1 (80%) 4 (20%)
OS platform
5 (97%) 3 (>0%)
1 (1%) 2 (1%)
get info
3 (3%) 5 (10%) 1 (19%) 4 (32%) 2 (37%)
Other (>0%)
OS platform
4 (<100%) 3 (>0%)
get info
3 (>0%) 4 (9%) 5 (11%) 1 (17%) 2 (62%)
kind of work
1 (46%)
2 (35%) 4 (16%) 3 (1%) 5 (1%)
kind of work
2 (78%) 4 (5%)
3 (12%) 5 (4%)
OS platform
5 (96%) 3 (1%)
1 (2%) 2 (1%)
get info
3 (4%) 1 (15%) 5 (20%) 4 (27%)
2 (34%)
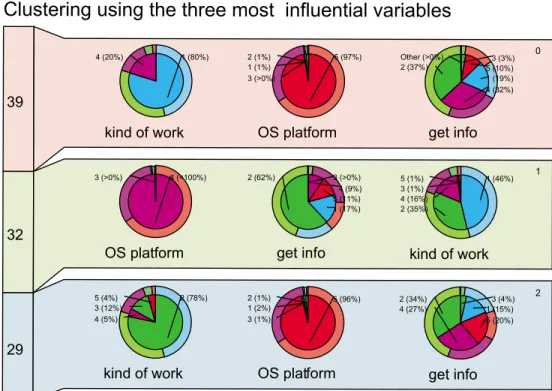
Figure5: Threeclusters(clusterI(39%ofallobservations);cluster
II (32%) ;cluster III 29%
Theresultsofthecluster analysiswiththreevariablesandatmostthree
clusters per partition are presented in Tables 4 and 5 and Figure 5. The
globalcondorcetvalue(seeTable4)fortheoptimalpartitionin thissetting
is 0:62 which is a substantial improvement from the partition of Table 1.
Notethatthecondorcetvaluesoftheintraclassagreementsallexceed0.5.
TheinterpretationoftheclustersismadeeasierbytheoutputofIntelligent
Miner'sclustervisualizationtoolshowninFigure5. Therearethreerowsof
graphs,onerowfor each cluster. Eachrowhaspie charts foreach variable,
ordered from left to right according to decreasing inuence in forming the
clusters. Eachpiechartspresentsthedistribution oftherespectivevariable
amongtheobservationsinthecluster(innerpie)andthedistributionamong
allobservationsintheentiresample(outerpie).
For instance,theleftmostpiechartintherstrowofFigure5showsthe
distributionofthevariablekind of workamongtheobservationsintherst
cluster(innerpie)andamongallobservations(outerring). Intherstcluster
(whichcontains39%ofallobservations),80%oftheproleshaveavalueof
\1"(university)forkind of work(turquoiseslice),whiletheremaining20%
theouter ringof thepie chart,wecansee that thecorrespondingfractions
(representedbyturquoise and purplesegmentsoftheouter ring)amongall
observationsofthe datasetareconsiderably smaller(46%downloadXploRe
forworkattheuniversityand14.5%forprivateuse).
Inthesecondrow(clusterII),thepiechartforkind of workistheright-
mostpiechart,indicatingthatkind of workistheleastinuentialvariable
forallocatingobservationstoclusterII.Ifwecomparetheinnerpiewiththe
outerringofthispiechart,itiseasytosaywhy: thedistributionofkind of
workin clusterIIandintheentiresampleareverysimilar.
Bystudyingallpiechartsinthisway,onecanarriveatthecharaterization
ofthethree clusterssummarizedinTable5.
TypeCluster Variables Attributes Percentage
kind of work university 80%
ClusterI OS platform Windows 98/NT 97%
(Academia) publication,journal 19%
get info friends,colleagues 32%
WWW,newsgroups 37%
ClusterII OS platform Unix/Linux 99%
(Unix/Linux users) get Info WWW,newsgroups 62%
kind of work university 46%
kind of work research 78%
ClusterIII OS platform Windows 98/NT 96%
(Researchers) others 20%
get info friends,colleagues 27%
WWW,newsgroups 34%
Table5: Threeclusters
ClustersIandIIIarebestcharacterizedbytheirdominantvalueofkind
of work (university and research, respectively), leading to our choice of
names for these clusters (Academia and Researchers, respectively). Re-
garding the other two variables, OS platform and get info, the observa-
tionsin both clustersare quitesimilar: Windows is thedominantopertaing
system and the world wide web the most prevalent source of information
aboutXploRe.
of the individuals in this cluster downloaded the Linuxor Unixversionof
XploRe. Comparedto the Academia and Researchersclusters, the World
WideWebplaysanevenmoreimportantroleasasourceofinformation: 62%
ofthemembersofcluster II learnedaboutXploRefrom theweb. Regarding
kind of work,wehavealreadynotedabovethatmembersoftheLinux/Unix
clusterclosely mimicthedistribution among allobservations. Hence,usage
ofLinux/Unixusageappearsto beindependentfrom kind of workinthe
statisticalsense.
SinceinstallingandusingsoftwareunderLinuxorUnixstillrequiresmore
sophisticationonthepartoftheuser,onemayconcludethat this clusteris
madeupof\computerexperts",whoalsotendtointeractwithothers\elec-
tronically". Membersof clustersI and III,to thecontrary, overwhelmingly
use some(typically preinstalled)versionof Windows. While thelatter also
increasinglyrelyonthewebforinformationpurposes,theystillalsousemore
traditionalwaysofcommunicatingwiththeirpeers,suchas scienticpubli-
cationsor conferences.
1
From a business perspective, these clusters suggest some strategies for
promotingXploRe. Membersof theUniversitycluster will useXplorefor
research and teaching. Hence, members of this group (some of which are
likelytobestudents)willbeinterestedinXploRe'scapabilitiestoteachand
learnstatistics,suchas its\teachware"modules.
Membersof thethird cluster,on theother hand,will primarily wantto
knowhowXploRecanhelpthemwiththeirresearchwork. Addingquestions
totheonlinequestionnaireabouttheeld ofspecialization(economics,epi-
demeology, etc.), the statistical techniques typicallyused or the statistical
methodssearchedforinXploRemayprovidevaluableadditionalinformation
fortargetedmarketingandthefuturedirection ofXploRe.
Regarding a marketing strategy for the members of the Linux cluster,
theyappeartobeatargetgroupforpromotingXploRe'sweb-basedfeatures,
suchastheonlinehelpsystemoritsabilitytodoallcomputations\through"
aninternet browser.
Theirreponses(aswellas,toalesserdegree,thoseofthemembersofthe
otherclusters)alsoshowtheimportanceforastatisticalsoftwarelikeXploRe
tohaveanexcellentWWWappearanceandtoknowhowtogetthe\online"
attention of its (potential) customers. That is, the makersof XploRe(and
mostlikelythoseofanyothersophisticatedstatisticalsoftware)havetomake
surethat people willnd and keepvisiting theXploRehomepageand read
(andnotimmediatelydiscard)XploReemail.
1
Indeed, inan earlieranalysiswithlessrecentproles, the worldwide webwas less
importantinclusters Iand III. Theincreased importanceisprobably dueto both the
generalincreaseininternetusage,aswellastheenhancedinternetrepresentationofXploRe.
Inwhathasbeencalledthe\informationage"orthe\digitalera",everyday
economic activity continuously produces large amounts of data, stored in
evergrowingdatabases. Thegoal of\datamining" is to -intelligentlyand
automatically-extractusefulinformationfromthesedatabases.
Oneof themain tasks ofdata miningis clustering, i.e. partitioningthe
datainto (a small set of)groupssuchthat membersof thesamegroupare
rathersimilarwhilemembersofdierentgroupsareratherdierent. Sucha
partitionmayhelpinproducingacompanytodesigndierentiatedpromotion
andsalesstrategiesaimedat certain\types"ofcustomers.
Inthispaper,wehavepresentedtheresultsofacluster analysisof1085
prolesofindividuals whohavedownloadedthestatisticalsoftwareXploRe.
Eachproleconsistedofasetofvariablesthataretheresponsestoamanda-
toryonlinequestionnairepreceedingtheactualdownloadingprocess.
Usingaclusteringalgorithm particularlysuitedforourcategoricaldata,
wearrivedatapartitionconsistingofthreeclusters: Academia,Linux/Unix
usersandResearchers. Therstandthird clusterbothconsistofpersons
whoworkunderWindowsandlearnedaboutXploReinvariousways,withthe
worldwidewebplayinganincreasingbutnot(yet)dominantrole. Thesetwo
clustersareseparatedprimarily bythekind of workvariable: membersof
theAcademiaclusterpredominantlyworkatuniversitiesandwilluseXploRe
for research and teaching. Members of the second cluster can be charac-
terizedas sophisticatedcomputeruserswhowork underLinuxorUnixand
makeheavy useofthe internet. Foreach cluster,wehavetriedto sketch a
marketingstartegythatincorporatestheresultsofthisanalysis.
Fromastatisticalpointofview,twopossibleimprovementsalwayscome
totheanalyst'smind: betterdataandbettermethods.
Indeed, we would have liked to have a greater number of substantive
variablesatourdisposal(forinstance,theeldofspecializationorthemost
frequentlyused statisticalmethods). Ontheotherhand,theextensivedata
cleaningjob showed thatalonger online questionnaireneednot necessarily
leadtobetterdata(as well asthat data mining,at leastin thisanalysis,is
notanall-automaticaair).
Regardingthemethods,onemayexperimentbothwithotherdatamining
techniques(suchasassociationruleorsequentialmining)orotherclustering
algorithmstondneworimprovedresults. Weleavethisforfuture work.
References
Chen,M.S.,Han,J.&Yu. P.S. (1996). DataMining: an Overviewfroma
DatabasePerspective,IEEETrans.onKnowledgeandDataEngineering,
8:866-883.
Grabmeier, J. & Rudolph, A. (1998). Techniques of Cluster Algorithms in
DataMining,IBM.
Ha, S. H. & Park, S. C. (1998). Application of data mining tools to hotel
data mart onthe Intranet for databasemarketing,Expert Systemwith
Application15:1-31.
Hardle, W. & Klinke, S.& Muller, M. (1999 ). XploRe Learning Guide,
SpringerVerlag,Hiedelberg.
Hardle, W. , Hlavka, Z. & Klinke, S. (2000 ). XploRe Application Guide,
SpringerVerlag,Hiedelberg.
Michaud,P.(1987).AppliedStochasticModelsandDataAnalysis,3:173-189.
Michaud, P. (1997 ). Clustering Techniques, Future Generation Computer
Systems,13:135-147.