Central and Eastern Europe in Transition
Economic and Institutional Aspects
D I S S E R T A T I O N
zur Erlangung des akademischen Grades doctor rerum politicarum
(dr. rer. pol.)
im Fach Volkswirtschaftslehre eingereicht an der
Wirtschaftswissenschaftlichen Fakult¨ at Humboldt-Universit¨ at zu Berlin
von
Frau Dipl.-Volkswirtin Antje Hildebrandt geboren am 15.11.1971 in Wolfsburg
Pr¨ asident der Humboldt-Universit¨ at zu Berlin:
Prof. Dr. J¨ urgen Mlynek
Dekan der Wirtschaftswissenschaftlichen Fakult¨ at:
Prof. Michael C. Burda, Ph.D.
Gutachter:
1. Prof. Dr. Charles B. Blankart
2. Prof. Dr. Dr. Christian Kirchner, LL.M.
eingereicht am: 21.11.2002
Tag der m¨ undlichen Pr¨ ufung: 19.12.2002
Acknowledgment
I would first like to thank my adviser Charles B. Blankart for his support and guidance. I also wish to thank my second adviser Christian Kirchner. Part of this book is based on joint research. Chapter 3 is the result of work with Greetje Evereart and Chapter 5 with Verena Hahn. I want to thank both co-authors for inspiring and fruitful collaborations. This work was consider- able improved by the comments and criticism of many people. In addition to those already mentioned, I am deeply grateful to Christian Jansen, Ger- rit K¨oster, Iikka Korhonen, Joep Konings, Hylke Vandenbussche, Alexander Repkine, Bas Van Aarle, and Todor Gradev, as well as participants of the Young Economist Spring Meeting (Oxford, 2000), the Conference on Recent Developments in Transition Economies (Saloniki, 2000), the Public Choice meeting (Innsbruck, 2001), the summer school of theEuropean University In- stitute (Florence, 2001), the EUNIP Conference (Vienna, 2001), the BOFIT seminars (Helsinki, 2002) and the annual conference of the Verein f¨ur So- cialpolitik (Innsbruck, 2002). Thanks are also due to Lisa Cwojdzinski and Cliff Richter for research assistance, and Greg Moore for checking my lan- guage.
Part of this research was undertaken while I was visiting the Centre for Transition Economics (LICOS) at the K.U. Leuven, Belgium, which pro- vided valuable research support, particularly the data used in Chapter 3 and Chapter 4. Financial support for my stay from the European Union Marie Curie Training Site Fellowships under the programme “Improving Human Research Potential and the Socio-Economic Knowledge base” is gratefully acknowledged. Some of this book was also written while I was a visiting re- searcher at theBank of Finland Institute for Economies in Transition, which provided an outstanding working environment.
Finally, I am deeply thankful to Ulrich Wieler for his encouragement and support during these last years.
Contents
1 Introduction 1
2 What is Special About Enlarging the European Union to the East? A Comparison with the Southern Enlargement 4
2.1 Introduction . . . 4
2.2 Key economic indicators . . . 6
2.2.1 Economic development levels . . . 6
2.2.2 Macroeconomic stabilisation . . . 7
2.2.3 Microeconomic and institutional reforms . . . 9
2.3 Challenges to enlargement . . . 11
2.3.1 Agriculture in southern and eastern Europe . . . 11
2.3.2 East-west migration . . . 12
2.3.3 Decision-making in an enlarged Union . . . 13
2.3.4 Budgetary costs of enlargement . . . 15
2.4 Convergence through membership? . . . 17
2.5 Conclusions . . . 19
3 On the Causes of Soft Budget Constraints: Firm-level Evi- dence from Bulgaria and Romania 21 3.1 Introduction . . . 21
3.2 Theoretical background . . . 23
3.3 Data description . . . 26
3.4 Empirical results . . . 33
3.5 Discussion of the results . . . 36
3.6 Conclusion . . . 38
4 Too many to Fail? Inter-enterprise Arrears in Transition Economies 40 4.1 Introduction . . . 40
4.2 Trade credits and soft budget constraints . . . 42
4.3 The survey data . . . 47
iii
4.4 An empirical snapshot . . . 48
4.5 Discussion of the results . . . 50
4.6 Conclusion and policy implications . . . 55
5 Institutional Reform and Progress in Transition 57 5.1 Introduction . . . 57
5.2 Institutions, growth and productivity . . . 59
5.2.1 Theoretical background. . . 59
5.2.2 The data . . . 60
5.2.3 Model specifications . . . 64
5.3 Empirical results . . . 65
5.3.1 The EBRD transition indicators . . . 65
5.3.2 Institutions and growth. . . 66
5.3.3 Institutions and productivity. . . 69
5.4 Concluding remarks. . . 70
6 Conclusion 72
Appendix to Chapter 2 88
Appendix to Chapter 3 97
Appendix to Chapter 4 109
Appendix to Chapter 5 112
List of Tables
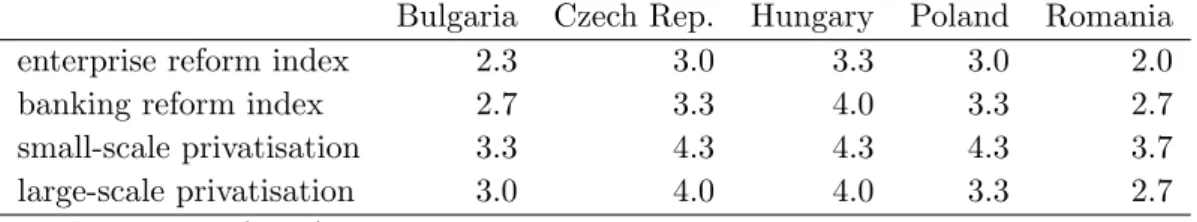
3.1 Reform indices in Central and Eastern European countries . . 27 3.2 Size of firms: Number of employees . . . 27 3.3 Concentration of manufacturing firms in Bulgaria and Roma-
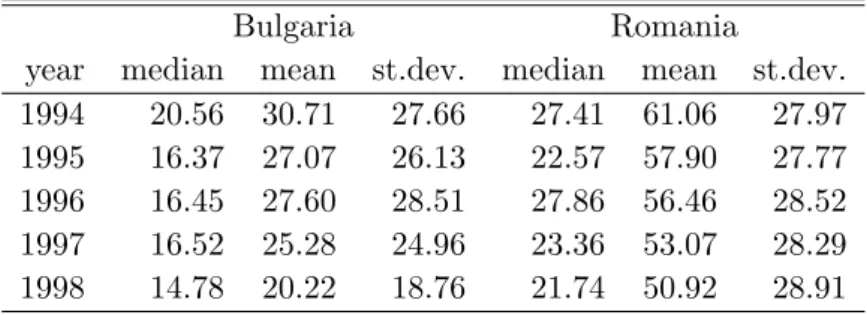
nia: Herfindahl indices . . . 28 3.4 Import penetration of manufacturing industries in Bulgaria
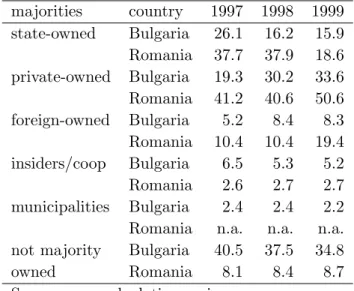
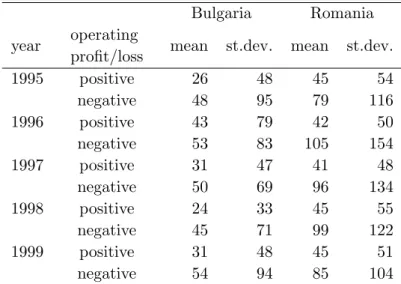
and Romania . . . 29 3.5 Ownership structure: Percentage of firms in which the named
owner has the majority . . . 30 3.6 Credit period in days . . . 31 3.7 Firms with Soft Budget Constraints (in percent of firms in the
whole sample) . . . 32 6.1 Macroeconomic indicators for southern European countries
and the EU12 . . . 88 6.2 Macroeconomic indicators for CEEC and for the EU15 . . . . 89 6.3 Effects of EU enlargement on the Council of Ministers. . . 90 6.4 Logit results for Soft Budget Constraints in Bulgarian firms . 98 6.5 Logit results for Soft Budget Constraints in Romanian firms . 99 6.6 Logit results for Soft Budget Constraints in Bulgarian firms
with investment-corrected measure . . . 100 6.7 Logit results for Soft Budget Constraints in Romanian firms
with investment-corrected measure for SBC . . . 101 6.8 Logit results for Soft Budget Constraints in Bulgarian firms
with investment-corrected measure for SBC and market shares 102 6.9 Logit results for Soft Budget Constraints in Bulgarian firms
with investment-corrected measure for SBC and market shares (levels and squared). . . 103 6.10 Logit results for Soft Budget Constraints in Romanian firms
with investment-corrected measure for SBC and market shares 104
v
6.11 Logit results for Soft Budget Constraints in Romanian firms with investment-corrected measure for SBC and market share
(squared and levels). . . 105
6.12 Distribution of firms by industries in the sample . . . 106
6.13 Regression results for Hungary. . . 110
6.14 Regression results for Romania . . . 111
6.15 Descriptive statistics: real GDP growth . . . 113
6.16 Descriptive statistics: explanatory variables . . . 114
6.17 Regression results: Panel estimates for growth determinants (I)115 6.18 Regression results: Panel estimates for growth determinants (II)116 6.19 Regression results: Panel estimates for productivity determi- nants . . . 117 6.20 Correlation matrix of liberalisation and competition variables. 118
List of Figures
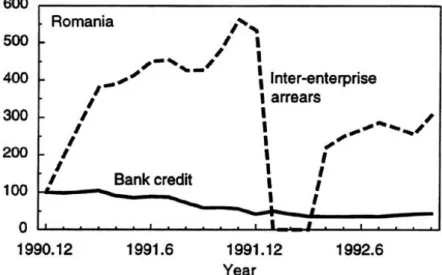
4.1 Development of bank credits and inter-enterprise arrears/credits
in Romania (1990-1992) . . . 45
4.2 Development of enterprise payment arrears in Romania (1995- 1999) . . . 51
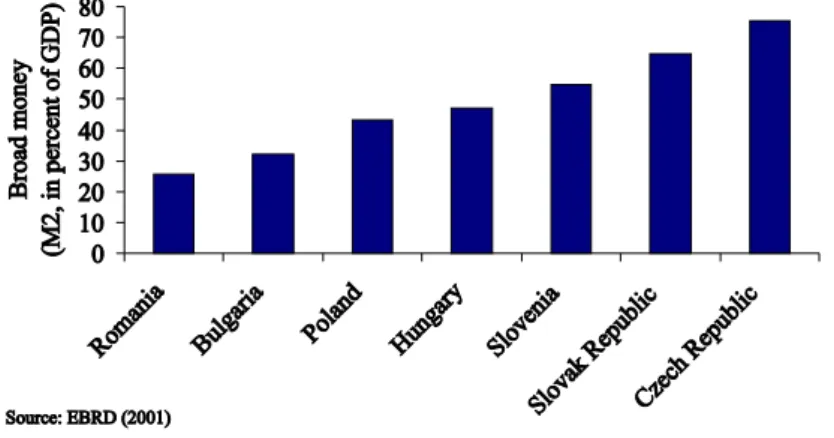
4.3 Degree of monetisation of transition economies (1999) . . . 53
4.4 Credit to the private sector (1999). . . 54
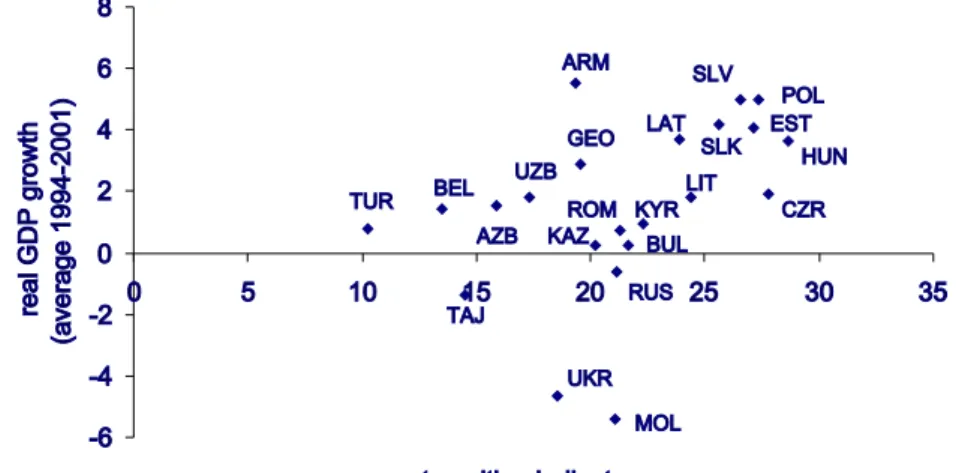
5.1 Real GDP growth and institutional reforms . . . 59
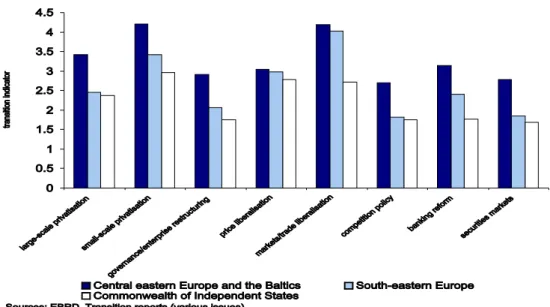
5.2 Progress in core areas of transition . . . 66
6.1 Population of southern European countries, CEECs and of the EU . . . 91
6.2 Economic size of southern European countries, CEECs and of the EU . . . 91
6.3 GDP per capita in southern European countries in relation to the EU12 in 1987 . . . 92
6.4 GDP per capita in CEECs in relation to the EU15 in 2000 . . 92
6.5 Unemployment rate in southern European countries and in the EU in 1987 . . . 93
6.6 Unemployment rate in CEECs and in the EU in 2000 . . . 93
6.7 Agriculture in southern European countries and in the EU in 1986 . . . 94
6.8 Agriculture in CEECs and in the EU in 2000 . . . 94
6.9 Total net migration in southern European countries (1970-1998) 95 6.10 EU spending in ECUm from 1958-1994 . . . 95
6.11 Real GDP growth in CEEC and in the EU (1989-2001) . . . . 96
6.12 Convergence of GDP per capita of southern European coun- tries from 1970-1989 . . . 96
6.13 Net bank financing in Bulgarian firms . . . 107
6.14 Net bank financing in Romanian firms . . . 107
6.15 Credit periods in Bulgarian firms . . . 108
vii
6.16 Credit periods in Romanian firms . . . 108
Chapter 1 Introduction
The fall of the Berlin wall in November 1989 can be seen as the watershed event that put central and eastern European countries on irreversible paths towards market-based economic systems. These countries peacefully took the unprecedented decision to abandon their centrally planned economies to create functioning market economies from scratch.
With over a decade of experience in transition, the first lessons of this unique historical experiment can be drawn. The creation of market economies has turned out to be more challenging and less smooth than expected at the beginning of the transition process. Substantial differences in reform progress of transition economies have opened up and one can even speak of a Great Divide (Bergl¨of and Bolton (2002)). Some countries succeeded in initiating far-reaching reforms and overcome their transformational recessions, while others continue to wrestle with their past.
Initial conditions were decisive for economic revival. However, the diver- gence of economic performances is not only a legacy of history but also an outcome of economic reform efforts. At the start of the transition process stabilisation, liberalisation and privatisation were at the core of the transfor- mation agenda in all central and eastern European countries and, as theIMF (2000) noted, institutional reforms received far less attention than macroe- conomic reforms.
Experience now argues that establishing sound market-supporting insti- tutional infrastructure to underpin newly emerging market economies is fun- damental for any country wanting to cross the Great Divide. Time has also made researchers and policymakers wiser to the extent that, after a decade of struggle, we all understand that transition is a complex and long-winded task. Major challenges and setbacks surely lie ahead.
Overview
In line with current research on transition economics, the main objective
2
of this work is to analyse institutional changes in the transition process.
Chapter 2 is devoted to identify problems the European Union may face from eastward enlargement and how membership might influence economic development in accession candidates. The imminent integration of former centrally planned economies with western European countries plays an im- portant role in the transition process of many central and eastern European countries and strongly influences the outcome of economic and institutional changes. Despite the historical peculiarity of the upcoming enlargement round, comparison with the earlier southern enlargement provides useful in- sights into mechanisms of enlargement and problems the EU might encounter.
Chapter 2 explores the past experience of enlarging the EU referring to the economic situation of the applicants in comparison to the member countries and the challenges to enlargement. In addition to providing background in- formation on transition countries, lessons from southern enlargement for the upcoming enlargement are drawn. Experience shows that membership does not confer rapid economic progress to new entrants. Instead, strong govern- mental commitment to market-oriented reforms is needed to raise economies to levels that match EU core states.
At this point in the discussion, we identify the crucial importance of hardening budget constraints. Since Kornai (1980), the adverse effects of soft budget constraints have been well-documented and more recently, several theoretical explanations for the presence of soft budget constraints have been put forward. Research in Chapters 3 and 4 is thus devoted to problems of soft budget constraints in transition countries.
In Chapter 3, we empirically test theories on the causes of soft bud- get constraints. A panel data set consisting of company account data for Bulgarian and Romanian manufacturing firms is used, covering the period 1995-1999. The results suggest that the probability of finding soft budget constraints depends on the degree of competition within the sector and own- ership structures of firms. We further find that sociopolitical concerns about employment increase the probability of soft budget constraints provided that firms are loss-making. Thus, as already suggested in the theoretical mod- els on the causes of soft budget constraints, our empirical results strongly support the hypotheses that competition, privatisation and firm size largely account for the presence of soft budget constraints.
Chapter 4 considers trade credits as part of the problem of soft budget constraints in transition countries. In advanced market economies, the use of trade credits is an important way of short-term financing and generally considered part of normal business practice. In contrast, some transition countries have experienced a rapid accumulation of trade credits leading to interlocking webs of arrears and collective bail-outs by the government. Thus,
3
we look to see whether trade credits represent normal business practice com- parable to advanced market economies or whether trade credits are a system- atic phenomenon supporting soft budget constraints of firms in transition.
The results suggest that trade credits may have negative spill-over effects on other firms by worsening their financial situation. The chapter concludes that the problem of interlocking chains of arrears is more pronounced in countries that are less committed to market-economy reforms.
In Chapter 5, we utilise macroeconomic data to illustrate the impact of implementing institutions that support free competition by opening up mar- kets and hardening budget constraints on economic performance. We apply panel data analysis to a sample covering transition economies in central and eastern Europe, the Baltics and the CIS. The results support the notion that economic performance is impaired in countries that fail to develop institu- tions that provide incentives for restructuring and reallocating resources.
Chapter 6 summarises the results and provides concluding remarks.
Chapter 2
What is Special About
Enlarging the European Union to the East? A Comparison
with the Southern Enlargement
2.1 Introduction
The European Union1 was founded in 1958 by six relatively homogeneous in- dustrialised states.2 As it has evolved and expanded, new entrants increased internal disparities, especially in terms of per capita incomes. There was a particularly sharp increase in such disparities with the admission of Greece, Portugal and Spain.
The end of state socialism in central and eastern European countries (CEECs) now allows further political and economic integration of Europe. In 1998, the EU initiated accession negotiations with a “first wave” of CEECs.3 In early 2000, the EU entered into membership talks with a “second wave”4 of CEECs. Institutional development and macroeconomic performance of CEECs, particularly Bulgaria and Romania,5 distantly lag EU members.
1The European Union or EU, and its predecessor the European Community are used synonymously throughout this chapter.
2Belgium, France, Germany, Italy, Luxembourg and the Netherlands.
3The “first wave” (Luxembourg group) includes the Czech Republic, Estonia, Hungary, Poland and Slovenia.
4“Second-wave” (Helsinki group) countries include Bulgaria, Latvia, Lithuania, Roma- nia and Slovakia.
5Most second-wave countries are catching up with the first-wave countries. This can be seen, e.g., in progress in accession negotiations with the European Union. The first-wave
2.1. Introduction 5
Thus, eastern enlargement will likely increase regional disparities and income disparities6 as did southern enlargement earlier.
The record of southern enlargement7 in the 1980s provides insights into the challenges currently facing the EU with admission of CEEC members.
As in eastern Europe under socialism, the state played a dominant role in southern European countries before accession. Also like the CEECs, the three southern entrants embraced democracy only shortly before they joined the EU. In both groups, too, agriculture plays a prominent role in the various na- tional economies and ahead of entry they are at the low end of the European income hierarchy. Given these similarities, the outcomes of the upcoming enlargement round may well resemble those of southern enlargement.
Nevertheless, in outlining and comparing characteristics of old and new entrants,8 and identifying major challenges of enlargement, we should re- main aware that much has happened since Portugal and Spain joined the EU in 1986. With the Single European Act9 and the Maastricht Treaty,10 the Union has been transformed from a straightforward customs union to a sophisticated Economic and Monetary Union. The applicant countries must adopt the acquis communautaire, i.e. the rules of the EU, which have con- tinuously been extended. Requirements for entry have grown in number and become more demanding.
Section 2.2 sketches out economic development levels, macroeconomic performances and microeconomic restructuring of the former and future en- trants in comparison to EU member states. Section 2.3 contains a discussion of the major obstacles to EU enlargement, notably agriculture, migration policy, changes in EU decision-making processes and budgetary spending.
Section 2.4 analyses the effects membership may have on accession coun- tries. Conclusions are presented in the last section.
countries, as well as Latvia, Lithuania and Slovakia had closed between 24 and 28 chapters (out of the acquis communautaire’s total of 31) as of the end of June 2002. Bulgaria had closed 20 and Romania only 12 chapters (European Commission (2002a)).
6The standard deviation of GDP per capita (measured by purchasing power) would move up from 5.0 (EU15) to 7.4 (EU27) based on 1998 figures (European Commission (2001b)).
7Sometimes referred to as the “second” round of EU enlargement.
8We refer here only to new entrants from central and eastern Europe. The membership candidacies of Malta and Cyprus are not considered.
9The aim of the Single European Act was the establishment by the end of 1992 of a functioning single market with free movement of capital, labour, services and goods. The economic and social cohesion of the member countries secondary goal.
10The treaty provides for a single European currency.
2.2. Key economic indicators 6
2.2 Key economic indicators
The two surveyed country groups – the recent southern European entrants (Greece, Portugal and Spain) and CEECs seeking EU membership – are relatively populous (see Figure 6.1 in the appendix to this chapter). In 1983 some 57 million people lived in the southern European accession candidate countries. Today, about 104 million CEEC citizens could potentially become EU residents. The inclusion of the southern countries increased the EU population by almost 22% when compared to the population of the EU9.11 Similarly, the EU’s current population (EU15)12 would grow by nearly 20%
if the most eligible CEEC aspirants are admitted.13 If all applicant countries are allowed in, the EU’s population would grow by 29%.
More striking, perhaps, is the size of entrant economies in comparison to the EU. Measuring economies as GDP at current prices (Figure 6.2 in the appendix to this chapter), we see that both enlargement rounds add relatively little to the Union market. Southern enlargement raised the EU’s GDP by nearly 11%. The inclusion of CEEC aspirants, apart from Bulgaria and Romania, is estimated to increase the EU’s total GDP just 4.0%. With Bulgaria and Romania, the increase would be 4.6%. Even recognising that the base is larger in the case of eastern enlargement (15 instead of nine countries), it is clear southern enlargement involved a larger initial economic contribution to the EU economy.
2.2.1 Economic development levels
The EU aspirants of the 1980s were significantly poorer than EU12 members (Figure6.3 in the appendix to this chapter), with per capita incomes ranging between 30% (Portugal) and 57% (Spain) of the EU12 average.14 Applicant countries of eastern Europe lag EU member states even further (see Figure 6.4 in the appendix to this chapter). For example, GDP per capita as a per- centage of average GDP per capita of the EU15 countries in 2000 amounted to 44% in the case of the best-performing CEEC (Slovenia), 24% for the Czech Republic and 22% for Hungary. Per capita incomes in Bulgaria and Romania, were just 7% and 8%, respectively, of the EU15 average. When
11The EU9 comprised Belgium, Germany, France, Italy, Luxembourg, the Netherlands, Ireland, Great Britain and Denmark.
12The EU15 includes Greece, Portugal, Spain, Austria, Finland and Sweden.
13According to recent information, the most likely aspirants are the first-wave countries as well as Slovakia, Latvia and Lithuania. The European Commission stated Bulgaria and Romania have yet to meet the requirements for membership (European Commission (2001e)).
14Data for EU9 were not available.
2.2. Key economic indicators 7
GDP is expressed in terms of purchasing power,15 however, the differences between aspirants and incumbents in both the southern and eastern groups decrease. In 1987, Portugal reduced the gap to 53%, Greece to 50% and Spain came close to 67% (Eurostat (1999)). The relative position of eastern countries also improves. Slovenia climbs to 69.4%, the other CEECs range between 58.8% (Czech Republic) and 23% (Romania) of the EU15 average (Eurostat (2002c)).16 Thus, southern enlargement involved admitting coun- tries where the per capita income gap was smaller on average than between the EU and current membership prospects.
2.2.2 Macroeconomic stabilisation
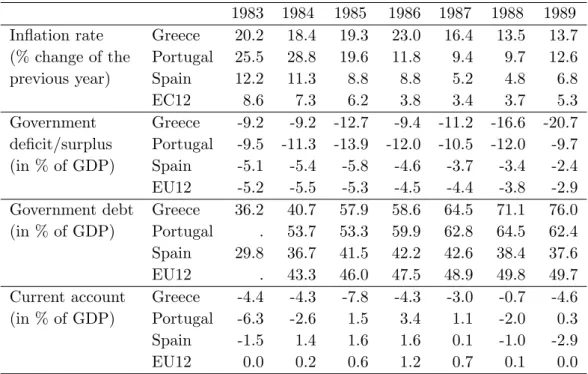
Accession to the EU is contingent on an applicant’s ability to meet require- ments defined in the Copenhagen Summit Criteria approved in 1993. It provides guiding principles for CEEC accession to the EU. Membership re- quires that candidate countries demonstrate three things: stable political institutions,17 a functioning market economy and capacity to cope with the competitive pressures and market forces within the EU. The last two re- quirements imply the attainment of macroeconomic stability sufficient to give economic agents an environment of predictability in which to make de- cisions (European Commission (2001e)). Such an environment is seen as the result of price stability, sound public finances and external balance. In the following discussion, we appraise the overall macroeconomic conditions in the candidate countries vis-`a-vis the southern countries.18 More figures also are given in Tables 6.1 and 6.2 in the appendix to this chapter.
In the lead-up to accession, inflation was relatively high in Greece and Portugal compared to the EU and Spain. At the start of transition in the early 1990s, inflation rates jumped drastically in all CEECs. Although in- flation eventually slowed, the rate of price increase today in most accession countries still exceeds the EU15 average. The price jump in transition coun- tries initially reflected the abolition of administered prices and the opening up of foreign trade. Later inflation has frequently been driven by monetar-
15This enables a correct comparison of volume of goods and services produced by dif- ferent countries.
16In 1998, GDP per capita measured in terms of purchasing power for all CEECs amounted to 38% of the EU average (European Commission (2001b)).
17Currently, all applicant countries except Turkey meet the Copenhagen political criteria (European Commission (2001e)).
18Our discussion here is deliberately kept to basics. For detailed information, refer to the EBRD’s Transition Report (2001) and the European Commission’s Progress Report (European Commission (2001e)). We also refer extensively to OECD (1986a), OECD (1986b),OECD (1986c) studies of southern European countries.
2.2. Key economic indicators 8
ily financed fiscal deficits,19 soft lending of banks and excessive wage hikes.
Thus, high inflation in a transition country today is still likely to signal loose monetary policy or structural inertia.20
Budgetary discipline in pre-entry Greece and Portugal was quite lax com- pared to the EU9. Most CEEC candidates, in contrast, are characterised by moderate government deficits. CEEC governments have managed to hold down public debt and public deficits even in the face of severe strain. How- ever, tight fiscal policy may become more problematic in the future as pres- sure for public spending builds along with social security reforms, restructur- ing of state-owned enterprises, structural and institutional adjustments (e.g.
implementing theacquis). Higher spending in any of these areas could unbal- ance public budgets.21 Difficulties also arise on the revenue side, particularly in less advanced transition countries that must cope with tax shortfalls due to poor collection22 and large shadow economies.
Greece’s internal imbalances were mirrored by a deterioration of its ex- ternal position. Decisive factors in Greece’s case were its reduced competi- tiveness after 1982 and a strong demand for imported goods. These factors are likely to be relevant contributors to current account deficits of CEECs as well. Indeed, CEECs currently have large external imbalances with high current account deficits. Moreover, the relative high marginal productivity of capital in accession countries may be attributed to external imbalances;
the counterpart of large capital inflow is often a large current account deficit.
Unemployment is another important indicator of a country’s overall eco- nomic situation. In Greece and Portugal, unemployment rates have fluctu- ated near the EU average (see Figure 6.5 in the appendix to this chapter), while Spain has long been dogged by persistent high unemployment.23 Un- employment rates of transition countries need to be interpreted at two levels.
Superficially, they reflect the economy’s ability to create new jobs, but they may also indicate failure at reform, especially in restructuring state-owned en- terprises (which typically means laying off workers). The picture for CEECs
19In Greece and Portugal, inflationary surges in the 1980s were mainly caused by public sector financing through strong money supply growth.
20Of course, it may also reflect external shifts. Some of the inflation increases of 2001 in various CEECs were driven by higher oil prices (European Commission (2001e)).
21On the other hand, EU transfers to CEECs could also be substantial. Under the Financial Framework for Enlargement, transfer to new members states could reach Euro 40 billion for 2004 to 2006 (European Commission (2002b)).
22On average, around 20-30% of firms in CEECs failed to pay all of their taxes (EBRD (1999)).
23Spain’s high unemployment rate has never been fully explained. It may partly be the result of high unemployment benefits and low wage flexibility (Blanchard and Jimeno (1995),Bover et al. (2000)).
2.2. Key economic indicators 9
is mixed (see Figure6.6in the appendix to this chapter). Some countries, e.g.
Slovenia and the Czech Republic, outperform the EU15 average. Others, e.g.
Poland, suffer from high unemployment rates. Increases in unemployment can still be ahead as tradition industries undergo structural adjustment and agricultural reform proceeds. The large agricultural sectors of some CEEC may well be major reservoirs of hidden unemployment.
In summary, Greece and Portugal were characterised by large macroeco- nomic imbalances in the mid-1980s. In recent years, enormous policy efforts have been undertaken in all three Mediterranean countries to bring their macroeconomic fundamentals into line with Maastricht criteria.24 Evidence that their efforts at macroeconomic stabilisation have succeeded can be seen in their participation in the euro. This development could lead the way for new EU members as the prospect of joining the euro may positively influence the macroeconomic policies of candidate countries.
2.2.3 Microeconomic and institutional reforms
In addition to macroeconomic stability, candidate countries must also imple- ment change at the microeconomic level. Such changes include the establish- ment of free interplay of market forces, the elimination of barriers to market entry and exit, and enforcement of property rights. They also have to com- ply with the obligations of membership and adopt the acquis 25 (European Commission (2001e)). Microeconomic reforms and institution building are key in making the transition from a centrally planned economy to a market economy and largely overlap reform requirements for EU membership. Over- all, these reforms are multi-dimensional26 and more difficult to quantify and
24TheMaastricht Treaty spells out five criteria:
- Successful countries must have inflation rates no more than 1.5% above the average of the three countries with the lowest inflation rate in the Community.
- Long-term interest rates should be no more than 2% of above the average of the three lowest inflation countries. This is to ensure that inflation convergence is lasting because otherwise higher expected future inflation in a country would be reflected in higher long- term interest rates.
- The exchange rate of a country should remain within the “normal” band of the ex- change rate mechanism without tension and without initiating depreciation for two years.
- The public debt of the country must be less than 60% of GDP.
- The national budget deficit must be less than 3% of GDP (European Commission (2002d)).
25“This requires the administrative capacity to transpose European Community leg- islation into national legislation, to implement it and to effectively enforce it through appropriate administrative and judicial structures.” (European Commission (2001e, p.5))
26The EBRD categorises the core aspects of reform which are essential for a market economy. They comprise privatisation, governance and enterprise restructuring, price
2.2. Key economic indicators 10
compare than macroeconomic indicators.27
The legacy of authoritarian regimes in pre-accession Greece, Portugal and Spain was characterised by excessive state interventions, inefficient industries with low productivity, structural deficiencies (i.e. rigid labour markets, ad- ministered prices, underdeveloped financial sectors) and little exposure to international competition. These countries lacked the institutions (such as effective competition law) necessary for a functioning market economy.
The CEECs faced similar problems after the breakdown of the commu- nist system. They implemented reforms to redirect their centrally planned economies to market-based economies. After twelve years of transition, it has become clear that structural adjustments and changes in economic in- stitutions take time and must be underpinned with strong government com- mitment to reform. Although the European Commission now classifies all CEECs except Bulgaria and Romania as functioning market economies ca- pable of coping with the competitive pressures of the EU, CEECs still face structural and institutional problems (e.g. low levels of financial interme- diation and problems in implementing and enforcing bankruptcy laws). In the laggard transition countries, soft budget constraints of firms persist and governments are still largely influenced by interest groups.
The prospect of EU membership can strongly leverage reform efforts in the candidate countries that seek to meet the criteria for entering the EU and can act as an “outside anchor” in the transition process (Bergl¨of and Roland (1997)). EU membership was a driving force for economic reforms and institution-building in Portugal and Spain.28 The prospect of member- ship can thus support a binding commitment to economic reforms and make economic changes more acceptable. An overall political consensus on advanc- ing reforms helps to resist vested interests29 and reduces the danger of policy reversals.
liberalisation, trade and foreign exchange systems, as well as the liberalisation and reforms of financial institutions (EBRD (2001)).
27For in-depth discussion of the southern European countries refer to Katseli (1990), Macedo (1990), Vi˜nals et al. (1990) and to the OECD (1986a), OECD (1986b) and OECD (1986c). TheEBRD (2001) and theEuropean Commission (2001e) provide detailed background information on CEECs. We refer here to these publications.
28Greece was reluctant to implement economic changes for its first decade of membership (see Section 2.4).
29Large groups opposing EU membership and reforms that accompany membership have emerged in applicant countries. Influential agricultural lobbies, especially in Poland, reject membership (Inotai (1999)). On average, 59% of people in the candidate countries think that membership would be a “good thing.” Support varies considerably across countries.
In Estonia and Latvia, only 33% of the population think their nation should join the EU, while in Romania 80% of people favour membership (European Commission (2001a)).
2.3. Challenges to enlargement 11
2.3 Challenges to enlargement
2.3.1 Agriculture in southern and eastern Europe
Baldwin (1994) describes agriculture as a “political land mine” in any EU enlargement discussion. To understand why agriculture remains one of the thorniest issues in EU enlargement, one only needs to look at the dominant role the agrarian sector plays in accession countries and the central impor- tance of agricultural spending in the EU budget.
In fact, agriculture’s contribution to EU GDP has been declining. It had a gross value added of 3.4% of EU GDP in 1986 (EU1230) and just 2.1% in 2000 (EU15). The gross value added of the agricultural sectors in the southern Europe group was much higher before accession, ranging between 5.6% in Spain and 16.2% in Greece. Similarly, the agricultural sector plays a far greater role in the economies of today’s aspirants than in those of current member countries. Furthermore, the share of people employed in the agricultural sector is larger in both country groups than in the EU. In 1986, between 18% (Spain) and nearly 29% (Greece) of all employed people worked in the agricultural sector, while in the EU12 only 8.5% were employed in agriculture (see Figure 6.7 in the appendix to this chapter). Among CEECs, except for the Czech Republic, more people are employed in agriculture compared to the EU15 (only 5% in the EU15 in 2000). In 2000, 43% of workers in Romania were employed in agriculture, 25% in Bulgaria and 19% in Poland (see Figure 6.8 in the appendix to this chapter).
Despite its minor contribution to EU GDP, agricultural spending dom- inates the EU budget.31 The combination of a huge agrarian sector in post-communist countries and the importance of agricultural spending in EU raises the question of how to integrate applicant countries into the EU’s Common Agricultural Policy (CAP). Agriculture was a central issue in Greek accession negotiations as it set the precedent for Spain and Portugal (Pre- ston (1997)). Greece, Portugal and Spain all aspired to inject their interests into EU agricultural policy. Since their full integration into the CAP, they have continued their efforts at influencing agricultural spending for their own benefit.32 At the time of this writing, the agriculture chapter of the acquis had been opened with all accession countries except Romania, but no coun- try had managed to complete the initial negotiations. At the beginning of 2002, the European Commission (European Commission (2002c)) made its
30Figures for the EU9 were unavailable.
31About 56% of EU budget expenditures are related to agriculture (Eurostat (2001)).
32See section 2.3.4.
2.3. Challenges to enlargement 12
first proposal on integrating prospective members into the CAP, suggesting a ceiling on direct payments to farmers of 25% of the level paid out to EU farmers. This ceiling would then be raised gradually to 100% over ten years.
The Commission’s proposal displeased applicants, who felt betrayed by a policy that would give farmers in incumbent EU states four times as much financial help as them. Given the hard feeling on both sides, follow-up ne- gotiations on agricultural subsidies and quotas will likely be quarrelsome.33 The fundamental problem, however, is the costly, inefficient CAP itself. The Commission knows CAP reform is needed, but the political clout of EU15 farm lobbies essentially dooms efforts to amend the CAP.34The prospects of enlargement and higher cost within a decade could, however, provide incen- tives to initiate reforms of the CAP before new members enter the Union.
2.3.2 East-west migration
The treaty establishing the European Community grants free movement of workers and their dependents, as well as freedom of establishment in other member states. The treaty also abolishes discrimination based on nationality and administrative practices that might interfere with migration of workers (European Commission (2002d)). From this part of the treaty follows that many people in current member states are anxious about massive labour flows from the east to the west. They fear tougher competition for jobs and in- creased unemployment.35 Concerns about the east-west movement of labour, which are mainly based on large income gaps, labour market opportunities and geographic proximity, play a dominant role in the public debate about enlargement. The current discussion largely parallels the one that occurred before southern countries joined the EU, i.e. people feared massive inflows from the poorer southern European countries (see e.g. Preston (1997)).
Figure 6.9 in the appendix to this chapter depicts the difference between immigration and emigration for the years 1970-1998 for Greece, Portugal and Spain. The data here imply that unmanageable migration flows did not result
33The largest contributors to the EU budget, and notably Germany, have indicated that they consider the Commission’s proposal overly generous (Economist (2002)).
34After the first eastern enlargement round, reforms of the CAP probably will likely be even more difficult because of voting power of the new members and their interests in agricultural support (see below).
35Fears about labour flows from the east vary largely within the Union. They depend on both place of residence and education of people polled. Rather than spread evenly over Europe, migrants will most likely concentrate in certain regions, especially those which are close to the border where they compete predominantly with low-paid and unskilled jobs. Today, most CEEC nationals reside in Austria or Germany (European Commission (2001d)).
2.3. Challenges to enlargement 13
after the entrance of the new members or the introduction of unrestricted mobility.36 In fact, net emigration declined in all three countries.
One possible explanation for the moderate labour movements could be improvements of the domestic economic situation. The expectation of closing the income gap, along with social and cultural ties, likely influence the de- cision to stay home. While it is impossible to make exact predictions about migration flows from eastern Europe to incumbent EU member states, there is evidence such flows may be quite modest.37,38
On the other hand, the motivation to migrate may be stronger in CEECs, as they are relatively poorer than their southern European counterparts were when they joined. Furthermore CEECs and the EU15 are marked by stronger geographical proximity with long common borders. With respect to cross- border commuting, southern EU enlargement provides no relevant precedent for the next enlargement round.
2.3.3 Decision-making in an enlarged Union
The entrance of new countries will cause a shift in the voting power among members in the decision-making institutions of the EU. The need for insti- tutional change – and, in particular, decision-making in the Council of Min- isters – was acknowledged before southern enlargement took place.39 The need for change is even more urgent ahead of accession that could produce a Union with as many as 27 members. Decisions by the Council of Ministers, which largely set the EU’s legislative agenda, provide a good overall indicator of the influence of member states on EU politics. They are made by the rule of unanimity or qualified majority. With a larger number of member states, decision-making costs will increase (Buchanan and Tullock (1962, Ch. 6)) and stalemates will be more likely. To keep the EU functional even with 27 members, an intergovernmental conference was called in Nice in December
36Completely unrestricted labour mobility within the EU was only granted to the Greeks, Portuguese and Spaniards after a transition period of six years.
37Most studies (see e.g., European Commission (2001b), Straubhaar (2001)) suggest inflows of migrants will be rather moderate and pose no serious problems to labour markets.
These studies take into considerations various factors that might influence labour flows, e.g.
differences in per capita income, labour market opportunities and geographical proximity.
38Sinn (1999) suggests people from the east might only temporarily move westward.
Eventually, they will return home because of permanent higher costs abroad, such as visits home, high rents and the disadvantages of living in a foreign country.
39New members also send representatives to the European Commission, the European Parliament, and perhaps in the not-too-distant future to the Governing Council of the European Central Bank which influences the distribution of political power within the EU (seeBaldwin et al. (2001)).
2.3. Challenges to enlargement 14
2000 to decide on changes in voting rules and vote distribution.40
One target was the reduction of decisions which have to be taken by unan- imous agreement of all members.41 Granting veto power to a single country in a 27-member EU could deadlock decision-making.42 Qualified-majority rules have been extended to about two dozen articles of the treaty, but critical ar- eas have not been shifted to qualified majority rules.43 In the case of qualified majority voting, the number of votes for each member country are roughly based on population with more populous countries having more votes. Cur- rently, 71.26% of all votes (62 out of 87 votes) are necessary for obtaining a qualified majority. In Nice, member states agreed on changes of the qualified majority rule to integrate the future members in the decision-making body.
Under the new rule, a qualified majority would be obtained when a decision receives a certain threshold of votes.44A majority of member states must also approve the proposal. In addition, decisions have to be supported by at least 62% of the total population of the EU. With these two additional criteria, decision-making seems set to become even more convoluted than before.
The range of issues which have to be taken by qualified majority have widened with theSingle European Act, the Maastricht Treaty and theTreaty of Nice. In these decision-making procedures, blocking coalitions allow groups to pool their interests. The second enlargement increased heterogeneity of the EU. Ever since poor, agricultural countries gained representation on the Council (see Table6.3 in the appendix to this chapter), they have worked to promote their common interests, particularly in pushing through structural fund spending and support for certain agricultural products.45 An alliance of
40See Table6.3in the appendix to this chapter for changes of the distribution of votes after each enlargement round and for the planned distribution of votes after new members have been admitted.
41TheSingle European Act (signed 1986), which inaugurated the programme to complete the Union’s internal market, already extended the number of issues for which qualified majority voting instead of unanimity is required, especially on measures necessary to complete the common market in 1992 (European Commission (2002d)).
42Decision-making in the European Union was already complicate with just six member states. Under the Treaty of Rome, most decisions required a qualified majority after 1965. However, France refused to give up its veto power and boycotted meetings of the Council of Ministers for six months. In the beginning of 1966, the members agreed to a compromise (so-called Luxembourg compromise) giving veto power to each member state if “very important interests” for a certain country were concerned (Leonard (1998)).
43Provisions on taxation, e.g., continue to be subject to unanimity. In the area of cohesion policy, there will be a move to qualified majority only in 2007 after the adoption of a “multi-annual financial perspective” plan (European Commission (2002d)).
44The threshold will be successively increased to a maximum of 73.4%.
45For example, the Mediterranean countries (Italy, Portugal and Spain) became a block- ing minority after the second enlargement.
2.3. Challenges to enlargement 15
new member states from the east might also arise46 due to similar interests they share, in particular because of their lower income levels and dominant agrarian sectors.47
In summary, there are doubts about the successes in preparing the Union for the accession of up to 12 new countries. The decision-making process probably becomes more complicated after theTreaty of Nice has been imple- mented. Overall, there is a danger that the EU will lose functionality with 27 members.
2.3.4 Budgetary costs of enlargement
Budgetary implications are another key issue in the enlargement process.
As noted, EU spending policy is dominated by agriculture and structural spending (Eurostat (2001)) and applicant countries are underdeveloped and heavily reliant on agriculture.48 Thus, providing the new member states with equal eligibility to receive transfers would either require redistribution of resources from today’s recipients or a large increase of the EU budget.
At the European Council meeting in Berlin in 1999, the member states agreed on the EU financial framework for 2000-2006 with the objectives of maintaining budgetary discipline49 and preparing for EU enlargement.
Adjusting the financial framework to the latest developments,50 the Euro- pean Commission presented a proposal on integrating new members into the CAP51 and the structural fund (European Commission (2002b)). Almost all CEEC regions would qualify for structural funds if the current criteria on re- gional aid are applied.52 To avoid huge transfers, the Commission proposed partial integration of the new states and limiting total annual structural transfers to 4% of national GDP until 2006.53 Even then, eastern enlarge-
46With the inclusion of twelve new member states, the eastern European countries would have blocking power with 101 votes.
47Baldwin et al. (2001) introduce a more sophisticated measure that shows that the
“passage probability” (likelihood that a randomly selected issue would pass the Council of Ministers) dropped from 14.7% (EU9) to 9.8% (EU12). It would decrease from 7.8%
(EU15) to just 2.1% in a 27-member EU.
48Regions with GDP per capita below 75% of the EU average receive transfers (Objective 1 regions). Such spending accounts for two-thirds of all structural expenditures. Agri- cultural spending is related to the percentage of people working in agriculture (European Commission (2000)).
49Financial discipline is mirrored in a fixed resource ceiling of 1.27% of EU GDP.
50The Berlin framework envisaged the possibility of six new members in 2002, but saw as more likely the addition of up to ten new members in 2004.
51Discussed above in Section 2.3.1.
52GDP per capita in almost all CEE regions is below 75% of the EU average.
53Per capita transfers for structural expenditure for new members would be 137 Euro per
2.3. Challenges to enlargement 16
ment poses a separate problem. Some current member states will lose their Objective 1 status simply because the average EU per capita income will be lower once poor CEECs are included, so up to the end of 2006, at least, all current Objective 1 regions will be allowed to keep their status.
We can only speculate on how new members might try to influence the EU budget. The experience of southern enlargement teaches that new en- trants quickly learn to use EU transfer mechanisms for their own benefit.
Indeed, CAP and structural spending considerably increased after the sec- ond enlargement (see Figure 6.10 in the appendix to this chapter).54 We can therefore assume new member states will use their voting power to affect financial transfers and, as noted, poor countries will seek to enforce their interests and influence budgetary decisions.55
Like their southern European predecessors, the new entrants will pre- sumably be net recipients of EU transfers. Analogies can be made with their likely efforts at influencing structural and agricultural spending, as well as transitional arrangements concerning their financial obligations56 to the EU budget. However, spending for agricultural purposes and for structurally lag- ging regions were much lower at the time the southern countries joined the Union.57 It is therefore questionable whether the new members will be able to significantly increase the EU budget after 2006. In any case, the entry of the new countries from eastern Europe will sharply increase competition for EU transfers.
capita (about 2.5% of total GDP of the new members) in comparison to an average of 231 Euro for the four cohesion countries (Greece, Ireland, Portugal and Spain). This represents 1.6% of total GDP of the four cohesion countries (European Commission (2002b)).
54Kandogan (2000) shows that voting power of a country and its share of EU members’
receipts are significantly and positively correlated.
55Decisions on cohesion policy are subject to unanimity until the adoption of a new financial framework in 2007. Thus, all new members will havede facto veto power imme- diately after their accessions (probably in 2004 or 2005).
56Greece, Portugal and Spain were granted a reduction in their VAT payments (Leonard (1998)).
57However, budgetary problems already emerged in the early 1980s when the UK had to make disproportionately large contributions to the EU budget and high CAP spending threatened the EU budget. The problems were settled by granting allowances to the UK, which in return agreed on increasing the VAT contributions from 1% to 1.4%. Another budgetary crisis arose with the entrance of Portugal and Spain because the EU faced a budget deficit for 1987. Under the “Delors package,” the budget limit was set to 1.2% of GDP, VAT contributions increased to 1.9-2.0% and structural funds were set to double by 1993 (Leonard (1998)).
2.4. Convergence through membership? 17
2.4 Convergence through membership?
All countries in central and eastern Europe suffered dramatic declines in economic activity at the start of transition (see Figure 6.11 in the appendix to this chapter).58 As of 2000, only Hungary, Poland, Slovakia and Slovenia had surpassed their 1989 GDP levels in real terms. Nevertheless, in both 2000 and 2001, CEECs had an average growth rate that exceeded the EU15 average.59
Will CEEC growth rates be high enough to eventually catch up with EU member states? What can be expected from their integration into a large single market which has the potential to open new trade opportunities and improve investment conditions? Figure 6.12 in the appendix to this chapter reveals Portugal and Spain have been successful in moving to the EU average, while Greece only recently began to catch up.
The reasons for Greece’s poor performance in relation to Iberian countries are multifaceted,60,61but the variation in economic growth rates can be linked to the extent to which market economic reforms and market-supporting insti- tutions were implemented. Greece was reluctant to implement economic re- forms and liberalise its economy. It even abandoned some reforms. Greece’s state-owned sector grew in the aftermath of accession, its weak industries were heavily subsidised and the economic structure remained unchanged. In- stead, Greece rather shifted back to old industries (Preston (1997)) and com- petitiveness of Greek industry declined after 1981 (Arghyrou (2000)). The two Iberian countries, in contrast, promoted development of market mech- anisms on a large scale, for instance, by reducing subsidies to loss-making firms. They eventually succeeded in redeploying production to industries with comparative advantages (Larre and Torres (1991)).62
58This development is called a “transformation recession”. A multitude of explanations have been put forward focusing on demand-side factors such as the collapse of the Soviet Union and the breakdown of trade within the Council of Mutual Economic Assistance (CMEA), as well as supply-side arguments relating to disorganisation effects (see e.g.
Roland (2000)).
59The average growth rates of real GDP in CEECs were 4.0% in 2000 and 2.2% in 2001 (not including Bulgaria and Romania) (EBRD (2001)) compared to an average growth rate in the EU15 of 3.3% in 2000 (Eurostat (2002b)) and 1.5% in 2001 (Eurostat (2002a)).
60Generally, theoretical explanations for economic growth are numerous. Neoclassical growth models ascribe growth to the expansion of capital and labour, augmented by technological progress. Endogenous growth theory adds factors such as R&D and imperfect competition to explain growth. Olson (1996) argues that institutions and economic policies are essential for economic performance.
61For a thorough discussion, see e.g. Larre and Torres (1991).
62Despite achievements in economic reform, Portugal and Spain still face major chal- lenges, e.g. relaxing labour market rigidities (see OECD (1999) andOECD (2001c)).
2.4. Convergence through membership? 18
Economic development is also shaped by EU transfers to new member states, especially through structural fund spending intended to help poorer regions catch up with the rest of the EU. All southern European countries are still net recipients of EU structural funds.63 Spain and Portugal have largely used their money to promote productivity and infrastructure improvements, while Greece has spent most of its money on supporting public enterprises and other rent-seeking industries (Bosworth and Kollintzas (2001)). Thus, EU transfers to Greece have only modestly encouraged economic growth,64 and possibly provided perverse incentives by e.g. sheltering subsidised firms from competitive pressure.
According to neoclassical theory, the integration of poorer transition countries into the EU implies that foreign direct investment (FDI) will flow from rich to poor countries. Greece has not attracted significant inflows since joining the Union, while FDI inflows have increased for Portugal and Spain.65 To date, overall investment inflows to CEEC have been relatively low66 with large regional differences.67 Accession may help attract FDI through posi- tive expectations about future economic performance and as a guarantee of economic and political stability, but will not necessarily lead to higher FDI and will be directed to countries with a greater commitment to reform.
The opening up of borders between the EU and the acceding countries also offers new trade opportunities.68 Indeed, during the period 1988-1995, exports increased strongly in Portugal and Spain, but not in Greece. More- over, the export dynamics of Iberian countries were larger in the manufac- turing sector than in the primary goods sectors. Greek exports, in con- trast, grew stronger for primary products (Nagy (1999)). Trade between the EU and CEEC has increased strongly after the conclusion of association
63In 1988, these amounted to 0.5-2% of GDP for the respective southern countries (Larre and Torres (1991)).
64The inefficient use of those transfers is one reason infrastructure is still poorly devel- oped in Greece (Bosworth and Kollintzas (2001)).
65Bosworth and Kollintzas (2001) compare pre- and post-accession inflows of FDI into Greece, Portugal and Spain. Greece experienced a decline of FDI inflows falling from an average level of about 1.5% of GDP p.a. (during the five years before accession) to an average of around 1.0% of GDP p.a. (the average for the years after accession). In Portugal and Spain, FDI increased from an average of about 1% of GDP p.a. during the five years before accession to over 2% of GDP p.a. in the first five years after accession.
66At the end of 1997, EU direct investors had only about 5% of their total FDI assets in accession countries (Eurostat (2000b)).
67For instance, Hungary received FDI inflows of $163 per capita, while Bulgaria received just $60 per capita (EBRD (1999)).
68Trade liberalisation has been gradual in southern countries. Greece, in particular, was reluctant to open up its economy and only began to dismantle its tariff barriers in 1986.
A tax on imported goods remained in place until 1989 (Larre and Torres (1991)).
2.5. Conclusions 19
agreements69 and the degree of integration is already high.70 Therefore, the beneficial effects from integration might already be largely realised for indus- trial products. However, CEECs predominantly export low quality, low skill, labour-intensive products (European Commission (2001c)).
The experiences of Portugal and Spain suggest that membership in the EU can have growth-accelerating effects. In its first decade of Greece’s mem- bership, however, the country saw no performance gains.71 Closing the gap with incumbents seems to depend most on progress in structural reform and institutional change. In Portugal and Spain, and now belatedly in Greece, re- form has paid off. Basically, the possibility of EU membership acts incentive to make reforms, but convergence does not occur automatically.72
2.5 Conclusions
Geopolitical considerations and support for emerging democracies were the driving forces for admitting Greece, Portugal and Spain to the European Union in the 1980s. The EU’s upcoming eastern enlargement will be largely motivated by similar political reasons. The countries in the southern group entered the EU far poorer than the EU average and CEECs will do the same.
Both groups are relatively populous and agrarian.
The EU is qualitatively a different supernational structure from what it was 20 years ago. The southern countries entered a community of rich mem- ber states. CEECs will join a heterogenous EU with large income disparities.
The EU is no longer merely a customs union, but a sophisticated Economic and Monetary Union, and the requirements for entrance have changed. The accessions of southern countries were subject to few rules; indeed, Greece’s
69Also called Europe Agreements, these were signed by all candidate countries during 1991-1996 to establish a framework for bilateral relations between the EU and CEECs.
The central agreements are the establishment of a free trade area for industrial goods, lib- eralisation of capital movements and approximation of laws relevant for the EU’s internal market (European Commission (2001c)).
70In 1999, CEECs exported about 64.8% of their total exports to the EU. They imported, on average, 58% of their total imports from the EU (European Commission (2001c)).
71Greece eventually got with the programme. In the early 1990s, Greece modified its economic policy to meet Maastricht criteria. Macroeconomic balance, culminating in admission to the euro, and progress in economic reforms were eventually achieved. During 1996-2000, Greece’s GDP growth exceeded the euro-area average (Bosworth and Kollintzas (2001),OECD (2001a)).
72Several studies evaluate welfare and macroeconomic effects of EU enlargement (e.g.
Breuss (2001),Baldwin et al. (1997),European Commission (2001b)). All of these studies reach the conclusion that both CEECs and the European Union gain from enlargement.
However, gains for CEECs will be much larger than for the Union.
2.5. Conclusions 20
EU entry did not even involve adoption of the Single European Act as was mandated for Portugal and Spain. All new entrants must meet the vastly tougher Copenhagen criteria and implement the entire acquis communau- taire.
Countries in both groups had to wait a long time before obtaining full membership. For the southern EU countries, the preparation of the opinion of the EU about an applicant country, the decision to open negotiations and the negotiation took almost six years (Preston (1997)). For the CEECs, the end of negotiations and the date for accession have yet to be announced by the European Commission. First-wave countries could join as early as 2004, but overall, eastern enlargement will take six or seven years as well.
Parallels between southern countries and CEECs can be drawn from the EU’s own efforts at dealing with enlargement. The thornier issues in enlarge- ment negotiations are typically unresolved until the very end of negotiations – or even put off until after countries have become members. As in the sec- ond enlargement round, long transition periods in the integration process seem likely in eastern enlargement to allow time for e.g. closing the price gap of certain agrarian products and to absorb migration flows. Southern EU enlargement transition periods lasted as long as ten years.73
Overall, both southern and eastern enlargement highlight the weaknesses of the Union’s functioning. Although the EU strongly needed to make reforms to cope with the second enlargement,74 major reforms were not undertaken until after Greece, Portugal and Spain entered the Union. Today, we can already foresee that the larger number of countries in the decision-making institutions will make reform more difficult. Instead of postponing reforms, EU leaders should recall the lessons of the second enlargement and use the upcoming enlargement as an opportunity to move ahead with reforms before the accession of new members.
73In Spain’s case, for instance, the limitations on fishing rights were still in place in 1994 (Richter (1995)).
74Duchˆene (1982, p. 40) remarks, “The crisis of the Community is likely to become the central issue of the southern enlargement and not, ..., the other way around.”
Chapter 3
On the Causes of Soft Budget Constraints: Firm-level
Evidence from Bulgaria and Romania
3.1 Introduction
The transition towards market-based economies in central and eastern Eu- rope offers a natural experiment for testing the widely held view in economics that competition and private ownership contribute to improved economic per- formance. Indeed, there is now a vast body of empirical literature examining firm performance in terms of ownership structure and degree of competition.
The consensus conclusion is that private companies perform better than state companies, though not necessarily in the case of private firms that were pre- viously state-owned or featured insider-privatisation (Boardman and Vining (1989), Konings (1997),Blanchard (1997),Frydman et al. (1999)), and that firms in more competitive industries also tend to perform better (Nickell (1996), Konings (1997), Brown and Earle (2000)).
This chapter takes up the question whether product-market competition and ownership structure can explain the prevalence of soft budget constraints.
The concept of soft budget constraints (SBCs) was introduced by Kornai (1980) and refers to a situation where loss-making firms are bailed out or refinanced. In Kornai’s (1980) view, bail-outs of loss-making firms reflect a paternalistic government attitude. The government wants to preserve em- ployment and the survival of firms even when they incur losses. Closely related to the paternalistic explanation of SBCs are political economy mod-