Review ARticle
https://doi.org/10.1038/s41558-019-0662-y
1Atmospheric and Environmental Research Inc., Lexington, MA, USA. 2Massachusetts Institute of Technology, Cambridge, MA, USA. 3University of Alaska Fairbanks, Fairbanks, AK, USA. 4Woods Hole Research Center, Falmouth, MA, USA. 5Alfred Wegener Institute, Helmholtz Centre for Polar and Marine Research, Bremerhaven, Germany. 6University of Bremen, Bremen, Germany. 7Jet Propulsion Laboratory, Pasadena, CA, USA. 8NOAA/PMEL, Seattle, WA, USA. 9Department of Geography, Texas State University, San Marcos, TX, USA. 10Lund University, Lund, Sweden. 11Pennsylvania State University, State College, PA, USA. 12Potsdam Institute for Climate Impact Research, Potsdam, Germany. 13Vrije Universiteit Amsterdam, Amsterdam, the Netherlands.
14Utah Climate Center/Department of Plants, Soils and Climate, Utah State University, Logan, UT, USA. 15United States Naval Academy, Annapolis, MD, USA. 16Environment and Climate Change Canada, Gatineau, Quebec, Canada. 17University of Gothenburg, Gothenburg, Sweden. 18University of Cambridge, Cambridge, UK. 19Naval Postgraduate School, Monterey, CA, USA. 20University of California, Irvine, CA, USA. 21University of Washington, Seattle, WA, USA.
22University College London, London, UK. 23NASA Langley Research Center, Hampton, VA, USA. 24University of Wisconsin, Madison, WI, USA. 25Finnish Meteorological Institute, Helsinki, Finland. 26University of Leipzig, Leipzig, Germany. 27Lamont-Doherty Earth Observatory, Columbia University, Palisades, NY, USA. 28Gwangju Institute of Science and Technology, Gwangju, South Korea. *e-mail: jcohen@aer.com
S
ince the 1990s, Arctic winter temperatures have shown an almost monotonic warming trend, at an accelerated rate rela- tive to the rest of the globe. The period from the 1990s to the present is identified as the modern period of AA (Supplementary Fig. 1a). AA is strongest over the Arctic Ocean in autumn and winter, whereas during the summer it is weaker and shifted over land and the Greenland ice sheet1,2. The most notable sign of climate change in the Arctic is the rapidly declining sea ice extent in summer and early autumn3 in response to various reinforcing feedbacks4–6.Over the same period, land temperatures for eastern North America, and especially eastern Eurasia, in winter have exhi bited almost no warming, and indeed cooled from 2000–2013, followed by more variable winters. The recent midlatitude winter cooling period has coincided with an increase in severe winter weather events2,7–9.
The rapid warming of the Arctic coupled with cooling or lack of warming in the midlatitudes has resulted in the diverging of Arctic and midlatitude temperature trends (Supplementary Fig. 1b). The pattern of a warm Arctic and cold continents/Eurasia (WACC/E) is the strongest observational evidence that some unaccounted-for mechanism has been offsetting greenhouse-gas-forced warming over the Northern Hemisphere (NH) midlatitudes10–13.
Theories proposed for the midlatitude winter cooling include internal variability and tropical forcing but also a new idea—AA.
Over a decade ago, it was proposed that Arctic warming (1988/89
to 2007/08) and associated changes in boundary forcing, including Arctic sea ice melt and increasing extent of autumn snow cover, influence midlatitude weather through a stratospheric pathway that favours cold temperatures across the midlatitudes14,15. A com- posite of the temperature anomalies of the 11 subsequent winters (2009–2019; winter defined here as the months January–March) shows a similar pattern of variability, suggesting that the same physical mechanism is responsible for the WACC pattern observed in 1989–2008 and 2009–2019 (Supplementary Fig. 2). However, some differences between the two periods are noted and discussed in the Supplementary Information and in Supplementary Fig. 3. The WACE pattern was also detected during the previous AA period in the 1930s–1940s, which provides further observational support that winter continental cooling may be a forced response to AA16.
The resiliency of midlatitude winter weather was not projected by climate models17, fanning climate change scepticism, which can impede the implementation of mitigation and adaptation policies.
Therefore, linking accelerated Arctic warming or AA to increased midlatitude severe winter weather is societally relevant and impor- tant, as it would assist the public and private sectors to prepare for adverse weather both in the short and long term.
Yet the challenge of demonstrating a linkage between AA and severe winter weather is daunting, given differing observational analysis methods and the large spread in modelled responses (see Supplementary Information and Supplementary Fig. 4 for a
Divergent consensuses on Arctic amplification influence on midlatitude severe winter weather
J. Cohen
1,2*, X. Zhang
3, J. Francis
4, T. Jung
5,6, R. Kwok
7, J. Overland
8, T. J. Ballinger
9,
U. S. Bhatt
3, H. W. Chen
10,11, D. Coumou
12,13, S. Feldstein
11, H. Gu
14, D. Handorf
5, G. Henderson
15, M. Ionita
5, M. Kretschmer
13, F. Laliberte
16, S. Lee
11, H. W. Linderholm
17,18, W. Maslowski
19, Y. Peings
20, K. Pfeiffer
1, I. Rigor
21, T. Semmler
5, J. Stroeve
22, P. C. Taylor
23, S. Vavrus
24, T. Vihma
25,
S. Wang
14, M. Wendisch
26, Y. Wu
27and J. Yoon
28The Arctic has warmed more than twice as fast as the global average since the late twentieth century, a phenomenon known as Arctic amplification (AA). Recently, there have been considerable advances in understanding the physical contributions to AA, and progress has been made in understanding the mechanisms that link it to midlatitude weather variability. Observational studies overwhelmingly support that AA is contributing to winter continental cooling. Although some model experiments sup- port the observational evidence, most modelling results show little connection between AA and severe midlatitude weather or suggest the export of excess heating from the Arctic to lower latitudes. Divergent conclusions between model and observational studies, and even intramodel studies, continue to obfuscate a clear understanding of how AA is influencing midlatitude weather.
NATURe CLIMATe CHANGe | www.nature.com/natureclimatechange
Review ARticle NATuRe ClimATe ChANge
tabulation of observational and modelling studies). Simple causal- ity statements for a general audience are not yet defendable. And despite a flurry of research and advances in the mechanisms linking AA to midlatitude weather, the topic remains contentious.
In this Review, we focus on winter weather. For a brief discussion on AA and extreme weather, see Supplementary Information. A sep- arate review on summer mechanisms has recently been published18. The character of Arctic amplification
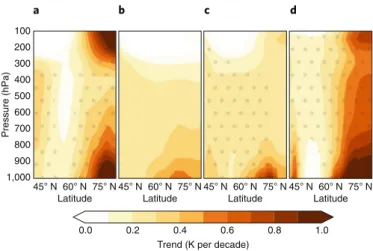
AA is evident in the zonal-mean winter air-temperature trends for the NH and Arctic between 1980–2019, from the surface to the upper atmosphere (Fig. 1; averaged in four reanalysis datasets, henceforth known as ‘observations’ in this Review). Statistically significant warming extends throughout the troposphere but is strongest near the surface, with a second maximum in the upper troposphere and stratosphere (Fig. 1a). This winter polar strato- sphere warming trend is also evident in radiosonde data19. The Arctic warming ensemble-mean simulated in the Coupled Model Intercomparison Project-5 (CMIP5) is shifted south, and lacks the magnitude and vertical extent of the observations. Also, the second warming maximum in the upper troposphere and stratosphere is absent in CMIP5 compared with the observations (Fig. 1b). The shallower simulated warming could be related to coarse vertical resolution20 or an Arctic temperature inversion that is too strong21, which would inhibit the vertical distribution of surface warming.
Besides coupled models, we also analysed the vertical distribution of temperature trends in the Atmospheric Model Intercomparison Project (AMIP) forced with observed sea surface temperatures (SSTs) and sea ice. The results are similar to those of CMIP5, with relatively shallow and southward-shifted Arctic warming and a mostly absent secondary maximum in the lower stratosphere (Fig. 1c and Supplementary Fig. 5). Further analysis of individual ensemble members reveals that several members closely match the distri- bution of observed temperature trends, with deeper Arctic warm- ing in the lower- to mid-troposphere and a secondary maximum in the stratosphere (Supplementary Fig. 6); the individual ensemble member that best matches the observations is shown in Fig. 1d.
The large ensemble spread suggests that simulated and observed differences could be due to natural variability and therefore the observed temperature trends do not necessarily represent a forced response to AA.
Arctic amplification mechanisms
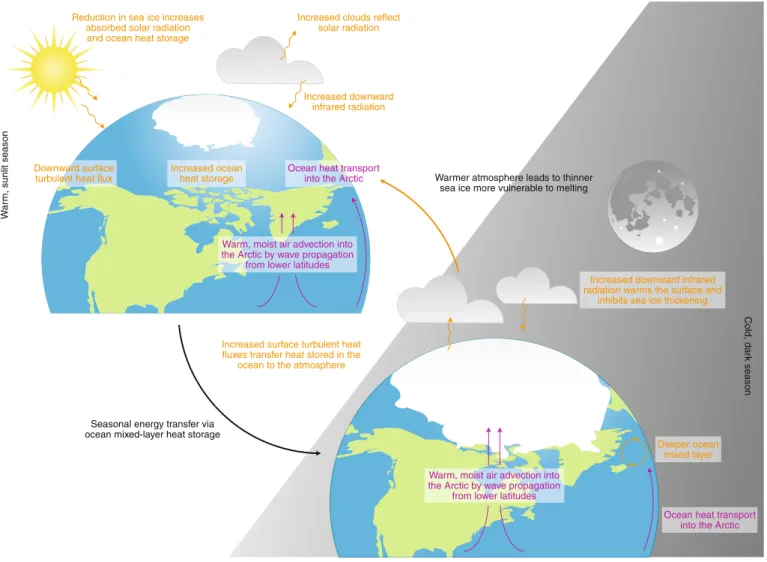
Understanding of contributors to AA has evolved considerably in the past decade, emphasizing that a suite of mechanisms is responsible for the enhanced sensitivity of the Arctic6,22,23. These mechanisms can be divided into local and remote forcings (summarized in Fig. 2). The local forcings include snow, sea ice albedo, cloud and ice insulation feedbacks, which are typically considered the triggers in the causal chain leading to AA3,24,25. Remote forcing mechanisms involve atmo- spheric and ocean heat and atmospheric moisture transport from the midlatitudes and tropics into the Arctic26,27. Recent studies argue that remote mechanisms have accelerated sea ice disappearance during both winter28–31 and summer28,29,32,33 and are important contributors to AA. Thus, local and remote mechanisms may interact and amplify one another24. For instance, tropical convection-forced warming through the transport of heat and moisture may be further amplified by local feedback processes, such as increased clouds.
Perhaps the best-known Arctic feedback is sea ice albedo34, caused by the stark albedo difference between ice-free ocean and snow-covered sea ice surfaces (about 7% and about 80% reflectance, respectively). The long-term darkening of the Arctic surface result- ing from sea ice loss has been observationally confirmed, indicat- ing a mean surface albedo reduction from 0.52 to 0.48 since 197935. The increase in vegetation over Arctic land further contributes to a darkening surface at high latitudes36. Additionally, rapid continental snow cover loss in spring lowers the surface albedo and allows the underlying soil to dry out more rapidly, favouring earlier and more intense warming of high-latitude land areas37.
During winter, insulation by sea ice wanes during AA25. The anomalously low extent of summer sea ice exposes darker ocean water to sunlight, allowing greater absorption of solar radiation, thus warming the Arctic upper-ocean mixing-layer and promoting anomalous latent and sensible heat fluxes in the autumn. Subse- quently, this process delays sea ice-growth in the autumn/winter, allowing for warmer and moister Arctic air masses that further con- tribute to AA38–40. Analysis of surface turbulent flux trends indicate enhanced fluxes from the ocean to the atmosphere in the Chukchi and Kara Seas in recent years39,41–43.
The sea ice albedo feedback is not the only important mecha- nism contributing to AA44. A new consideration of equal or pos- sibly more importance is the local feedback related to the impact of low-level mixed-phase clouds45. The net radiative effect of Arctic clouds is to warm the surface via enhanced downward longwave radiation for much of the year (predominantly during the polar night in winter), except in June and July when the reflection of solar radiation by clouds may dominate, cooling the surface46,47. The impact of clouds is further complicated by the seasonal evolution of surface albedo, including the summer sea ice melt and production of melt ponds48. CMIP5 model results disagree on whether Arctic cloud changes dampen or amplify AA4,47.
Emerging evidence suggests that downward longwave radiation from anomalous cloud cover during winter can hinder the growth of sea ice49–55. In addition, analysis of CMIP5 models indicates that changes in downward longwave radiation flux from a cloudless atmosphere, rather than the sea ice albedo feedback, is the largest contributing factor to simulated AA47. Observations indicate that trends in downward longwave radiation are positive almost every- where, owing to increased atmospheric water vapour over the Arctic Ocean for all seasons2. Additional discussion on AA mechanisms is included in the Supplementary Information.
Despite the robust signal of AA, knowledge of the mecha- nisms remains incomplete. The roles of meridional (poleward)
a b c
Latitude 45° N 60° N 75° N
d
Trend (K per decade)
0.2 0.4 0.6 0.8 1.0
0.0 100
200 300 400 500 600 700 800 900 1,000
Pressure (hPa)
Latitude 45° N 60° N 75° N Latitude
45° N 60° N 75° N Latitude
45° N 60° N 75° N
Fig. 1 | Observed and ensemble mean temperature trends show large discrepancies in winter. a, Winter (December, January, February: DJF) and zonal-mean air-temperature trends from December 1980 to February 2019 for the average of MERRA-2, ERA5, JRA-55 and CFSR reanalysis products for DJF. b, Same as a but for the CMIP5 multimodel ensemble mean historical simulation through 2004 and RCP8.5 simulation thereafter.
c, Same as a, but for the AMIP multimodel mean. d, Same as c but for the AMIP ensemble member that best matches the reanalysis mean based on pattern correlation. Stippling indicates significant trends with P < 0.05 after the correction for false discovery rate was applied135.
NATURe CLIMATe CHANGe | www.nature.com/natureclimatechange
Review ARticle
NATuRe ClimATe ChANge
atmospheric heat and moisture transport, oceanic heat transport from midlatitudes into the Arctic28,29 and particularly the impor- tance of the episodic deposition of heat and moisture at the synoptic scale are just beginning to be understood40,56–58. A more comprehen- sive understanding of the chain of events leading to AA and the individual contributions of each process is needed, as the magni- tude and mechanisms of AA fundamentally influence the character and likelihood of Arctic and midlatitude connections59.
Arctic midlatitude linkages
Extensive new sea-ice-free areas in autumn and thinner sea ice in early winter months allow for greater heating of the overlying atmo- sphere, which represents a possible mechanism linking AA to mid- latitude weather. Preferential warming of the Arctic atmospheric column leads to increased geopotential height thickness and a reduced meridional gradient as described by the geopotential ten- dency equation60, which can slow the polar jet stream. It has been the- orized that weakened zonal winds increases the likelihood of slower and more amplified Rossby waves, enhancing the possibility of block- ing situations1 and meridional transport of air masses associated with extremes. However, this idea has encountered scepticism61,62.
A research challenge is to identify and understand possible links of thermal heating from Arctic sources to midlatitude weather. Amplified
warming does increase the potential for Arctic change to influence weather outside the region, especially if it increases the likelihood of high-latitude blocking. Blocking results from waves breaking within the background flow, which makes weather systems move more slowly or even become stationary63,64. Like boulders blocking a river, once an atmospheric block forms, its impacts are felt both upstream and downstream of the block. Moreover, blocking events have been impli- cated as precursors for sudden stratospheric warmings65–67, which in turn influence winter weather for up to two months68–70.
Below-normal temperatures during the winter months over Europe and North America are associated with blocking anti- cyclones over high-latitude areas of northwestern Eurasia and Greenland, respectively3,71–76. In addition to cold temperatures, recent observations show that high-latitude blocking is related to more frequent heavy snowfalls in the eastern United States74, and an index of disruptive northeastern US snowfalls shows that over the most recent decade the population centres of this region have been adversely impacted by snowstorms three times as often as in any previous decade (Supplementary Fig. 7).
Midlatitude weather is highly complex, strongly steered by nonlinear jetstream dynamics including the impact of anomalous transient storm systems on the growth and phasing of planetary waves77, the onset and maintenance of blocking, and the strength
Increased clouds reflect solar radiation Reduction in sea ice increases
absorbed solar radiation and ocean heat storage
Increased downward infrared radiation
Downward surface
turbulent heat flux Increased ocean heat storage
Warm, sunlit season Cold, dark season
Ocean heat transport into the Arctic
Warm, moist air advection into the Arctic by wave propagation
from lower latitudes
Increased surface turbulent heat fluxes transfer heat stored in the
ocean to the atmosphere
Increased downward infrared radiation warms the surface and
inhibits sea ice thickening
Warm, moist air advection into the Arctic by wave propagation
from lower latitudes
Deeper ocean mixed layer
Ocean heat transport into the Arctic Warmer atmosphere leads to thinner
sea ice more vulnerable to melting
Seasonal energy transfer via ocean mixed-layer heat storage
Fig. 2 | Mechanisms of Arctic amplification are complicated. This schematic diagram illustrates the important processes and energy flows influencing Arctic amplification. Local processes, such as sea ice albedo feedbacks, changes in surface turbulent fluxes, clouds, ocean heat storage and ocean mixed- layer change, are indicated in orange. Remote processes, such as atmosphere and ocean heat transport, are indicated in purple. An important aspect of Arctic amplification is the seasonal transfer of energy from the sunlit to the dark season, denoted by the graduated arrow (orange–black).
NATURe CLIMATe CHANGe | www.nature.com/natureclimatechange
Review ARticle NATuRe ClimATe ChANge
and location of the Siberian High78. Further complicating attri- bution of weather events is that possible signals, including Arctic forcing, are masked by internal variability79 creating signal inter- mittency78,80. Arctic-midlatitude linkages may also be sensitive to decadal variability in global SSTs81–83. The complexity of midlatitude weather and the dependence on the background flow challenges the ability to link AA to midlatitude weather, especially episodic events such as cold air outbreaks and heavy snowfalls.
Hemisphere-wide response to AA
The exchange of heat from the Arctic Ocean to the atmosphere during delayed re-freezing in autumn and reduced vertical stability can intensify storm systems over the Arctic84–86. The nonlinear inter- action between storm systems and planetary-scale waves contributes to changes in the atmospheric circulation, which can construc- tively or destructively interfere with the large climatological stand- ing waves; enhancement (destruction) of these waves can increase (decrease) upward propagation of energy in early to mid-winter that weakens (strengthens) the stratospheric polar vortex77,87,88. The tropospheric response to either a weakened or strengthened polar vortex is hemispheric in scale and most closely resembles the nega- tive or positive Arctic Oscillation (AO), respectively15,89,90.
The earliest modelling studies demonstrated that the complete melt of Arctic sea ice forced a negative AO temperature response91,92. Follow-up studies reaffirmed that regionally reduced sea ice extent predominately forced a negative AO circulation response with increased sea level pressure over the Arctic and decreased sea level pressure over the midlatitudes in winter93–95.
However, a numerical study published in 2005, in which the Hadley Centre Atmosphere-3 (HadAM3) global climate model (GCM) was forced with pan-Arctic sea ice variability, found no signi ficant relationship between differences in sea-ice concen- tration and the AO96. Following this, a number of large ensemble modelling studies have come to the same conclusion—that is, there is little modelling evidence of an atmospheric response to the pan-Arctic sea ice trend97–99. One possible explanation for the discrepancy in the hemispheric response between region- ally and pan-Arctic-forced sea ice anomalies is that simultaneous forcing from different regions negate each other51,100,101. Although Scandinavian/Ural blocking has been shown to weaken the polar vortex, Eastern Asia/Northwest Pacific blocking has been shown to strengthen it102. The response of the polar vortex to sea ice loss is dependent on the location of the ensuant blocking, which may help to interpret the diverse response to sea ice loss in models.
Regional response of AA
Previous reviews have focused on the influence of AA on midlati- tude weather related to the hemispheric response projected onto the AO pattern of variability7,9. However, research now suggests that regional anomalies in sea ice or temperature can force regional responses in midlatitude weather. These have focused on the rela- tionship between sea ice loss and/or warming in the Barents–Kara Seas region with cold temperatures across Siberia and Central Asia for the recent period (that is, the WACE pattern)71,103–107. A link between sea ice melt and/or warming over the Chukchi Sea and central North American cold temperatures12,80 and sea ice melt and/or warming in and around Greenland and eastern North American and Northern European temperatures have also been suggested74,108,109. Additional detail on the regional response to AA is provided in the Supplementary Information.
Although there is a lack of consensus between observational and modelling studies on the hemispheric response to sea ice loss, there is possibly more agreement on the downstream regional response to localized Arctic sea ice loss and/or warming. Analysis of recent Arctic sea ice concentration trends shows three main regions of sea ice retreat in winter: Barents–Kara Seas, Chukchi–Bering Seas and
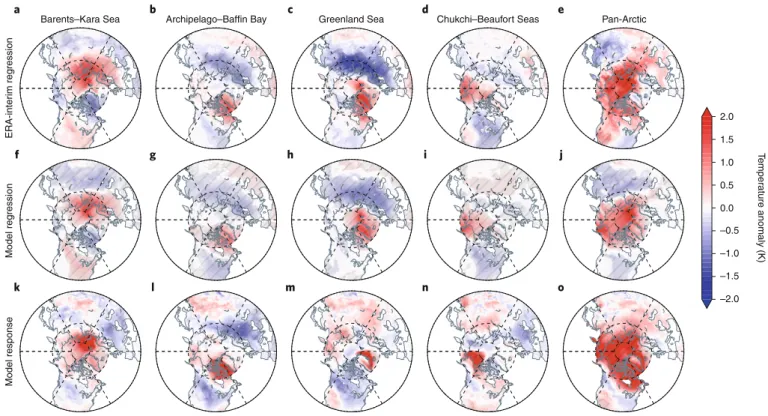
around Greenland (see Supplementary Fig. 8). In Fig. 3, we plot the temperature anomalies associated with above-normal winter temperatures regionally in the Arctic, in both the observations and the Hadley Centre Global Environmental Model-2 (HadGEM251).
Regional warming in the Barents–Kara Seas is linked to below normal temperatures across Central and East Asia. Regional warm- ing in the Canadian Archipelagos–Baffin Bay and Greenland Seas is associated with below-normal temperatures across Northern and Central Europe, Siberia and, to a lesser degree, eastern North America. Finally, regional warming in the Chukchi–Bering Seas is related to below normal temperatures across Central and Eastern North America. Somewhat consistent results were found when the HadGEM2 was forced with regional sea ice loss51 (Fig. 3)—sea ice loss in the Barents–Kara Seas resulted in weak cooling across Eurasia, sea ice loss in the Canadian Archipelagos–Baffin Bay and Greenland Seas resulted in cooling across Europe, parts of Canada and the Eastern United States, and sea ice loss in the Beaufort–
Chukchi Seas resulted in cooling in parts of North America.
However, even though the regression of pan-Arctic warmth with hemispheric temperatures yields midlatitude cooling in both the observations and models, pan-Arctic sea ice loss does not force a weakened polar vortex in the models51,100, and cooling across the midlatitudes is nearly absent (Fig. 3). Therefore, although models do simulate regional cooling forced by regional sea ice loss, the cumulative response to each separate region does not add linearly but rather destructively, resulting in overall warming across the continents100,101.
In general, the cooling from the modelling experiments is weaker than that derived from observational analysis. Additionally, while simulated regional sea ice loss results in downstream localized cooling, pan-Arctic sea ice loss results in warming across the Arctic and adjacent land areas, with almost no discernible cooling51. Observational analysis versus modelling
Based on the consideration of a large majority of observational studies, we identified a list of proposed physical processes and/
or mechanisms linking Arctic change and midlatitude weather, ordered from high to low confidence. These include: increasing geopotential thickness over the Arctic2,110; weakening of the thermal wind3,111; modulating stratosphere–troposphere coupling67,89,112; exciting anomalous planetary waves or stationary Rossby waves in winter; changes in the atmospheric circulation and associated strengthening of the Siberian high and Aleutian low28,98,113; altering storm tracks and behaviour of blockings86,114,115.
The dynamical pathway considered most robust involves Barents–Kara sea ice loss contributing to a northwestward expan- sion of the Siberian High or Ural blocking leading to cold Eurasian winters (for example, refs. 9,106,107,116). The Barents–Kara Seas region has experienced the greatest winter sea ice loss in the Arctic (Supple mentary Fig. 8). This leads to large heating of the overlying atmosphere, dilation of the geopotential heights and a weakening of the westerly wind that favours increased blocking over the Barents–
Kara Seas and adjacent Ural Mountains region107,117. A ridge over northwestern Eurasia with a trough over northeastern Eurasia is favourable for the direct forcing of planetary waves onto the strato- sphere via enhanced vertical propagation of wave energy88,89,118. This can lead to wave breaking and disruption of the stratospheric polar vortex119. Considerable disruption of the polar vortex is then followed by a negative AO response and widespread cold tempera- tures across the NH midlatitude continents69,112 but with a focus across Asia70.
The simulated response to Arctic sea ice loss has spanned a wide spectrum from no response to warming and cooling of the midlatitudes. Early modelling studies found that low sea ice, either pan-Arctic or east of Greenland and extending into the Barents–
Kara seas, forced cold temperatures across the NH continents similar
NATURe CLIMATe CHANGe | www.nature.com/natureclimatechange
Review ARticle
NATuRe ClimATe ChANge
to the negative AO temperature pattern91–95. However, since then, modelling studies have supported the entire range of atmospheric response, including cold continents12,69,71,105,106,112,116,120,121, a disrupted stratospheric polar vortex comparable to observed69,112,118,121 and weaker and/or delayed relative to observed51,100, a negative AO118,122, a positive AO123,124 with mild continental temperatures125 and finally no robust impact on midlatitude weather97–99,126.
Still, despite the wide spectrum of modelled responses, in most modelling investigations, especially those involving large ensem- bles, the atmospheric response to low sea ice forcing is small relative to the internal variability and does not include cold winters across the NH midlatitude continents. Therefore, based on these studies, observed cooling is attributed to natural variability12,97–99,124,126. However, some of the differences in observed and modelled polar vortex behaviour may be due to the fact that most GCMs are ‘low-top’ models and only poorly resolve the stratosphere and stratosphere–troposphere coupling mechanisms88,127. Some recent
‘high-top’ climate models with improved stratospheric variability support an atmospheric response to sea ice loss more consistent with observational analysis100,112,121.
Recent NH winter temperature trends
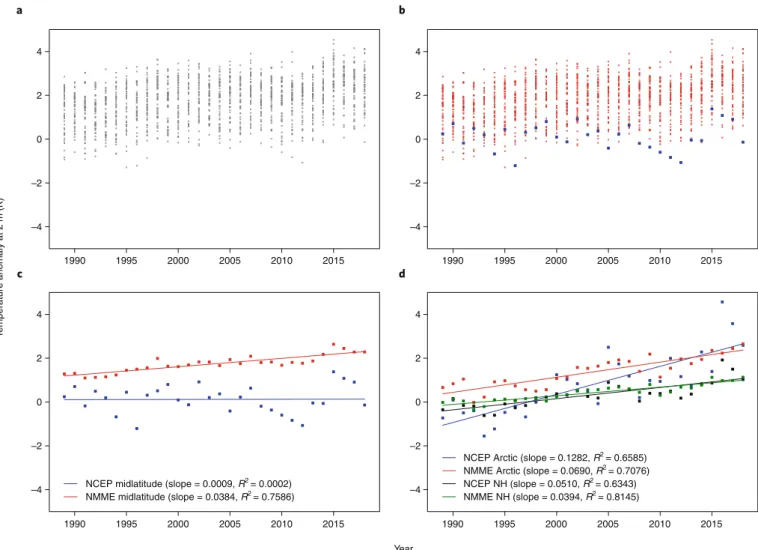
Temperature anomalies for the midlatitude continents (all land grid points 30°–60° N, for December to March from 1988/89 through 2018/19 from observations and the corresponding predicted tempe- rature anomalies from the North American Multi Model Ensemble (NMME128) initialized with atmospheric and oceanic conditions including sea ice on 1 November for each year) display little orga- nization other than a warm temperature bias (Fig. 4a). A fairly
wide scatter of predicted and observed temperature anomalies exists over the period, which could be considered representative of the noisy nature of midlatitude weather and/or the lack of consensus in Arctic forcing.
Comparison of observations and the model forecast midlatitude continent temperature anomalies separately, however, reveals some systematic patterns (Fig. 4b). The observed temperature anomalies are always on the cold extreme of the envelope of model forecasts, and many observed winters are even colder than the most extreme cold ensemble member. When the observed values are plotted with the ensemble mean of the model forecasts only, a clear dichotomy appears (Fig. 4c)—the observed value is colder than the ensemble mean in the era of AA without exception. The models predict that the midlatitudes should be warming at a rate nearly identical to the warming for the entire NH of +0.039 °C per year. In contrast, the observations show that temperatures across the midlatitude conti- nents have remained nearly constant and the model-simulated rate of warming is diverging from the observed rate by about +0.38 °C per year. Similarly, trend lines diverge in the Arctic, with the simu- lated rate of Arctic warming only half of that observed (Fig. 4d).
In contrast, comparison of the tropics, midlatitude oceans (Supple- mentary Fig. 9) and even NH land and ocean temperature for both the observations and the model forecasts shows good agree- ment between the model-predicted and observed hemispheric winter temperatures trends (Fig. 4d), despite the divergence in midlatitude land and Arctic winter temperatures (Fig. 4c). Finally, in the Supplementary Information and Supplementary Fig. 10, we present summer temperature trends where the observed and simulated midlatitude temperature trends are comparable.
a b c d e
f g h i j
k l m n o
Barents–Kara Sea Archipelago–Baffin Bay Greenland Sea Chukchi–Beaufort Seas Pan-Arctic
ERA-interim regressionModel regressionModel response
2.0 1.5 1.0 0.5 0.0 –0.5 –1.0 –1.5 –2.0
Temperature anomaly (K)
Fig. 3 | Observed and simulated winter temperature relationships to Arctic warming share similarities regionally. a–e, Observed NH near-surface air-temperature anomalies for all days when 850-hPa temperature anomalies were between 0.5 and 3.0 standard deviations above the climatological average for all winters (DJF) 1950–2019 in (a) Barents–Kara Sea, (b) Canadian Archipelago–Baffin Bay, (c) Greenland Sea, (d) Chukchi–Beaufort Seas and (e) Pan-Arctic regressed onto NH surface temperatures. Anomalies are calculated relative to climatological averages from 1981 to 2010. f–j, Same as for a–e but for atmospheric output from the ensemble-mean HadGEM2 GCM. k–o, October-to-March mean near-surface air-temperature responses in HadGEM2 model simulations from ref. 51 to observed sea-ice loss in the (k) Barents–Kara Sea, (l) Canadian Archipelago–Baffin Bay, (m) Greenland Sea, (n) Chukchi–Beaufort Seas and (o) Pan-Arctic. Hatching denotes statistically significant response at the 95% confidence level using the Student’s t-test.
ERA-Interim used for observational data.
NATURe CLIMATe CHANGe | www.nature.com/natureclimatechange
Review ARticle NATuRe ClimATe ChANge
These plots represent a new paradigm of two distinct and diver- gent camps on the influence of AA on midlatitude winter weather.
Although the NH is warming in the GCMs at a rate comparable to the observed warming, the distribution of that heating is clearly different in the era of AA. The models suggest that during AA, anomalous winter warming is more equitably distributed between the Arctic and the midlatitudes so that both regions are warming at a rate comparable to or faster than the hemispheric average. In contrast, the observed temperature trends coupled with observa- tional studies suggest that AA favours the increase of the meridio- nal exchange of air masses between the Arctic and the midlatitudes, resulting in the NH midlatitude continents cooling relative to the whole NH as Arctic warming accelerates. This asymmetric distribu- tion of observed NH warming is consistent with the surface tem- perature anomaly pattern following polar vortex disruptions90.
Empirical studies have highlighted that the excessive Arctic heat is distributed vertically through the lower- and mid-troposphere rather than horizontally (Fig. 1). The vertical distribution of the heat in the Arctic that extends to the mid-troposphere supports
high-latitude blocking that further favours a poleward transport of heat from lower latitudes into the polar stratosphere that is condu- cive to disrupting the polar vortex. Following polar vortex disrup- tions, Arctic air is displaced into the midlatitudes, resulting in either cooling or a delay in the warming rate of the midlatitudes relative to the remainder of the NH. In contrast, model-simulated AA is relatively shallow but horizontally extensive (Fig. 1), which is only favourable for a weak disruption of the polar vortex that does not significantly cool the midlatitudes. A simplified explanation of the WACC pattern in the era of AA based on the majority of observa- tional analysis and model data is provided in Boxes 1 and 2.
Conclusions
Improved understanding and parsing of the influence of Arctic, global SSTs and internal variability on midlatitude weather provides a clear pathway for improving subseasonal to seasonal weather outlooks that will aid policymakers in decisions and activities related to climate change. Projections have been for winters to become increasingly mild, with less frequent snowfalls. However,
a b
c d
Temperature anomaly at 2 m (K)
NCEP midlatitude (slope = 0.0009, R2 = 0.0002) NMME midlatitude (slope = 0.0384, R2 = 0.7586)
NCEP Arctic (slope = 0.1282, R2 = 0.6585) NMME Arctic (slope = 0.0690, R2 = 0.7076) NCEP NH (slope = 0.0510, R2 = 0.6343) NMME NH (slope = 0.0394, R2 = 0.8145)
1990 1995 2000 2005 2010 2015 1990 1995 2000 2005 2010 2015
1990 1995 2000 2005 2010 2015 1990 1995 2000 2005 2010 2015
Year 4
2
0
–2
–4
4
2
0
–2
–4 4
2
0
–2
–4 4
2
0
–2
–4
Fig. 4 | Observed and simulated midlatitude winter temperature trends are diverging. a, Reanalysis and hindcasted/predicted NMME individual ensemble members for NH midlatitude continental 2-metre (above the surface) temperature anomalies. b, Same as a but reanalysis (blue) and NMME (red). c, Reanalysis (blue) and hindcasted/predicted NMME ensemble mean (red) NH midlatitude continental temperature anomalies. Also included is the linear trend line for each dataset. d, Reanalysis (black) and hindcasted/predicted NMME ensemble mean (green) NH temperature anomalies and reanalysis (blue) and hindcasted/predicted NMME ensemble mean (red) Arctic temperature anomalies and linear trends. All temperature anomalies are for December, January, February and March from 1988/89 through 2018/2019. Anomalies are calculated relative to climatology from reanalysis 1981–2010 and from NMME 1982–2010 winter mean respectively. Variance (R2) included for all trend lines. All trends except the NCEP NH midlatitude land regions are statistically significant at the >99% confidence level. There is a cold bias in the climatology of the NMME models extratropical atmosphere compared with the observations. In Supplementary Fig. 10, we show the NMME temperature anomalies relative to the NMME climatology.
NATURe CLIMATe CHANGe | www.nature.com/natureclimatechange
Review ARticle
NATuRe ClimATe ChANge
severe winter weather persists, and in some regions, heavy snow- falls have become more, not less, frequent74. Although a growing number of studies argue that AA has contributed to more frequent severe winter weather across the NH continents, these are coun- tered by others that argue differently—the influence of pan-Arctic warming is either insignificant or, alternatively, contributes to
milder midlatitude winters. The divide on the influence of Arctic change has contributed to the impression that this research topic is controversial and lacking consensus8,129–131. An alternative interpre- tation is that the wide range of results should be expected, owing to the varying approaches to studying the problem and the complexity and intermittency of Arctic/midlatitude connections80,132,133. Box 1 | Observational studies
Observational analyses support that AA, and in particular sea ice loss, can influence midlatitude winter weather through a stratospheric pathway. Climatology favours a strong polar vortex supported by cold air over the Arctic and milder air at lower latitudes. This temperature distribution forces low geopotential heights over the Arctic and higher heights in the midlatitudes (left panel of the figure). In recent decades, this climatologically favoured configuration of the polar vortex has become increas- ingly perturbed15,70,88,116. Although Arctic warming is strongest at the surface (see Fig. 1 in the text), it extends throughout the mid- troposphere. In addition, the sea ice loss and associated warming is not uniform across the Arctic, but rather regionally focused.
Concentration of Arctic warming in the Barents–Kara Seas dilates geopotential heights over northwestern Eurasia, leading to more frequent high-latitude Scandinavian/Ural blocking that is favourable for the excitation of vertically propagating energy associated with large-scale planetary waves9,67,69,88. The increased vertical propagation of energy is coupled with more frequent intrusions of warm air from lower latitudes, depositing heat in the polar stratosphere, which causes a second maximum of Arctic warming where the polar vortex normally resides. Warm- ing throughout the atmospheric column dilates the geopotential heights sufficiently to reverse the normal Equator–pole geo- potential height gradient, resulting in cold air previously trapped near the pole to be displaced to the midlatitudes. As air flows southward away from the North Pole towards the Equator, the air is deflected to the west by the Coriolis force, forming an east- erly wind around the North Pole. The redistribution of air masses that happens first in the stratosphere is then replicated through the troposphere to the surface. This completes the reversal of the NH circulation pattern with relatively warm temperatures and high geopotential heights over the Arctic and lower heights in the midlatitudes accompanied by more frequent cold air out- breaks to the midlatitudes (right panel).
How Arctic amplification influences midlatitude weather through the polar vortex, based on observational analysis.
Observational analysis
Cold
Cold
Cold Cold
Warm Warm
Warm Warm
L
Pre-Arctic amplification Warm Arctic/weak polar vortex Temperature anomaly (K)
–1.5 –1.0 –0.5 0.0 0.5 1.0 1.5
H
Box 2 | Modelling data
The large-scale hemispheric circulation is similar in model simu- lations to the observations during the pre-AA period, with cold air over the Arctic, milder air over the midlatitudes and subtrop- ics and the stratosphere dominated by a strong polar vortex with higher geopotential heights at lower latitudes (left panel in Box 1 figure). However, in the ensuing period of AA, the excess warm- ing generated in the Arctic due to sea ice loss and other mecha- nisms described above is not redistributed vertically in model simulations, but rather horizontally (Fig. 1 in the text) via advec- tion or conduction from the Arctic to lower latitudes11. Further- more, the CMIP5 and AMIP simulations either lack or have a relatively weak second maximum in heating in the polar strato- sphere during the AA era. The simulated AA atmospheric circu- lation is nearly unchanged from the pre-AA period other than a weakening of the geopotential height gradient from Equator to pole, resulting in no increase in cold air outbreaks from the Arctic to the midlatitudes. Instead, cold air outbreaks are moderated, contributing to further warming of the midlatitudes (left panel).
The simulated shallower Arctic heating either is insufficient in depth to force a disruption of the polar vortex or at most a polar vortex disruption of comparably weak magnitude in many model ling experiments. Therefore, any induced dynamical cooling, either due to a simulated weaker stratospheric polar vortex or a negative AO, is overwhelmed by amplified Arctic warming and the transport of the milder Arctic air southward136. Conceptual mechanisms are derived from archived ensembles coordinated among modelling centres.
Instead, most model simulations indicate that during AA, observed colder temperatures in the midlatitudes are due to natural/internal variability or a remote forcing other than AA. As an example, changes in tropical convection transports additional heat both into the Arctic137, resulting in amplified warming, and into the polar stratosphere, leading to a more highly disrupted polar vortex and displacement of cold air southwards to lower latitudes138 (right panel).
How Arctic amplification influences midlatitude weather through the polar vortex, based on numerical modelling experiments.
Model simulations
Cold
Warmest
Cold Cold
Warm Warm
Warm Warm
Arctic amplification Warm Arctic/weak polar vortex Temperature anomaly (K)
–1.5 –1.0 –0.5 0.0 0.5 1.0 1.5
H L
NATURe CLIMATe CHANGe | www.nature.com/natureclimatechange
Review ARticle NATuRe ClimATe ChANge
Here we have attempted to elucidate the complexity of the topic by surveying and synthesizing observational and modelling studies so far (see Supplementary Fig. 4). First, we highlight that AA is not limited to sea ice melt but rather has multiple causes, with consider- able spread among climate model projections. Although true con- sensus on the mechanisms of Arctic/midlatitude weather linkages is lacking, a more comprehensive assessment reveals a convergence of scientific evidence and ideas. Whereas early studies focused on the hemispheric response to sea ice anomalies, more recent studies highlight the importance of regional atmospheric response to local- ized sea ice anomalies; model and observational studies may share common ground demonstrating those linkages. However, we con- clude that most model and observational studies diverge on the hemispheric response to pan-Arctic sea ice anomalies and warming.
Overwhelmingly, observational studies argue that AA forces winter cooling across the midlatitude continents, whereas most modelling experiments do not. The spatial distribution of NH winter warm- ing rates in the model simulations closely aligns with expectations of AA—the warming increases with latitude, the tropics warm the least, the Arctic warms the most, and the midlatitudes fall some- where in between and close to the NH average. Therefore, the con- clusion of many modelling studies is that any observed midlatitude winter continental cooling trends in the twenty-first century are due to natural variability. In contrast, observed NH winter warming rates have been characterized by moderate warming in the tropics, amplified warming in the Arctic and almost no warming across the midlatitude continents. The conclusion of empirical studies is that the distribution of observed heating rates probably cannot be explained without including dynamical arguments related to AA.
Currently, observed and simulated NH midlatitude continen- tal temperature trends are diverging. If future midlatitude winters warm while converging towards simulated trends, then the cur- rent divergence is likely to have been a result of natural variability.
Alternatively, future modelling simulations may converge towards support of the observationally derived hypothesis that AA favours colder midlatitude winters. As discussed above, modelling stud- ies with regional sea ice melt confined to the Barents–Kara Seas and a well resolved stratosphere with interactive stratospheric chemistry do simulate a weakened polar vortex and cold mid- latitudes51,106,112,116,121 consistent with the observations. Precise representation of the stratosphere in models may help to resolve discrepancies between model and observational studies. A set of coordinated modelling studies is under way134 that is designed to better quantify the forced atmospheric response to sea ice loss113.
Although further research should elucidate the varying mecha- nisms of Arctic/midlatitude weather linkages, it remains a challenge to extricate cause-and-effect signals from the inherently chaotic climate system. The present lack of certainty may frustrate policy- makers and the general public, but science often advances slowly on issues with great complexity and large variability. Regardless, this review of the state of research on connections between a rapidly melting Arctic and severe winter weather is timely, as large popula- tion centres in North America and Eurasia continue to experience severe cold, snowstorms and weather whiplash. Ongoing research will provide progress towards consensus on this scientifically and societally important topic.
Online content
Any methods, additional references, Nature Research reporting sum- maries, source data, extended data, supplementary information, acknowledgements, peer review information; details of author con- tributions and competing interests; and statements of data and code availability are available at https://doi.org/10.1038/s41558-019-0662-y.
Received: 20 July 2018; Accepted: 15 November 2019;
Published: xx xx xxxx
References
1. Francis, J. A. & Vavrus, S. J. Evidence linking Arctic amplification to extreme weather in mid-latitudes. Geophys. Res. Lett. 39, https://doi.org/10.1029/
2012GL051000 (2012).
Influential early observational study arguing that Arctic amplification is contributing to more extreme weather in all seasons.
2. Cohen, J. et al. Arctic Change and Possible Influence on Mid-latitude Climate and Weather. US CLIVAR Report 2018-1, https://doi.org/10.5065/
D6TH8KGW (2018).
3. Stroeve, J. C. et al. Trends in Arctic sea ice extent from CMIP5, CMIP3 and observations. Geophys. Res. Lett. 39, https://doi.org/10.1029/2012GL052676 (2012).
4. Pithan, F. & Mauritsen, T. Arctic amplification dominated by temperature feedbacks in contemporary climate models. Nat. Geosci. 7, 181–184 (2014).
5. Döscher, R., Vihma, T. & Maksimovich, E. Recent advances in understanding the Arctic climate system state and change from a sea ice perspective: a review. Atmos. Chem. Phys. 14, 13571–13600 (2014).
6. Wendisch, M. et al. Understanding causes and effects of rapid warming in the Arctic. Eos 98, https://doi.org/10.1029/2017EO064803 (2017).
7. Vihma, T. Effects of Arctic sea ice decline on weather and climate: a review.
Surv. Geophys. 35, 1175–1214 (2014).
8. Overland, J. E. et al. The melting Arctic and mid-latitude weather patterns:
are they connected? J. Clim. 28, 7917–7932 (2015).
9. Cohen, J. et al. Recent Arctic amplification and extreme mid-latitude weather. Nat. Geosci. 7, 627–637 (2014).
10. Overland, J. E., Wood, K. R. & Wang, M. Warm Arctic–cold continents:
impacts of the newly open Arctic Sea. Polar Res. 30, 15787 (2011).
Observational study that identified warm Arctic/cold continental pattern associated with sea ice loss.
11. Cohen, J., Jones, J., Furtado, J. C. & Tziperman, E. Warm Arctic, cold continents: a common pattern related to Arctic sea ice melt, snow advance, and extreme winter weather. Oceanography 26, 150–160 (2013).
12. Kug, J.-S. et al. Two distinct influences of Arctic warming on cold winters over North America and East Asia. Nat. Geosci. 8, 759–762 (2015).
Showed clear link between warm temperatures in the Chukchi–East Siberian Seas and cold temperatures in North America east of the Rockies. Also supported previously shown link between warm temperatures in the Barents–Kara Seas and cold Siberia.
13. Sun, L., Perlwitz, J. & Hoerling, M. What caused the recent ‘Warm Arctic, Cold Continents’ trend pattern in winter temperatures? Geophys. Res. Lett.
43, 5345–5352 (2016).
14. Cohen, J. & Barlow, M. The NAO, the AO, and global warming: how closely related? J. Clim. 18, 4498–4513 (2005).
15. Cohen, J., Barlow, M. & Saito, K. Decadal fluctuations in planetary wave forcing modulate global warming in late boreal winter. J. Clim. 22, 4418–4426 (2009).
16. Wegmann, M., Orsolini, Y. J. & Zolina, O. Warm Arctic–cold Siberia:
comparing the recent and the early 20th century Arctic warmings. Environ.
Res. Lett. 13, https://doi.org/10.1088/1748-9326/aaa0b7 (2018).
17. Cohen, J., Furtado, J., Barlow, M., Alexeev, V. & Cherry, J. Arctic warming, increasing fall snow cover and widespread boreal winter cooling. Environ.
Res. Lett. 7, 014007 (2012).
Argued that Arctic amplification including melting sea ice and extensive snow cover was contributing to a negative Arctic Oscillation and cold continental temperature trends. Also demonstrated that model projected and observed winter temperature trends were diverging.
18. Coumou, D., Di Capua, G., Vavrus, S., Wang, L. & Wang, S. The influence of Arctic amplification on mid-latitude summer circulation. Nat. Commun.
9, 2959 (2018).
19. Alexeev, V. A. et al. Vertical structure of recent Arctic warming from observed data and reanalysis products. Climatic Change 111, 215–239 (2012).
20. Vihma, T. in Climate Extremes: Patterns and Mechanisms (eds Wang, S.-Y.
S. et al.) Ch. 2 (AGU Geophysical Monograph Series 226, 2017).
21. Boe, J., Hall, A. & Qu, X. Current GCMs’ unrealistic negative feedback in the Arctic. J. Clim. 22, 4682–4695 (2009).
22. Alexeev, V. A., Langen, P. L. & Bates, J. R. Polar amplification of surface warming on an aquaplanet in ‘ghost forcing’ experiments without sea ice feedbacks. Clim. Dyn. 24, 655–666 (2005).
23. Manabe, S. & Wetherald, R. T. The effects of doubling the CO2 concentration on the climate of a general circulation model. J. Atmos. Sci. 32, 3–15 (1975).
An early paper that showed Arctic or polar amplification due to local feed backs in model projections forced by anthropogenic greenhouse warming.
24. Stuecker, M. F. et al. Polar amplification dominated by local forcing and feedbacks. Nat. Clim. Change 8, 1076–1081 (2018).
25. Dai, A., Luo, D., Song, M. & Liu, J. Arctic amplification is caused by sea-ice loss under increasing CO2. Nat. Commun. 10, 121 (2019).
26. Rigor, I. G., Wallace, M. & Colony, R. Response of sea ice to the Arctic Oscillation. J. Clim. 15, 2648–2663 (2002).
NATURe CLIMATe CHANGe | www.nature.com/natureclimatechange
Review ARticle
NATuRe ClimATe ChANge
27. Zhang, X., Ikeda, M. & Walsh, J. E. Arctic sea-ice and freshwater changes driven by the atmospheric leading mode in a coupled sea ice–ocean model.
J. Clim. 16, 2159–2177 (2003).
28. Zhang, X., Sorteberg, A., Zhang, J., Gerdes, R. & Comiso, J. C. Recent radical shifts in atmospheric circulations and rapid changes in Arctic climate system. Geophys. Res. Lett. 35, L22701 (2008).
Identified radical spatial changes in the large-scale atmospheric circulation showing a contracted/weakened Icelandic low and a northwestward extended/strengthened Siberian high; linked the amplified Arctic warming/accelerated decrease in sea ice in the Barents–Kara seas to Eurasian cooling.
29. Zhang, X. et al. Enhanced poleward moisture transport and amplified northern high-latitude wetting trend. Nat. Clim. Change 3, 47–51 (2013).
30. Park, D.-S., Lee, S. & Feldstein, S. B. Attribution of the recent winter sea-ice decline over the Atlantic sector of the Arctic Ocean. J. Clim. 28, 4027–4033 (2015).
31. Gong, T., Feldstein, S. B. & Lee, S. The role of downward infrared radiation in the recent Arctic winter warming trend. J. Clim. 30, 4937–4949 (2017).
32. Laliberte, F. & Kushner, P. J. Midlatitude moisture contribution to recent Arctic tropospheric summertime variability. J. Clim. 27, 5693–5706 (2014).
33. Ding, Q. et al. Influence of high-latitude atmospheric circulation changes on summertime Arctic sea ice. Nat. Clim. Change 7, 289–295 (2017).
34. Perovich, D. K., Richter-Menge, J. A., Jones, K. F. & Light, B. Sunlight, water, and ice: extreme Arctic sea ice melt during the summer of 2007.
Geophys. Res. Lett. 35, https://doi.org/10.1029/2008gl034007 (2008).
35. Pistone, K., Eisenman, I. & Ramanathan, V. Observational determination of albedo decrease caused by vanishing Arctic sea ice. Proc. Natl Acad. Sci.
USA 111, 3322–3326 (2014).
36. Jeong, J.-H. et al. Intensified Arctic warming under greenhouse warming by vegetation–atmosphere–sea ice interaction. Environ. Res. Lett. 9, 094007 (2014).
37. Overland, J. E., Francis, J. A., Hanna, E. & Wang, M. The recent shift in early summer Arctic atmospheric circulation. Geophys. Res. Lett. 39, L19804 (2012).
38. Serreze, M. C. & Francis, J. A. The arctic amplification debate. Climatic Change 76, 241–264 (2006).
39. Screen, J. A. & Simmonds, I. The central role of diminishing sea ice in recent Arctic temperature amplification. Nature 464, 1334–1337 (2010).
40. Pithan, F. et al. Role of air-mass transformations in exchange between the Arctic and mid-latitudes. Nat. Geosci. 11, 805–812 (2018).
41. Boisvert, L. N., Wu, D. L. & Shie, C.-L. Increasing evaporation amounts seen in the Arctic between 2003 and 2013 from AIRS data. J. Geophys. Res.
120, 6865–6881 (2015).
42. Boisvert, L. N. & Stroeve, J. C. The Arctic is becoming warmer and wetter as revealed by the Atmospheric Infrared Sounder. Geophys. Res. Lett. 42, 4439–4446 (2015).
43. Taylor, P. C., Hegyi, B. M., Boeke, R. C. & Boisvert, L. N. On the increasing importance of air–sea exchanges in a thawing Arctic: a review. Atmos. 9, https://doi.org/10.3390/atmos9020041 (2018).
44. Winton, M. Amplified Arctic climate change: what does surface albedo feedback have to do with it? Geophys. Res. Lett. 33, L03701 (2006).
45. Wendisch, M. et al. The Arctic cloud puzzle: using ACLOUD/PASCAL multi-platform observations to unravel the role of clouds and aerosol particles in Arctic amplification. Bull. Am. Meteorol. Soc. 100, 841–871 (2019).
46. Kay, J. E. & L’Ecuyer, T. Observational constraints on Arctic ocean clouds and radiative fluxes during the early 21st century. J. Geophys. Res. Atmos.
118, 7219–7236 (2013).
47. Boeke, R. C. & Taylor, P. C. Seasonal energy exchanges in sea ice retreat regions contribute to the inter-model spread in projected Arctic warming.
Nat. Commun. 9, 5017 (2018).
48. Intrieri, J. M. et al. An annual cycle of Arctic surface cloud forcing at SHEBA. J. Geophys. Res. 107, https://doi.org/10.1029/2000JC000423 (2002).
49. Uttal, T. et al. Surface heat budget of the Arctic Ocean. Bull. Am. Meteorol.
Soc. 83, 255–275 (2002).
50. Francis, J. A., Hunter, E., Key, J. R. & Wang, X. Clues to variability in Arctic minimum sea ice extent. Geophys. Res. Lett. 32, https://doi.org/
10.1029/2005GL024376 (2005).
51. Screen, J. A. Simulated atmospheric response to regional and Pan-Arctic sea-ice loss. J. Clim. 30, https://doi.org/10.1175/JCLI-D-16-0197.1 (2017).
Observational and modelling showing the atmospheric to regional and pan-Arctic response to Arctic warming/sea ice loss.
52. Liu, Y. & Key, J. R. Less winter cloud aids summer 2013 Arctic sea ice return from 2012 minimum. Environ. Res. Lett. 9, https://doi.org/
10.1088/1748-9326/9/4/044002 (2014).
53. Lee, S. A theory for polar amplification from a general circulation perspective. Asia-Pac. J. Atmos. Sci. 50, 31–43 (2014).
54. Park, H.-S., Lee, S., Kosaka, Y., Son, S.-W. & Kim, S.-W. The impact of Arctic winter infrared radiation on early summer sea ice. J. Clim. 28, 6281–6296 (2015).
55. Hegyi, B. M. & Taylor, P. C. The regional influence of the Arctic Oscillation and Arctic Dipole on the wintertime Arctic surface radiation budget and sea ice growth. Geophys. Res. Lett. 44, 4341–4350 (2017).
56. Woods, C. & Caballero, R. The role of moist intrusions in winter Arctic warming and sea ice decline. J. Clim. 29, 4473–4485 (2016).
57. Kim, B.-M. et al. Major cause of unprecedented Arctic warming in January 2016: Critical role of an Atlantic windstorm. Sci. Rep. 7, 40051 (2017).
58. Hegyi, B. M. & Taylor, P. C. The unprecedented 2016–17 Arctic sea ice growth season: the crucial role of atmospheric rivers and longwave fluxes.
Geophys. Res. Lett. 45, 5204–5212 (2018).
59. Messori, G., Woods, C. & Caballero, R. On the drivers of wintertime temperature extremes in the High Arctic. J. Clim. 31, 1597–1618 (2018).
60. Holton, J. R. An Introduction to Dynamic Meteorology 2nd edn (Academic, 1979).
61. Barnes, E. A. Revisiting the evidence linking Arctic amplification to extreme weather in midlatitudes. Geophys. Res. Lett. 40, 4734–4739 (2013).
Early paper that was sceptical of reported Arctic–mid-latitude linkages and found no evidence that Arctic amplification was contributing to increased blocking or extreme weather.
62. Screen, J. A. & Simmonds, I. Exploring links between Arctic amplification and mid‐latitude weather. Geophys. Res. Lett. 40, 959–964 (2013).
63. Rex, D. F. Blocking action in the middle troposphere and its effect upon regional climate. I. An aerological study of blocking action. Tellus 2, 196–211 (1950).
64. Rex, D. P. Blocking action in the middle troposphere and its effect upon regional climate. II. The climatology of blocking actions. Tellus 2, 275–301 (1950).
65. Quiroz, R. S. Tropospheric–stratospheric interaction in the major warming event of January–February 1979. Geophys. Res. Lett. 6, 645–648 (1979).
66. Quiroz, R. S. The association of stratospheric warmings with tropospheric blocking. J. Geophys. Res. 91, 5277–5285 (1986).
67. Martius, O., Polvani, L. M. & Davies, H. C. Blocking precursors to stratospheric sudden warming events. Geophys. Res. Lett. 36, L14806 (2009).
68. Baldwin, M. P. & Dunkerton, T. J. Stratospheric harbingers of anomalous weather regimes. Science 294, 581–584 (2001).
69. Kim, B.-M. et al. Weakening of the stratospheric polar vortex by Arctic sea-ice loss. Nat. Commun. 5, https://doi.org/10.1038/ncomms5646 (2014).
Early paper that established stratospheric pathway for atmospheric response to sea ice loss in the Barents–Kara sea in both observations and modelling experiments.
70. Kretschmer, M. et al. More frequent weak stratospheric polar vortex states linked to mid-latitude cold extremes. Bull. Am. Meteorol. Soc. 99, 49–60 (2018).
71. Honda, M., Inoue, J. & Yamane, S. Influence of low Arctic sea-ice minima on anomalously cold Eurasian winters. Geophys. Res. Lett. 36, https://doi.org/10.1029/2008GL037079 (2009).
Early paper showing through model experiments that sea ice loss in the Barents–Kara Seas can force in cold Siberian temperatures by exciting a Rossby wave train.
72. Sillmann, J., Croci-Maspoli, M., Kallache, M. & Katz, R. W. Extreme cold winter temperatures in Europe under the influence of North Atlantic atmospheric blocking. J. Clim. 24, 5899–5913 (2011).
73. Zhang, X., Lu, C. & Guan, Z. Weakened cyclones, intensified anticyclones, and the recent extreme cold winter weather events in Eurasia. Environ. Res.
Lett. 7, 044044 (2012).
74. Cohen, J., Pfeiffer, K. & Francis, J. Warm Arctic episodes linked with increased frequency of extreme winter weather in the United States.
Nat. Commun. 9, 869 (2018).
75. Johnson, N. C., Xie, S.-P., Kosaka, Y. & Li, X. Increasing occurrence of cold and warm extremes during the recent global warming slowdown.
Nat. Commun. 9, 1724 (2018).
76. Hanna, E. et al. Greenland Blocking Index daily series 1851-2015: analysis of changes in extremes and links with North Atlantic and UK climate variability and change. Int. J. Climatol. 38, 3546–3564 (2018).
77. Lee, S. H., Charlton-Perez, A. J., Furtado, J. C. & Woolnough, S. J. Abrupt stratospheric vortex weakening associated with North Atlantic anticyclonic wave breaking. J. Geophys. Res. 124, https://doi.org/10.1029/2019JD030940 (2019).
78. Overland, J. E. et al. Nonlinear response of mid-latitude weather to the changing Arctic. Nat. Clim. Change 6, 992–999 (2016).
79. Shepherd, T. G. Effects of Arctic warming. Science 353, 989–990 (2016).
80. Overland, J. E. & Wang, M. Resolving future Arctic/Midlatitude weather connections. Earth’s Future 6, 1146–1152 (2018).
81. Screen, J. A. & Francis, J. A. Contribution of sea-ice loss to Arctic amplifi- cation is regulated by Pacific Ocean decadal variability. Nat. Clim. Change 6, 856–860 (2016).
82. Osborn, T. J., Jones, P. D. & Joshi, M. Recent United Kingdom and global temperature variations. Weather 72, 323–329 (2017).
NATURe CLIMATe CHANGe | www.nature.com/natureclimatechange