Contents lists available atScienceDirect
Marine Geology
journal homepage:www.elsevier.com/locate/margo
Discovery of a giant cold-water coral mound province along the northern Argentine margin and its link to the regional Contourite Depositional System and oceanographic setting
L. Steinmann
a,⁎, M. Baques
b,c, S. Wenau
a, T. Schwenk
a, V. Spiess
a, A.R. Piola
c, G. Bozzano
c, R. Violante
c, S. Kasten
a,d,eaFaculty of Geosciences, University of Bremen, Bremen, Germany
bAcoustic Propagation Department, Argentinian Navy Research Office and UNIDEF (National Council of Scientific and Technical Research - Ministry of Defense), Buenos Aires, Argentina.
cArgentine Hydrographic Service, Department of Oceanography, Buenos Aires, Argentina
dAlfred Wegener Institute Helmholtz Centre for Polar and Marine Research, Bremerhaven, Germany
eMARUM–Center for Marine Environmental Sciences, University of Bremen, Germany
A R T I C L E I N F O
Keywords:
Cold-water coral mounds Contourite Depositional System Hydroacoustic dataset Bottom currents
Antarctic Intermediate Water Upper Circumpolar Deep Water
A B S T R A C T
In the southern oceans, only a few cold-water coral mound sites have so far been reported compared to the extensively surveyed North Atlantic. Here, we document for thefirst time the widespread occurrence of exposed and buried coral mounds at the northern Argentine margin namedNorthern Argentine Mound Province(NAMP).
The integration of multibeam bathymetry, sediment echosounder, Acoustic Doppler Current Profiler (ADCP), and CTD data allowed the characterisation of its morphosedimentary, stratigraphic, and hydrodynamic setting.
The NAMP, covering at least 2000 km2, represents the largest coral mound province in terms of areal extent reported so far and a major site in the southern oceans. The coral mound distribution is directly linked to morphosedimentary features of the regional Contourite Depositional System (CDS) influenced by the Antarctic Intermediate Water (AAIW), the Upper Circumpolar Deep Water (UCDW), and their interface, forming a complex bottom-current-controlled environment here termedCoral-Contourite System. Coral mounds are most abundant in the lower AAIW between 900 and 1050 m, just above the Ewing Terrace Moat, which has been shaped by high- velocity currents associated with the AAIW-UCDW boundary. This clustering appears to be the result of an increased concentration of suspended sediment and food particles, transported along the AAIW-UCDW density gradient and delivered upward by turbulent hydrodynamic processes, which are enhanced by the irregular moat topography. Within the Ewing Terrace Moat, coral mounds are restricted to topographic obstacles, modifying the otherwise highly erosive, destructive hydrodynamic regime and thereby locally creating favourable conditions for coral growth. The low-velocity currents of the UCDW, currently influencing the Ewing Terrace, promote extensive contourite deposition, which has led to a progressive demise and burial of pre-existing mounds. The presence of these buried mounds suggests past mound aggradation 100 to 150 m deeper likely due to a downward shift of the AAIW during glacials as a consequence of sea-level lowering. Overall, the mound for- mation in the NAMP seems to be mainly controlled by the availability of suspended particles, in combination with a sufficient bottom-current strength, keeping material in suspension while preventing destructive erosion and excessive sedimentation.
Our study highlights (1) the importance of high-energy processes at water-mass boundaries for the delivery of sediment and food particles to corals, (2) the role of the AAIW as a crucial water mass for coral mound de- velopment, (3) the variability of mounds in response to glacial-interglacial cycles, and (4) the potential of CDSs in general and the Argentine margin in particular as hotspots for coral mounds and, thus, ideal site for future studies.
https://doi.org/10.1016/j.margeo.2020.106223
Received 27 September 2019; Received in revised form 29 April 2020; Accepted 1 May 2020
⁎Corresponding author.
E-mail address:lena.steinmann@uni-bremen.de(L. Steinmann).
Marine Geology 427 (2020) 106223
Available online 11 May 2020
0025-3227/ © 2020 Elsevier B.V. All rights reserved.
T
1. Introduction
Cold-water corals (CWCs) create unique, yet very vulnerable deep- sea biodiversity hotspots present in all of the world’s oceans (Henry and Roberts, 2007; Roberts and Cairns, 2014). On geological timescales, scleractinian CWCs can form remarkable seabed structures–known as CWC mounds (henceforth referred to as coral mounds)–by baffling and entrapping suspended sediment within their framework (De Mol et al., 2002;Kenyon et al., 2003;van Weering et al., 2003;Huvenne et al., 2009a;Foubert et al., 2011). These features vary in height from a few
meters to more than 300 m and often cluster in provinces covering several tens of square kilometres (De Mol et al., 2002;Freiwald, 2002;
Mienis et al., 2006;Hebbeln et al., 2014). Due to their rapid growth and longevity, coral mounds represent valuable high-resolution records of past climate and oceanographic changes (e.g. Dorschel et al., 2005;
Rüggeberg et al., 2007;Frank et al., 2009;Fink et al., 2012;Thierens et al., 2013). While extensive seafloor-mapping activities since the 90s have documented the widespread occurrence of coral mounds in the North Atlantic (e.g.Henriet et al., 2014;Hebbeln and Samankassou, 2015;Wienberg and Titschack, 2017), only few coral mound sites have Fig. 1.Overview map of the oceanographic and morphological setting at the northern Argentine margin. (A) Illustration of the bottom water-mass distribution with the Antarctic Bottom Water (AABW), Lower Circumpolar Deep Water (LCDW), Upper Circumpolar Deep Water (UCDW), Antarctic Intermediate Water (AAIW), North Atlantic Deep Water (NADW), and Brazil Current (BC) as adapted fromPreu et al. (2013). The BC conveys the Tropical Water and South Atlantic Central Water (SACW), while the Malvinas Current transport sub-Antarctic waters with primary contributions of AAIW and UCDW. Our working area (black square,Fig. 2) is located in the influence range of the AAIW and UCDW. The grey dots indicate the stations used for the calculation of the (B) salinity (Zweng et al., 2013) and (C) oxygen (Garcia et al., 2014) transects with Ocean Data View (Schlitzer, 2018).
so far been reported in the less explored South Atlantic, e.g. offshore SW Africa (Le Guilloux et al., 2009;Hanz et al., 2019;Tamborrino et al., 2019), Uruguay (Carranza et al., 2012), Brazil (Viana et al., 1998;
Sumida et al., 2004), and southern Argentina (Muñoz et al., 2012).
Besides physico-chemical water-mass properties such as tempera- ture, salinity, or oxygen concentration, a key environmental parameter influencing the growth of CWCs and subsequent mound formation is the bottom hydrodynamic regime (De Mol et al., 2002;Kenyon et al., 2003;
Wheeler et al., 2005;Dorschel et al., 2007;Mienis et al., 2007). Vig- orous currents may (1) create erosive surfaces representing ideal sub- strate for CWC settlement (De Mol et al., 2002;Van Rooij et al., 2003;
Huvenne et al., 2009b), (2) deliver larvae for initial colonization (De Mol et al., 2005;Dullo et al., 2008), (3) supply food particles allowing a sustained CWC growth (Frederiksen et al., 1992; Mienis et al., 2007;
Raddatz et al., 2014), and (4) provide suspended sediment required for mound aggradation (Dorschel et al., 2007;Titschack et al., 2015). To- pographic features such as seamounts, shelf edges, or canyons, asso- ciated with a localflow acceleration or turbulence, represent suitable sites for coral mound aggradation through increased food and sediment supply (Freiwald, 2002;Dorschel et al., 2007;Davies et al., 2009). Vice versa, high-relief coral mounds themselves may locally amplify the adjacent bottom currents, thereby creating turbulence and generating a self-sustained setting (Cyr et al., 2016;Hebbeln et al., 2016). However, other studies have also shown that a very strong current regime can become destructive leading to mound erosion or non-aggradation (Dorschel et al., 2005;Frank et al., 2009), whereas weak currents fa- vouring sedimentation may lead to a burial and coral demise (Huvenne et al., 2007;Rüggeberg et al., 2007;Brooke et al., 2009;Foubert et al., 2011;Correa et al., 2012;Lo Iacono et al., 2014).
On a larger scale, a dynamic bottom-current regime significantly affects the morphology and sediment distribution along continental margins, generating large Contourite Depositional Systems (CDSs), comprising both depositional and erosive features (Hernández-Molina et al., 2008;Rebesco et al., 2014). The common dependency on a dy- namic oceanographic setting results in a widespread co-existence of coral mounds and contourites as found in the North Atlantic (Hebbeln et al., 2016). In fact, coral mounds can modify the local hydrodynamic regime resulting in contourite deposition and/or erosion in their im- mediate surroundings (Van Rooij et al., 2003; Foubert et al., 2011;
Hebbeln et al., 2016).
Although research on CWCs and associated mounds has grown ra- pidly in the past decades, our understanding of these vulnerable deep- sea ecosystems is still incomplete due to geographic biases with focus on the North Atlantic. Based on an echosounder dataset, this study provides a first assessment of a newly discovered giant coral mound province and its relation to the adjacent CDS and oceanographic set- ting, thereby improving our knowledge about coral mounds in the southern hemisphere. Our main objectives are to (1) describe the dis- tribution and morphological types of the coral mounds, (2) establish a detailed understanding of the depositional and erosive bedforms of the CDS as well as their relation to bottom currents, (3) examine the in- fluence of the large-scale morphosedimentary setting and hydro- dynamic regime on the distribution of coral mounds, and (4) investigate the temporal and spatial variability of the coral mound.
1.1. Regional setting 1.1.1. Oceanography
The northern Argentine margin constitutes one of the most en- ergetic regions in the world’s oceans (Chelton et al., 1990) caused by the convergence of different water masses formed in remote areas of the world oceans (i.e., the North Atlantic, South Pacific, and Antarctic re- gions) (Fig. 1) (Reid, 1989;Stramma and England, 1999). Near 39°S, the southward-flowing Brazil Current (BC), conveying Tropical Water and South Atlantic Central Water (SACW), collides with the northward- flowing Malvinas Current, which transports sub-Antarctic waters,
thereby creating the Brazil-Malvinas Confluence (BMC; Gordon and Greengrove, 1986). The intermediate and deep circulation (> 500 m water depth) is governed by the complex interaction of the southward- flowing North Atlantic Deep Water (NADW) with Antarctic water masses including the Antarctic Intermediate Water (AAIW, ~500 – 1000 m), the Circumpolar Deep Water (CDW, ~1000–3500 m), and the Antarctic Bottom Water (AABW, > 3500 m) (Fig. 1) (Reid Jr. and Patzert, 1977;Stramma and England, 1999). The NADW penetrates into the CDW, thereby vertically dividing it into the Upper and Lower CDW (UCDW and LCDW, respectively) (Reid Jr. and Patzert, 1977;Piola and Matano, 2001;Arhan et al., 2003). South of the BMC, the AAIW and CDWflow northward as part of the Malvinas Current, while north of the confluence they participate in the basin-scale anticyclonic gyre circu- lation and thereforeflow southward along the upper slope and under- neath the Brazil Current. Recent studies show that AAIW, UCDW, and NADW participate in a strong northward recirculation located offshore of the southwardflowing limb (Valla et al., 2018). The analysis of near- bottom salinity and dissolved oxygen distributions has suggested northward intrusions of AAIW along the upper slope and beyond the BMC reaching ~31°S (Preu et al., 2013). Property distributions from repeated hydrographic observations collected at 34.5°S (e.g., north of the BMC,Valla et al., 2018) suggest that the northwardflow of AAIW north of the BMC may be sporadic or associated with eddies.
Our study area is located in the influence range of the AAIW (~500 –1000 m) and UCDW (1000–2000 m) (Hernández-Molina et al., 2009, 2010). The AAIW is characterized by a high dissolved oxygen content (> 5.5 ml l-1,Fig. 1C), a distinct salinity minimum (< 34.3,Fig. 1B) (Reid Jr. and Patzert, 1977;Piola and Matano, 2001), and high tur- bidity suggesting the presence of an intermediate nepheloid layer fed by erosive processes (Voigt et al., 2013). In contrast, the UCDW is oxygen- poor (< 4.5 ml l-1,Fig. 1C) and salinity-rich (> 34.4,Fig. 1B) (Reid Jr.
and Patzert, 1977; Piola and Matano, 2001) with low turbidity in- dicating minor amounts of suspended material and, thus, a lower transport capacity (Voigt et al., 2013).
1.1.2. Geological and morphological context
The northern Argentine margin is part of the passive-volcanic rifted continental margin of South America ranging from southern Brazil to northern Patagonia (Franke et al., 2007). It is characterized by highly dynamic depositional conditions due to a complex interaction of alongslope and downslope processes (e.g., Hensen et al., 2003;
Riedinger et al., 2005, 2014, 2017;Henkel et al., 2011, 2012;Krastel et al., 2011, 2013;Preu et al., 2012, 2013; Voigt et al., 2013, 2016;
Warratz et al., 2017, 2019). The tectono-volcanic crust is covered by a thick tectonically undisturbed sedimentary succession of Cretaceous to Cenozoic age (Hinz et al., 1999a, 1999b;Franke et al., 2007). Since the Eocene-Oligocene boundary, potentially related to the opening of the Drake Passage, the morphology of the Argentine margin has mainly been controlled by the long-term action of Antarctic-sourced water masses forming a large-scale CDS (Hinz et al., 1999a, 1999b;Franke et al., 2007;Hernández-Molina et al., 2009, 2010;Violante et al., 2010;
Gruetzner et al., 2012, 2016;Preu et al., 2012). During that time, iso- static and tectonic processes have only had a minor influence on the physiography of the northern Argentine margin (Hinz et al., 1999a, 1999b;Violante et al., 2014;Gruetzner et al., 2016).
Major morphosedimentary features of the CDS encompassing the Argentine and Uruguayan margins are several contourite terraces often in association with alongslope moats or channels and separated from each other by steep erosive surfaces (e.g.,Hernández-Molina et al., 2009). The northern Argentine margin exhibits three erosional con- tourite terraces namely the La Plata (~400-500 m water depth), the Ewing (~1100-1400 m water depth), and the Necochea (~3500 m water depth) terraces, featuring contourite drifts at their seaward side (Urien and Ewing, 1974; Hernández-Molina et al., 2009; Preu et al., 2013). The La Plata Terrace is separated from the Ewing Terrace by a steeper mid-slope erosive surface. The Ewing Terrace is associated with
an alongslope contourite channel at its landward side. The formation of the La Plata and Ewing terraces was attributed to turbulent current patterns and internal waves occurring at the BC-AAIW and the AAIW- UCDW transition zone since the Middle-to-Late Miocene due to the development of stronger currents after the Mid-Miocene climatic op- timum (Hernández-Molina et al., 2009;Violante et al., 2010;Preu et al., 2012).
The CDS is incised by several submarine canyons representing major pathway for downslope transport and interacting with alongslope se- dimentary processes (Hernández-Molina et al., 2009;Voigt et al., 2013;
Warratz et al., 2019). In our working area, the Mar del Plata Canyon, originating on the Ewing Terrace in 1000 m water depth, acts as main
downslope sediment transport conduit (Fig. 2) (Krastel et al., 2011;
Preu et al., 2013;Voigt et al., 2013;Warratz et al., 2019). However, additional evidence for mass-transport deposits outside of the canyon such as the presence of headwalls and an associated chaotic facies with a hummocky surface as identified offshore Uruguay are only found downslope of the Ewing Terrace at the next deeper terrace (Henkel et al., 2011, 2012;Krastel et al., 2011;Preu et al., 2012, 2013).
1.1.3. Cold-water corals
CWCs exist in all world’s oceans down to water depths of more than 3000 m (e.g.,Zibrowius, 1980), while coral mounds have mainly been identified in the North Atlantic, where they appear to be limited to Fig. 2.Bathymetric Overview map of the working area with GEBCO grid in grey scale and the SO260 bathymetry grid (25x25 m) in rainbow scale (seeFig. 1for location). Major morphological features including the Ewing Terrace Moat, the Erosive Middle Slope, and the Ewing Terrace are indicated. Yellow stars show the location of CTD stations. The contour line spacing is 50 m. Grey rectangles correspond to ACDP measurements for the transect inFig. 9.
intermediate water depths between 50 and ~1000 m (Roberts et al., 2009;Hebbeln and Samankassou, 2015). Along the northern Argentine margin, coral colonies were spotted for the first time at 1400 water depth at 41°30’S (Ewing and Lonardi, 1971). More recently, fossil as- semblages of the scleractinian coralBathelia candidawere reported from sediment cores obtained from a local mound at 1300 and 1208 m water depth near the head of the Mar del Plata Canyon (Bozzano et al., 2011).
Their development was assumed to be controlled by the presence of hard substrates necessary for initial settlement and the high-energy interface between the AAIW and UCDW, delivering larvae and pro- viding nutrients (Laprida et al., 2014). Further south along the Pata- gonian margin, widespread CWC colonies with B. candida as most abundant scleractinian species and Solenosmilia variabilis in minor quantities were found on coral mounds in association with contourite deposits between 300 and 1400 m water depth (Muñoz et al., 2012).
Their distribution was inferred to be governed by the Falkland/Mal- vinas Current, concentrating the food supply at the reef site (Muñoz et al., 2012). Along the Uruguayan margin, coral mounds formed by the scleractinianLophelia pertusawere identified at relatively shallow water depth between 167 and 326 m dominated by the SACW and AAIW (Carranza et al., 2012). This site represents the southernmost Atlantic record ofL. pertusa(Davies and Guinotte, 2011). Additionally, a 40-km- long coral moundfield was documented in the upperflow of the AAIW between 570 and 850 m water depth along the Brazil margin (Viana et al., 1998;Sumida et al., 2004). The importance of the AAIW and its boundaries with other water masses for the proliferation of CWCs was also described for CWC settings in the North Atlantic (Van Rooij et al., 2011;Matos et al., 2017).
2. Methods
This study is based on an echosounder dataset acquired along the northern Argentine margin duringRV SONNEcruise SO260 in January/
February 2018 (Kasten et al., 2019;Figs. 1, 2). The devices used include a parametric sediment echosounder (Atlas PARASOUND P70), a bathymetric multibeam echosounder (Kongsberg Simrad EM122), and an Acoustic Doppler Current Profiler (Ocean Surveyor Teledyne RDI ADCP). Additionally, we show CTD data for water-mass identification.
2.1. PARASOUND
The PARASOUND system uses the non-linear parametric effect, which leads to the generation of the difference and sum of two high- frequency primary signals that are emitted into the water at very high energy levels (Grant and Schreiber, 1990). During RV SONNE cruise SO260, the primary frequencies were set to 18 and 22 kHz producing a secondary (parametric) frequency of 4 kHz, which leads to a vertical resolution of a few decimetres. As the secondary sound wave travels in the narrow beam (4°) of the primary sound waves, a high lateral re- solution of ~7% of the water depth can be achieved. The penetration of the signal into the sub-seafloor varies with the character of the sedi- ments, however, in the study area a typical signal penetration of ~75 m is observed (Figs. 3, 4, 5). Noise bursts were removed from the data by applying a despike algorithm usingVISTA Desktop Seismic Data Proces- sing Software(Schlumberger).The Kingdom Software(IHS) was used to calculate the data envelope in order to enhance reflector coherency for visualization and interpretation. Conversions from two-way traveltime (TWT) to depth were carried out using a constant sound velocity of 1500 m/s.
2.2. Multibeam
The Kongsberg EM122 system operates at 12 kHz with beam opening angles of 0.5° along-track and 1° across-track. For each ping, 432 beams were recorded with a swath angle of up to 140°. This con- figuration leads to an along-track resolution from 9 m for the inner
beam to 26 m for the outermost beam for a water depth of 1000 meters.
Due to the equidistant beam spacing and the high density signal pro- cessing, the across-track resolution is 25 m constantly if the swath angle is set to 140°, but higher when the swath angle is decreased (also cal- culated for 1000 m water depth). Water sound velocity profiles were acquired during the survey with CTD probes as well as XSVs (eXpendable Sound Velocimeter). Post-processing including automatic and interactive editing as well as gridding was carried out using the programs under GNU general public license MULTIBEAM SYSTEMS (MB Systems). The resulting grids have cell sizes of 25x25 m (Figs.1, 2, 3A,6) and 10x10 m (Fig. 3B-D). Areal-extent estimates are based on convex hull calculations. Data analysis and visualization was done with QGIS (QGIS Geographic Information System. Open Source Geospatial Foundation Project.).
2.3. ADCP
The hull-mounted ADCP measures Doppler shift at 38 kHz, pro- viding real-time current velocity profiles in the water column con- tinuously during the entire cruise. The ADCP was operated in a long- range narrowband mode configuration; including 16 m bin depth, pulse length and blank after transmit. The maximum range with this con- figuration was < 1200 m, while thefirst bin was centred at 38.3 m. The presented dataset is theLong Time Average(LTA), which is the result of time averaging the current velocity data into ensembles using a time window of 600 seconds, including corrections for ship motion. In this dataset, the maximum distance between ADCP ensembles is 460 m.
During post-processing, current velocity data and bin depth were cor- rected with water sound velocities obtained from CTD and XSV profiles.
Computer programs in Matlab were used tofilter low quality data. To estimate the possible impact of tidal currents on the ADCP observations, the TPXO global tidal model (Egbert and Erofeeva, 2002) was used to compute the barotropic tides during Jan-Feb/2018 at a point located in the central part of the working area. The tidal current estimations were relatively small (< 3 cm s-1) compared to the ADCP observations and have thus been disregarded.
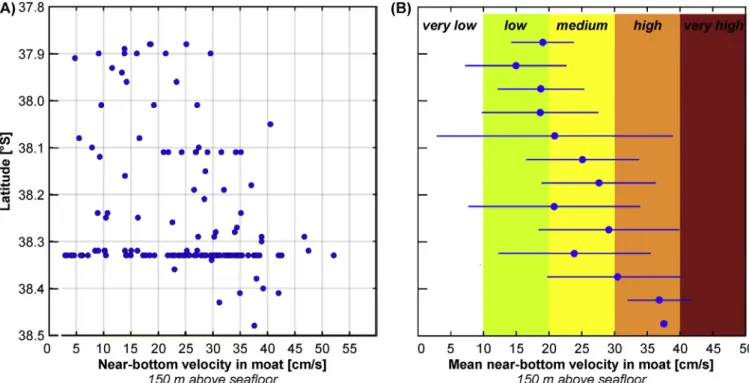
The reference axes were rotated 30.5° clockwise from the true north based on the orientation of the moat to examine the along-moat (i.e., alongslope) current regime. The current velocity estimations in the lower 15% of the water column are unreliable for interpretation due to contamination by the seafloor reflections; therefore, they were removed from the analysis. However, to approximate the bottom-current current regime, the time-averaged along-moat current velocities at 150 m above the seafloor (also referred to as near-bottom) in a 0.1° latitude x 0.1° longitude grid (Fig. 7) were examined. For a more detailed over- view of the latitudinal variations of the near-bottom currents in the moat, flow velocities 150 m above the seafloor within the moat for smaller intervals of 0.05° of latitude (Fig. 8) were computed. The se- lection of the level 150 m above the seafloor to represent the near- bottomflow is based on the need to include enough data to properly describe the current velocity distribution while avoiding possible con- tamination from bottom reflections. This seems a reasonable approx- imation since the vertical shear of the alongslope current velocities is relatively low between 300 and 150 m from the bottom (Fig. 9) sug- gesting that no significant current velocity changes occur in the 150 m layer above the seafloor.
2.4. CTD
A Sea-Bird SBE 9.11 CTD profiler was deployed at 9 stations during the RV SONNE cruise SO260 but only 3 of them were acquired in the study area (Fig. 2) (Baumann et al., 2019). The CTD profiler was equipped with sensors for temperature, conductivity, pressure (PSA 916), oxygen (SBE 43), chlorophyll concentration (Wet Labs ECO-AFL/
FL), turbidity (Wet Labs ECO-NTU) and altimeter. During stations data were collected each second and averaged later by the CTD software
(caption on next page)
over a depth interval of 1 m. Salinity is expressed in Practical Salinity Units (PSU) throughout the manuscript. The downcast data were used to identify water masses (Fig. 10). Unfortunately, turbidity data were not available due to calibration issues.
3. Results
This study is based on an integrated analysis of bathymetric data, covering a total area of ~6400 km2between 550 and 1500 m water depth (Figs. 2, 3), and ~2400 km of PARASOUND data of which we show four representative profiles (Figs. 3, 4, 5). Additionally, we ana- lysed flow velocities and water-mass properties based on ADCP data (Figs. 7, 8, 9) and 3 CTD stations (Fig. 10), respectively. The strati- graphic marker H1, representing the end of the Late Pliocene, was derived from previous seismostratigraphic studies (Violante et al., 2010;Preu et al., 2012).
3.1. Erosive and depositional features
The most prominent morphological feature of the working area is a SW-NE trending slope-parallel moat located at the landward side of the Ewing Terrace and, thus, here termedEwing Terrace Moat(Fig. 2). It starts in the SW at 38.7°S as shallow, narrow, and fragmented moat, coincident with a deepening of the Ewing Terrace (Fig. 2). The moat runs approximately along the 1000 m contour line with a slight dee- pening to ~1100 m in the NE, where it terminates in the Mar del Plata Canyon (Fig. 2). The incision depth of the moat with respect to the surrounding seafloor increases towards the NE from < 100 m to ~250 m (Fig. 6). Similarly, its width increases from < 1 km to ~7 km (Fig. 6).
The moat is distinctly asymmetric with a steep and complex upslope flank showing pronounced erosional truncation and a gentle and smooth downslope flank exhibiting continuous reflections with a sig- moidal, upslope prograding reflection pattern (Fig. 4). The asymmetry and upslope complexity increase towards the NE due to the presence of local topographic highs and depressions (Fig. 3) as well as internal terraces showing pronounced erosional truncation (Fig. 5) and bounded by steep (> 15°) seafloor scarps (Fig. 6).
Landward of the moat, the middle slope located between ~600 to
~1000 m water depth shows a step-like morphology with a sequence of almostflat and at places protruding terraces separated by steep seafloor scarps (Fig. 3A) associated with well-defined reflection truncation, re- presenting a widespread erosional surface labelledMid-Slope Erosional Surface(MES) (Figs. 4A-B,5). The terraces correspond to outcropping high-amplitude reflections, bounding concordant packages of parallel, low-amplitude reflections (Figs. 3G,4B). Due to its extensive erosional character associated with the widespread MES, the middle slope is here termed Erosive Middle Slope(Fig. 2). Two downslope channels incise into the Erosive Middle Slope and terminate in the moat (Fig. 2).
The Ewing Terrace, located seaward of the moat, shows an overall smooth seafloor characterized by a shoal to water depth of less than 1000 m in the SW (Fig. 2). The uppermost subsurface shows con- tinuous, high-amplitude reflections of sigmoidal or oblique reflection pattern with a mean (maximum) thickness of 5.5 m (27 m) (Fig. 4D).
Locally, we observed prominent lens-shaped bodies (Fig. 4D). In the subsurface, a widespread erosional surface (unconformity U1), re- presented by a high-amplitude reflection, truncates the underlying
parallel, continuous reflections (Fig. 4D). Below U1, another deeper erosional surface (unconformity U2) was identified (Fig. 4D).
3.2. Exposed and buried mounds
Throughout the study area, large quantities of mounds character- ized by an (almost) acoustically transparent facies associated with dif- fraction hyperbolas and rooting on erosional surfaces were observed (Figs. 3, 4). They were identified as elevated features above the seafloor (i.e., exposed mounds) and in the subsurface buried by continuous re- flections (i.e.,buried mounds) (Fig. 4).
The exposed mounds occur in a broad water depth range from ~580 to 1340 m reaching maximum water depths within the NE portion of the moat, covering an area of ~1500 km2(Figs. 3, 11). Based on their geometry and dimensions, we were able to distinguish three different mound types.Mound clusterscomprise numerous coalescing, low-relief (< 10 m height above the base reflection) and narrow mounds char- acterized by strong diffraction hyperbolas masking the true shape of the mounds (Fig. 3G,4B). They occur mainly along the Erosive Middle Slope in a water depth range between ~580 and 1100 m (Fig. 3C), where they root on the MES (Figs. 3G,4B). In contrast, within the moat, we identified localized high-relief mound ridges and isolated circular mounds representing mound chains (Fig. 3D) and isolated mounds (Figs. 3B+E, 4C), respectively. Both types occur along topographically elevated areas such as bathymetric highs or terrace scarps of the moat’s complex upslopeflank and reach heights of up to 60 m above their base reflections. The slope-parallel mound chains extend over several hun- dreds of meters to ~2 km alongslope and tens of meters in across-slope direction (Fig. 3A+D). Isolated mounds show a conical geometry with diameters ranging from several tens of meters to more than 250 m (Fig. 3B). They frequently occur with an elongated shaped in an alongslope alignment, starting to form a chain (Fig. 3D). Overall, the Erosive Middle Slope hosts 85 % of all identified exposed mounds mainly as low-relief mound clusters (Fig. 11). In fact, the majority of all exposed mounds (70%) is located just above the moat between 900 and 1050 m water depth, with a decrease in density and number further upslope (Fig. 11). In contrast, the contourite moat exhibit larger yet fewer isolated mounds and mound chains (Fig. 11).
Buried mounds were identified downslope of the exposed mounds on the Ewing Terrace in water depth between 1050 and 1150 m, cov- ering an area of ~600 km2 in the SW sector of the working area (Fig. 11). They root on U1 and show two different internal acoustic facies: Facies 1 is mainly acoustically transparent with prominent mounds and few diffraction hyperbolas, whereas Facies 2 is acoustically transparent-to-chaotic with a less pronounced mounded morphology and almost no diffraction hyperbolas (Fig. 4D). The mean height above the base reflection is ~6 m with a local maximum of 27 m (Fig. 11).
Hence, they can most likely be classified as mound clusters. The over- lying reflections onlap onto the mounds and fill the space between them. Below U1, we identified another transparent unit with a locally mounded morphology rooting on the erosive surface U2 potentially representing another buried mound unit (Fig. 4D). This unit is overlain by parallel, continuous reflections, which are truncated by U1 (Fig. 4D).
Fig. 3.Detailed bathymetric maps, PARASOUND profiles (VE ~25), and sediment samples illustrating the general morphology and coral mound characteristics (for location seeFig. 2). (A) 25x25 m bathymetric map showing the Ewing Terrace Moat with internal terraces, topographic highs, and depressions (scours) as well as the Erosive Middle Slope and associated terrace scarps. (B)-(D) Bathymetric close-ups (10x10 m) of the different mound types. (B) Isolated mounds located in the contourite moat with the location of profile GeoB18-034 and sampling station GeoB22715-1. (C) Mound clusters indicated by arrows occurring along the Erosive Middle Slope with the location of profile GeoB18-035 and sampling station GeoB22744-2. (D) Mound chains located in the contourite moat. (E) Profile GeoB18-034 illustrating the acoustic characteristics of isolated mounds and (F) photo of box corer GeoB22715-1 showing abundant fragments of the coralB. candidain a silty- sandy matrix. (G) Profile GeoB18-035 illustrating the acoustic characteristics of mound clusters and (H) photo of box corer GeoB22744-2 showing a diverse community of living soft and hard corals as well as fragments ofB. candida.
Fig. 4.NW-SE oriented PARASOUND profile GeoB18-029 (VE ~43) illustrating the acoustic characteristics of the main erosive and depositional features as well as mounds (for location seeFig. 2). (A) Overview of the entire profile showing the Erosive Middle Slope, the Ewing Terrace Moat, and the Ewing Terrace as well as associated exposed (red arrows) and buried (between yellow horizon and U1) mounds. (B) Close-up of the Erosive Middle Slope, showing the exposed mounds rooting on the Mid-Slope Erosional Surface (MES) and forming a mound cluster. (C) Close-up of a topographic high within the contourite moat hosting an isolated mound. (D) Close-up of the Ewing Terrace showing the buried mounds illustrating their different acoustic facies (Facies 1 and 2) and the overlying contourite deposits. Below U1, another potential buried mound unit is visible.
3.3. Current regime inferred from ADCP data
Low near-bottom currents (< 10 cm s-1) with north-eastward or- ientation are observed on the Ewing Terrace (Fig. 7), where we iden- tified the buried mounds overlain by contourite deposits (Fig. 4D). In contrast, the Erosive Middle Slope, featuring mainly mound clusters (Figs. 3C+G, 4B), shows mostly medium (20-30 cm s-1) NE to NW near- bottom velocities (Fig. 7). Very high (40-50 cm s-1) north-westward- flowing and even westward-flowing near-bottom currents occur at the SW termination of the moat (Fig. 7), north of the Ewing Terrace shoal (Fig. 2). Near-bottom currents in the moat show highly variable values ranging between 3 and 52 cm s-1(Fig. 8A). The calculated mean near- bottom velocities vary from 15 to 38 cm s-1(Fig. 8B), with a decreasing trend towards the Northeast, coincident with a widening of the moat (Fig. 7).
Fig. 9, showing a NW-SE current velocity transect coincident with the PARASOUND profile in Fig. 4, illustrates the variability of the along-moat currents in the water column. The Erosive Middle Slope is characterized by relatively variable current regime with very high surface velocities (52 cm s-1) at < 100 m water depth, high velocities (30-40 cm s-1) between 100 and 700 m water depth, and medium ve- locities (20-30 cm s-1) beneath 700 m. The moat represents the area of highestflow velocities with values of 30 to 55 cm s-1at < 700 m water depth and 20 to 47 cm s-1below that depth. The NW-SE current velocity transect also highlights the Ewing Terrace as a low current velocity area with values of < 20 cm s-1throughout the water column and a pro- nounced near-bottom minimum (< 10 cm s-1) below 400 m water depth, and even an inversion of the along-moat current velocities at 54.45°W.
3.4. Water-mass properties from CTD data
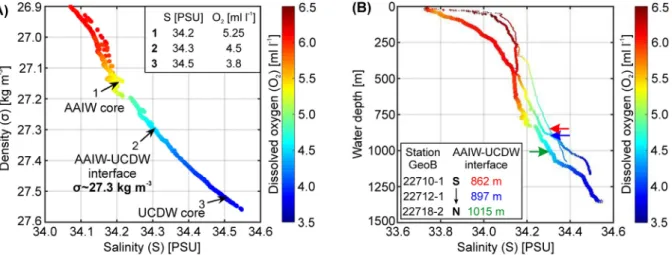
The core of the AAIW is characterized by high dissolved oxygen content of 5.25 ml l-1and a salinity minimum of 34.2, while the UCDW core shows a distinct dissolved oxygen minimum of 3.8 ml l-1and a high
salinity of 34.5 (Fig. 10A). The AAIW-UCDW interface representing the 50% mixture between both water masses lies close to the 27.3 kg m-3 isopycnal, corresponding to a dissolved oxygen concentration of 4.5 ml l-1and a salinity of 34.3 (Fig. 10A). Interestingly, this layer deepens towards the North from 862 m at GeoB22710-1 (38.5760°S), to 897 m at GeoB22712-1 (38.3315°S), and 1015 m at GeoB22718-2 (37.8813°S) (Fig. 10B).
4. Discussion
4.1. The Northern Argentine Mound Province
The acoustic facies and morphology of the identified mounds are strikingly similar to coral mounds described in the Mediterranean (Savini and Corselli, 2010), the NE Atlantic (e.g.De Mol et al., 2002;
Van Rooij et al., 2003; Huvenne et al., 2007), the Iberian margin (Somoza et al., 2014), and the Gulf of Mexico (Hübscher et al., 2010;
Hebbeln et al., 2014). The recovery of abundant fragments of the coral B. candidaembedded in a sediment matrix from exposed mounds on the Erosive Middle Slope and in the Ewing Terrace Moat during cruise SO260 (Kasten et al., 2019) further supports our interpretation as coral mounds (Fig. 3F). Moreover, living soft and hard corals were recovered from an exposed mound on the Erosive Middle Slope, indicating active mound aggradation (Fig. 3H).
The buried mounds were also interpreted as coral mounds due to their strong acoustic and morphological resemblance to the exposed mounds. We exclude that the buried mounds represent a mass-transport deposit (MTD) for several reasons. First, particularly Facies 1 shows well-delineated mounds with diffraction hyperbolas as similarly iden- tified in other buried coral mound settings (e.g.Huvenne et al., 2007;
Lo Iacono et al., 2014; Vandorpe et al., 2017), whereas MTDs are generally characterized by a hummocky topography and a chaotic fa- cies. Moreover, the buried mounds show an irregular thickness dis- tribution with local maxima corresponding to individual mounds, while MTDs are laterally continuous and often lens-shaped as offUruguay Fig. 5.NW-SE oriented PARASOUND profile GeoB18-045 (VE ~15) revealing pronounced upslope reflection truncation (erosion) and downslope deposition (for location seeFig. 2). Exposed mounds are indicated by red arrows. Purple circles mark the relative current strength as reconstructed from the morphosedimentary features and ACDP data. Maximum velocities were inferred for the area of maximum erosion associated with the contourite moat.
(Henkel et al., 2011, 2012;Krastel et al., 2011). Also, the absence of a headwall, corresponding to a potential slope failure, as well as the fact that neither our data nor previous studies show any other evidence for recent MTDs in the working area strengthens our interpretation (Krastel et al., 2011;Preu et al., 2012, 2013). The Erosive Middle Slope scarps extending over ~1700 km2 (Fig. 3A) can be ruled out as associated headwalls as the resulting MTD would need to be more voluminous and widespread over the entire Ewing Terrace, whereas the buried mounds occur only in the southern study area covering just ~600 km2(Fig. 11).
The presence of an additional deeper unit potentially representing older buried coral mounds (Fig. 4D), indicates another phase of mound de- velopment along the Ewing Terrace (see Section 4.5.). Both exposed and buried mounds, root on erosional horizons as the MES and un- conformity U1 (Figs. 3, 4). These surfaces show high reflectivity in the acoustic data, suggesting the presence of coarse and/or hard, con- solidated material, serving as ideal substrate for coral settlement and proliferation (De Mol et al., 2002;Huvenne et al., 2009b).
Our analysis shows that the buried and exposed mounds form an
extensive coral mound province, here termedNorthern Argentine Mound Province(NAMP) (Fig. 11), covering an area of at least 2000 km2and likely extending further to the SW. Therefore, the NAMP represents the largest coral mound province in terms of areal extent reported so far, followed by the Atlantic Moroccan Mound Province in the Gulf of Cadiz (~1800 km2; Wienberg et al., 2009; Vandorpe et al., 2017) and the Magellan Mound Province in the Porcupine Seabight (~1200 km2,De Mol et al., 2002). Moreover, the NAMP represents one of few global sites featuring widespread buried mounds in addition to examples from the Irish (De Mol et al., 2002;Huvenne et al., 2007;Wheeler et al., 2007), Mauritanian (Colman et al., 2005;Wienberg et al., 2018), and Moroccan margins (Foubert et al., 2008; Lo Iacono et al., 2014;
Vandorpe et al., 2017).
4.2. Detailed morphosedimentary analysis of erosive and depositional features
The prominent Ewing Terrace Moat (Fig. 2) was previously de- scribed byPreu et al. (2013)as a contourite channel, showing erosion along both flanks. Our high-resolution echosounder data, however, provide clear evidence for contourite deposition on the downslope flank, indicated by the presence of sigmoidal, upslope prograding re- flections, while exhibiting erosion along the upslopeflank only (Fig. 5).
Hence, a classification ascontourite moatinstead of contourite channel is more appropriate (Hernández-Molina et al., 2008; García et al., 2009). The moat is characterized by a previously unknown morpholo- gical complexity associated with internal terraces, bathymetric highs, and local depressions representing scours as well as furrows, indicating a highly variable erosive environment with locally enhanced erosion (Figs. 3A, 6). Along the slope, the degree of erosion increases sig- nificantly from SW to NE as evidenced by an increase in moat width and slope excavation, i.e. upslope moat migration (Figs. 2, 3A,6).
Compared to the Ewing Terrace Moat, showing very focused, in- tense upslope erosion (Fig. 5), the Erosive Middle Slope is characterized by widespread erosion along the MES (Fig. 4A). In fact, we were able to image this surface in greater detail than previous studies (Violante et al., 2010;Preu et al., 2013), revealing the presence of individual terraces with steep erosional scarps at their seaward side, hosting the majority of exposed coral mounds (Fig. 3A, 4B). The terraces corre- spond to outcropping high-amplitude reflections interpreted as highly consolidated, erosion-resistant layers bounding packages of low-am- plitude reflections representing weaker and, thus, erosion-prone strata (Figs. 3G,4B). When outcropping, the hard layers protect the under- lying material from widespread erosion. However, the terraces’scarps cut through the weak sedimentary strata (Fig. 4B), thereby locally ex- posing it to erosive processes and allowing for a continuous under- mining and landward retreat of the scarps. The presence of a highly- consolidated seabed and the absence of a recent sedimentary deposits along the entire Erosive Middle Slope, suggests recent and/or ongoing erosion or at least non-deposition / winnowing.
According to the established regional stratigraphic framework, we can infer that the strata eroded by the contourite moat and the MES is as old as the Middle Miocene (e.g.,Violante et al., 2010;Preu et al., 2012).
A tectonic control on the formation of the Ewing Terrace Moat or the Erosive Middle Slope scarps can be excluded as no major reflection displacements indicating faulting were visible in our data or in previous seismic studies (Hinz et al., 1999a, 1999b; Franke et al., 2007;
Gruetzner et al., 2012, 2016;Preu et al., 2012, 2013).
The Ewing Terrace is characterized by a highly variable depositional sequence showing phases of erosion, coral growth, and deposition in the Pleistocene as constrained by stratigraphic marker H1 (Violante et al., 2010;Preu et al., 2012) (Fig. 4D). Widespread erosion similar to that forming the MES is observed along U1, representing the base of the buried mounds (Fig. 4D). Recently, however, bottom-current-controlled deposition takes places as evidenced by sigmoidal or oblique reflections with local lens-shaped sediment bodies interpreted as contourite Fig. 6.Bathymetric profiles and slope illustrating the increase in complexity,
asymmetry, width of the contourite moat from SW to NE (for location see Fig. 2). All profiles are drawn to the same scale (VE ~14).
deposition (Fig. 4D) (Faugères et al., 1999;Rebesco and Camerlenghi, 2008). These deposits have gradually filled the space between the mounds, leading to their eventual burial (Fig. 4D). Below U1, we found indications for another similar succession of erosion associated with U2, followed by potential coral growth and subsequent deposition (Fig. 4D).
Hence, our data indicate at least one and potentially two significant transitions from erosional to depositional conditions during the Pleis- tocene (Fig. 4D). Moreover, the evidence for recent contourite deposi- tion refines our understanding of the sedimentary setting on the Ewing Terrace, which was previously classified as a non-depositional or ero- sive domain based on lower resolution seismic data (Hinz et al., 1999a, 1999b;Franke et al., 2007;Preu et al., 2012, 2013).
4.3. Bottom-current reconstructions from morphosedimentary features Bottom-current-induced morphosedimentary features as well as substrate grain sizes allow for an assessment of the long-term strength
and variability of hydrodynamic regime (e.g.Stow et al., 2002, 2009;
Faugères and Mulder, 2011). While erosional features and coarse grain sizes are indicative of vigorous bottom currents, contourite deposits and finer grain-sizes generally suggest a low-energy current environment (Stow et al., 2009). ADCP and CTD data are used as short-term in- formation on the current velocities and water-mass properties to sup- port the bottom-current reconstructions.
4.3.1. Bottom currents in the contourite moat
The upslopeflank of the Ewing Terrace Moat represents the area of maximum erosion (Fig. 5), indicating the persistent action of high-en- ergy currents. Previous studies suggest that the onset of erosion is re- lated to the development of stronger currents after the Mid-Miocene climatic optimum (Hernández-Molina et al., 2009;Violante et al., 2010;
Preu et al., 2012). Highly erosive localized bedforms such as scours (Fig. 3A) as well as the presence of coarse sediments within the moat (Bozzano et al., 2011;Kasten et al., 2019) can be regarded as further Fig. 7.Distribution of the time-averaged currents at 150 m above the seafloor derived from shipboard ADCP data in a 0.1° latitude x 0.1° longitude grid. Black arrows show current magnitude and direction; blue dots indicate the location of near-bottom measurements as shown inFig. 8.
evidence for long-term energetic flow dynamics (Stow et al., 2002, 2009). This interpretation is also supported by the ACDP data showing very high current velocities of up to 52 cm s-1at 150 m above the seafloor (Fig. 8A), which are likely even more accelerated when con- fined in the moat and plastered against the steepflank by the Coriolis force (Hernández-Molina et al., 2008; Faugères and Mulder, 2011).
Since the contourite moat is located approximately at the transition zone between the northward-flowing AAIW and the UCDW (~1000 m) (Figs. 2, 11), its formation and maintenance is probably related to turbulent, high-energy currents and internal waves driven by major density gradients as typically observed at water-mass boundaries (Dickson and McCave, 1986;Pomar et al., 2012;Rebesco et al., 2014).
Fig. 8.Illustration of the latitudinal variation of the near-bottom currents 150 m above the seafloor derived from ADCP measurements within the Ewing Terrace Moat. (A) All near-bottom current measurements (for location seeFig. 7), and (B) calculated mean current velocity 150 m above the seafloor computed for intervals of 0.05° of latitude, showing a decreasing trend towards the North.
Fig. 9.NW-SE transect showing the along-moat current velocities derived from shipboard ADCP data over the Erosive Middle Slope, Ewing Terrace Moat, and Ewing Terrace (for location seeFig. 2). The transect is coincident with the PARASOUND profile shown inFig. 5. Positive (negative) values indicate north-eastward (south- westward)flow. A pronounced current velocity minimum can be observed along the Ewing Terrace. The bathymetry profile is included.
Therefore, its location likely marks the long-term position of the AAIW- UCDW interface since the Middle Miocene. The slight downslope dis- placement of the contourite moat to ~1100 m in the NE (Fig. 2) may be caused by a northward deepening of the overall hydrographic structure, including the AAIW-UCDW interface towards the Brazil-Malvinas Confluence Zone. This is supported by the deepening of the AAIW- UCDW interface from 862 m in CTD GeoB22710-1 (38.5760°S) to 1015 m in CTD GeoB22718-2 (37.8813°S) (Fig. 10B). Moreover, Piola and Matano (2001)also identified the AAIW-UCDW interface at ~1000 m water depth in a section acquired close to 38°S. The abrupt beginning of the contourite moat in the SW may be a result of a change in slope trend associated with the NE deepening of the Ewing Terrace to water depth greater than 1000 m (Fig. 2). Accentuated by the Coriolis force, the high-energy currents associated with the AAIW-UCDW interface im- pinge against the slope north of the Ewing Terrace shoal, thereby generating highly plastered and acceleratedflow conditions, promoting erosion and thus the formation of the moat (Fig. 11). Additionally, the elevated seafloor topography may interact with the northward-flowing currents inducing turbulence and further enhancing erosion where the moat starts (i.e., downstream). The ADCP data support the interpreta- tion of a localflow modification and enhancement by revealing a de- viation from the typical north-eastward flow to north-westward and westwardflowing near-bottom currents, with very high current velo- cities (40-50 cm s-1) at the initiation of the contourite moat (Fig. 7).
The strikingly asymmetric deposition-and-erosion pattern of the moat (Fig. 5) may be regarded as strong indication for the presence of a Coriolis-induced helicalflow within the moat (Cossu et al., 2010;Gong et al., 2017). Such an oceanographic feature generates a plastered high- current velocity core forcing the moat to migrate upslope, while the downslope side shows lower current velocities associated with a de- crease in erosive capacity allowing for the deposition of the eroded material (Fig. 5) (Faugères et al., 1999; Faugères and Mulder, 2011;
Gong et al., 2017). This is in agreement with our observation from the ADCP data showing a pronounced near-bottom current velocities minimum (< 10 cm s-1) seaward of the contourite moat on the Ewing Terrace (Figs. 7, 9). The highly variable near-bottom current velocities measured within the moat (3–52 cm s-1,Fig. 8A) is likely a result of the irregular topography affecting the current velocities and inducing tur- bulence within the moat (Faugères and Mulder, 2011). The high to very-high near-bottom current velocity component with values of up to 52 cm s-1(Fig. 8) may represent plasteredflow conditions as associated with steep topographies such as the upslopeflank or local topographic highs, while the low current velocity component may represent locally deceleratedflow conditions over the gently-dipping terraces or behind topographic obstacles (Faugères and Mulder, 2011). The north-
eastward decrease of the mean near-bottom current velocities within the moat (Fig. 8) is likely a result of the widening of the moat (Fig. 2) leading to on average less plastered and acceleratedflow conditions.
4.3.2. Bottom currents shaping the Erosive Middle Slope
Assuming that the Ewing Terrace Moat represents the long-term position of the AAIW-UCDW transition zone, we infer that the shallower Erosive Middle Slope has mainly been shaped by the AAIW (~500– 1000 m). Widespread erosion occurring along the MES suggests the persistent action of strong tabular bottom currents (Hernández-Molina et al., 2008;García et al., 2009;Preu et al., 2013;Rebesco et al., 2014) probably also since the Middle Miocene as suggested by previous stu- dies (Hernández-Molina et al., 2009;Violante et al., 2010;Preu et al., 2012). This is further supported by the ADCP data showing velocities of more than 40 cm s-1in the water column (Fig. 9) and mainly medium near-bottom velocities (20-30 cm s-1) at 150 m above the seafloor (Fig. 7), which are likely accelerated when plastered against the steep Erosive Middle Slope (Faugères and Mulder, 2011). A strong bottom- current regime associated with the AAIW is further suggested by high amounts of suspended material indicated by high turbidity measure- ments (Voigt et al., 2013;Preu et al., 2013) and the presence of silty- sandy to gravel-rich deposits (Bozzano et al., 2011), suggesting win- nowing.
4.3.3. Variations in bottom currents on the Ewing terrace
The majority of the Ewing Terrace has been influenced by the UCDW (> 1000 m) and is characterized by widespread contourite de- position, indicating the action of weak bottom currents favouring de- position (Fig. 4D). This is supported by a pronounced near-bottom current velocity minimum (< 10 cm s-1) and even a current velocity inversion in the ADCP data (Figs. 7, 9). Moreover, minor amounts of suspended material as indicated by low turbidity values (Voigt et al., 2013) and the equivalent barotropic nature of the Malvinas Current (Vivier and Provost, 1999) represent further evidence for a low trans- port capacity of the UCDW. However, the presence of the widespread unconformity U1 in the subsurface (Fig. 4B) suggests that strong tabular bottom currents, similar to those that have affected the Erosive Middle Slope and formed the MES with medium velocities of several decimeters per second (20-30 cm s-1;Section 4.3.2.), influenced the Ewing Terrace in the past. Therefore, a significant hydrodynamic change from an erosive, high-velocity current regime to low-velocityflow conditions promoting deposition occurred at least once during the Pleistocene, potentially even twice considering the presence of the deeper un- conformity U2 (Fig. 4D).
Fig. 10.Water-mass properties as inferred from 3 CTD stations (for location seeFig. 2). (A) Density-salinity scatterplot showing properties of the AAIW and UCDW cores, and the AAIW-UCDW interface. (B) Salinity against water depth illustrating a northward deepening of the AAIW-UCDW transition zone. Colours represent dissolved oxygen content.
4.4. Morphosedimentary and hydrodynamic control on the coral mound distribution
Our study indicates a direct relationship between the distribution of coral mounds and the morphosedimentary setting influenced by the AAIW and UCDW, forming a large-scale bottom-current-controlled en- vironment here termedCoral-Contourite System. The main features of the Coral-Contourite System in association with the regional oceano- graphy are presented inFig. 12and described in detail below. A mutual link of coral mounds and contourites to strong hydrodynamics induced by intermediate water masses was also found in the North Atlantic (Hebbeln et al., 2016) with examples from the Rockall Trough (Kenyon et al., 2003;Victorero et al., 2016), the Porcupine Seabight (Van Rooij et al., 2003; Wheeler et al., 2005;Huvenne et al., 2009a; Titschack et al., 2009;Foubert et al., 2011), the Gulf of Cádiz (Van Rooij et al., 2011;Vandorpe et al., 2014), and the Gulf of Mexico (Hübscher et al.,
2010).
The majority of exposed mounds, mostly low-relief mound clusters, occur on the Erosive Middle Slope, which has been influenced by the AAIW (Fig. 11). Here, they root on the hard/consolidated ground of the erosive terraces associated with the MES (Fig. 4B). The density and number of mounds are highest between 900 and ~1050 m water depth just above the contourite moat influenced by the turbulent, high-energy AAIW-UCDW transition zone (Figs. 11, 12). This clustering appears to be independent from the current velocity, which remains consistently moderate over the entire Erosive Middle Slope (20-30 cm s-1,Fig. 7), and the concentration of dissolved oxygen, which is also consistently high throughout the entire AAIW layer (5.25 ml l-1,Fig. 10A). Instead, an increased concentration of suspended particles including sediment and food, transported along the AAIW-UCDW density gradient and delivered upward by internal waves and turbulence enhanced by the irregular moat topography, could be responsible for creating favourable Fig. 11.Height distribution of the exposed and buried mounds as identified from the PARASOUND profiles in relation to the main morphological features and bottom-current regime. ~70% of all exposed mounds are located along the Erosive Middle Slope between 900 and 1050 m water depth in the influence range of the lower AAIW. Maximum height of the exposed coral mounds is reached within the contourite moat, in the highly dynamic transition zone of the AAIW-UCDW. Buried mounds occur on the Ewing Terrace in the influence range of the weak UCDW. The contour line spacing is 100 m.
conditions for coral mound development in the lower AAIW just above the moat. Due to strong transport capacity of the AAIW (seeSection 4.3.2.), these particles remain in suspension and excessive sedimenta- tion, potentially hampering coral growth, is prevented. Although the presence of the moat likely enhances the upward delivery of particles to the mounds, numerical modelling showed that significant resuspension develops above a density gradient also along uniform slopes (Bourgault et al., 2014). Hence, even when the moat is absent, the lower AAIW just above the AAIW-UCDW interface is likely enriched in sediment and food particles and, thus, more favourable for coral growth and mound development than the upper AAIW. As other water-mass properties such as dissolved oxygen, salinity (Fig. 10A), or temperature (Piola and Matano, 2001;Piola et al., 2013) are relatively stable throughout the entire AAIW, the observed upslope decrease in coral mound number on the Erosive Middle Slope was interpreted as being the result of a de- crease in suspended matter concentration with increasing distance from the moat (Figs. 11, 12). Therefore, the lower portion of the AAIW ap- pears to provide the ideal balance between the availability of suspended particles and sufficient bottom-current velocities to promote CWC growth and the aggradation of mounds.
Within the contourite moat, coral mounds occur in low number and density, which was interpreted as being the result of very strong bottom currents associated with dynamic processes at the AAIW-UCDW inter- face, causing maximum erosion (Fig. 5) and creating less favourable conditions for extensive CWC colonization and mound aggradation. As velocities exceeding 50 cm s-1were observed in other coral mound settings (Frederiksen et al., 1992;Kenyon et al., 2003;Dorschel et al., 2007), we assume that the currents within the moat must be even higher. This is in agreement with the ADCP data showing velocities of up to 52 cm s-1at 150 m above the seafloor (Fig. 8A) as well as the presence of gravel within the moat (Bozzano et al., 2011;Kasten and
Participants of RV Sonne Cruise SO260, 2019). The restricted occur- rence of mounds on elevated features such as local highs or internal- terrace edges, where they form isolated mounds and flow-parallel mound chains (Figs. 3, 11, 12), was attributed to a complex interaction between topographic elevations and bottom currents, locally modifying the current regime and inducing turbulence and/or upwelling (Owens and Hogg, 1980). This enhances the upward supply of food and sedi- ment towards the top of the elevated areas, thereby providing locally suitable conditions for coral mounds (Freiwald, 2002; Roberts et al., 2006). Once a mound has started to develop, it maintains a self-sus- tained turbulent hydrodynamic environment (Cyr et al., 2016;Hebbeln et al., 2016). With heights of ~60 m, the few existing mounds in the moat are significantly larger than the mound clusters on the Erosive Middle Slope (< 10 m), which may be a result of either faster ag- gradation rates or longer growth time and older age. Moreover, the bathymetric data suggest that mound chains originate from several isolated mounds that over time coalesce to a NE-SW trending chain in direction of theflow (Fig. 3D), thereby indicating that chains represent the more mature mound type.
On the Ewing Terrace, coral mounds developed in the past as in- dicated by the presence of buried mounds. Similarly to the exposed mounds, they also root on a widespread erosive surface (U1,Fig. 4D), suggesting a strong bottom-current regime at the time of their initia- tion. However, the modern hydrodynamic regime on the Ewing Terrace associated with the low-velocity (< 10 cm s-1), oxygen-poor (3.8 ml l-1) UCDW (Fig. 11) favouring deposition has led to a progressive burial and demise of pre-existing mounds as similarly observed in other mound provinces in the North Atlantic (e.g.Huvenne et al., 2007;Rüggeberg et al., 2007;De Mol et al., 2005;Brooke et al., 2009;Foubert et al., 2011;Fink et al., 2012;Lo Iacono et al., 2014). Moreover, the side-by- side occurrence of mounds and a prominent contourite drift as shown in Fig. 12.Perspective view on the Coral-Contourite System comprising exposed and buried coral mounds as well as depositional and erosive bottom-current-induced morphologies in relation to the regional oceanography. Low-relief mound clusters occur mainly on the Erosive Middle Slope in the influence range of the medium- current velocity lower AAIW; high-relief isolated mounds and mound chains occur mainly along elevated morphologies in the contourite moat at the high-current velocity, highly erosive transition zone of the AAIW and UCDW. The weak current regime of the UCDW promotes contourite deposition, leading to the burial of pre- existing generation of mounds (buried mounds).
Fig. 4D confirms that coral mounds are not only significantly influenced by bottom currents but in turn also modify the local current regime, affecting deposition and erosion in their vicinity (Van Rooij et al., 2003;
Huvenne et al., 2009b;Hebbeln et al., 2016).
4.5. Temporal and spatial variability of the coral mounds
The presence of buried and exposed coral mounds indicate different phases of mound development in the NAMP. Ourfindings suggest that the lower portion of the AAIW between 900 and 1050 m, just above the high-energy AAIW-UCDW transition zone forming the moat, provides the environmental optimum for recent mound development (Fig. 13).
The presence of buried mounds between ~1050 and 1150 m water depth further downslope on the Ewing Terrace indicates that favourable conditions and, thus, the environmental optimum within the AAIW was
~100–150 m deeper in the past, which may be linked to a lowering of the sea level during glacials (Waelbroeck et al., 2002). A glacial downshift of the AAIW was also postulated in studies from the Brazilian margin (Viana et al., 1998;Makou et al., 2010).
The modern situation with active mound development concentrated in the lower AAIW is representative for a highstand sea level and
therefore an interglacial setting (Fig. 13A). At the same time, the Ewing Terrace is under the influence of the weak UCDW favouring deposition.
Assuming a glacial-interglacial control on the environmental condi- tions, a sea-level fall would lead to a downward shift of the high-energy and erosive AAIW-UCDW transition zone onto the Ewing Terrace causing the formation of sea-level fall erosive surfaces such as un- conformity U1 cutting into strata previously deposited during highstand (Figs. 4D,13B). During glacial sea-level lowstand, the Ewing Terrace was under the influence of the lower portion of AAIW favouring active coral mound aggradation on the erosive surfaces generated during sea- level fall (Fig. 13B). Assuming that the buried mounds developed during the Last Glacial Maximum (LGM) (26.5–19 ka, Clark et al., 2009), we estimate average LGM coral aggradation rates of 80 cm kyr-1 (for the mean thickness of ~6 m) and up to 360 cm kyr-1(for a max- imum thickness of ~27 m). These values are in accordance with typical mound aggradation rates, ranging from 10s to 100s cm kyr-1(Hebbeln et al., 2016and references therein) with maximum values up to 1500 cm kyr-1as observed for coral mounds at the Norwegian shelf (López Correa et al., 2012;Titschack et al., 2015). During sea-level lowstand, the Erosive Middle Slope was under the influence of the upper portion of the AAIW and, thus, outside of the environmental optimum for CWC Fig. 13.Conceptual model illustrating the temporal variability of the coral mounds in the NAMP in response to glacial-interglacial sea-level variations. (A) In an interglacial period, representative of the modern situation, coral mound aggradation occurs mainly in the lower AAIW between 900 and 1050 m water depth just above the high-energy AAIW-UCDW interface forming the moat. Here, an ideal balance between medium current velocities and increased suspended particle concentration (SPC) due to erosive processes at the AAIW-UCDW transition zone is present (i.e., environmental optimum). (B) In a glacial period, the environmental optimum is located at greater water depth due to a downward shift of the AAIW, leading to coral mound aggradation on the Ewing Terrace. At the same time, the Erosive Middle Slope is influenced by the upper AAIW causing non-deposition or winnowing, while mound aggradation probably stagnates due to a lack of sediments and food. During sea-level fall, the highly erosive AAIW-UCDW transition zone moved over the Ewing Terrace causing erosion and the formation of sea-level fall erosive surfaces such as unconformity U1, representing the base for mound growth.
growth and mound aggradation. Hence, mound development at the Erosive Middle Slope probably stagnated and the medium current re- gime of the upper AAIW promoted non-deposition/winnowing, pre- venting the interglacial mounds from burial, or even leading to erosion (Fig. 13A). In the course of deglaciation, sea level raised and the AAIW shoaled to its modern position, leading to an upslope migration of the coral habitat to the Erosive Middle Slope. As sea-level rise occurs much faster than sea-level fall (Waelbroeck et al., 2002), erosion along the Ewing Terrace associated with the upward movement of the AAIW- UCDW transition zone can only occur for a relatively short duration of, for instance, ~10 ka for the last deglaciation. Hence, the glacial coral mounds are relatively well preserved with only Facies 2 showing in- dication for erosion by having a less mounded morphology (Fig. 4D).
Once the interglacial low-velocity current regime associated with the UCDW is re-established along the Ewing Terrace, contouritic deposition takes place the glacial mounds are being buried and, thus, decline. This scenario implies that the sedimentary cover burying the identified LGM Ewing Terrace mounds has deposited during the last 19 kyrs, yielding a mean sedimentation rate of 29 cm kyr-1(for a mean thickness of 5.5 m).
This value is at the upper end of typical contourite sedimentation rates (5–30 cm kyr-1) (Stow et al., 2008), with similar accumulation rates found in contourite drifts in the Gulf of Cádiz (Rebesco et al., 2014) or the Tyrrhenian Sea (Miramontes et al., 2016). The presence of a deeper succession of an erosional surface (U2) hosting potential mounds buried by sediments (Fig. 4D), indicates another phase of erosion, mound ag- gradation, and sedimentary deposition along the Ewing Terrace, prob- ably corresponding to a previous glacial-interglacial cycle. Accordingly, we propose that the exposed mounds likely represent several phases of interglacial mound growth.
A sea-level control on the NAMP is in good agreement withfindings from NW Atlantic (Gulf of Mexico) suggesting that CWC mound ag- gradation (demise) is directly linked to the presence (absence) of the AAIW in response to glacial-interglacial cycles (Matos et al., 2017).
Moreover, even in the NE Atlantic (Gulf of Cadiz) an enhanced AAIW appears to play an important role for the glacial proliferation of CWCs (Wienberg et al., 2010;Dubois-Dauphin et al., 2016).
As the buried mounds on the Ewing Terrace, representing multiple growth phases during different glacials, are interbedded within Pleistocene sediments (Fig. 4D), we tentatively link the onset of the entire mound system to the Mid-Pleistocene transition. This event marks a shift from a 41 ka to the modern 100 ka glacial-interglacial cycle and an associated intensification of the current regime (e.g.
Mudelsee and Schulz, 1997;Raymo et al., 1997), establishing the re- quired environmental conditions for the formation of coral mounds.
Accordingly, mound aggradation was likely initiated after the forma- tion of the Ewing Terrace Moat and Erosive Middle Slope, which started in the Middle Miocene (Hernández-Molina et al., 2009; Preu et al., 2012).
However, it should be noted that this is afirst attempt to understand the temporal variability of the NAMP. For a conclusive statement, ad- ditional sedimentological data and age constrains are required.
5. Conclusions
In this study, we describe for thefirst time the distribution and areal extent of exposed and buried coral mounds at the northern Argentine margin, forming the Northern Argentine Mound Province (NAMP), based on recently acquired echosounder data. Covering an area of more than 2000 km2, the NAMP represents the largest coral mound province in regard to areal extent discovered so far and a major site in the southern oceans, highlighting its potential as ideal natural laboratory for future CWC studies.
Our findings demonstrate a direct relationship between coral mound distribution and morphosedimentary features of the regional CDS controlled by intermediate water-masses and their interfaces, forming a here termed Coral-Contourite System. The controlling factor
for the development of mounds seems to be the availability of sus- pended food and sediment particles in combination with a sufficient bottom-current strength, keeping material in suspension while pre- venting destructive erosion and excessive sedimentation. In the NAMP, this environmental optimum is present in the lower portion of the AAIW between 900 and 1050 m just above the Ewing Terrace Moat, which is shaped by high-energy currents associated with the AAIW-UCDW in- terface. Above the moat, mounds benefit from an upward transport of food and sediment particles due to turbulent hydrodynamic processes at the water-mass density gradient, which are further enhanced by the irregular moat topography. Within the contourite moat, coral mounds occur only on local topographic highs, which seem to modify the otherwise highly erosive and destructive bottom current regime, thereby locally creating ideal conditions for coral growth. In contrast, weak currents, favouring extensive contourite deposition as observed for the UCDW, hamper mound growth due to increased sediment stress.
Ourfindings suggest that past mound development occurred 100 to 150 m deeper along the Ewing Terrace likely due to a downward shift of the AAIW as consequence of sea-level lowering during glacials. Hence, our study (1) emphasizes the importance of high-energy processes along water-mass boundaries and associated density gradients for the delivery of sediment and food particles to corals, and (2) substantiates the global role of the AAIW as a crucial water mass for coral mound development as also suggested by studies from the North Atlantic (Dubois-Dauphin et al., 2016;Matos et al., 2017).
Our results highlight the importance of CDSs in general and the Argentine/Uruguayan margin in particular as hotspots for coral mound occurrence. Future research into CDSs, thus, needs to be integrated with CWC investigations as the two concepts are closely linked. Therefore, scientific approaches also need to be interdisciplinary, combining geophysical, geological, oceanographic, and biological methods.
Moreover, systematic investigations of sediment samples from the NAMP are indispensable to ground truth our hypotheses and gain conclusive information on the age, longevity, and aggradation rates of the coral mounds as well as their evolution through time.
Declaration of Competing Interest
The authors declare that they have no known competingfinancial interests or personal relationships that could have appeared to influ- ence the work reported in this paper.
Acknowledgements
We thank the nautical and scientific crew, in particular the geo- physics team R. Brune, O. Ogunleye, A. Thieblemont, and F. Warnke, for on-board assistance during the RV SONNE Cruise SO260. RV SONNE Expedition SO260 was funded by and carried out in the framework of the DFG Research Centre/Cluster of Excellence‘The Ocean in the Earth System’(MARUM - Center for Marine Environmental Sciences at the University of Bremen). We received additional funding from the Helmholtz Association (Alfred Wegener Institute Helmholtz Centre for Polar and Marine Research, Bremerhaven). We are grateful to K.
Zonneveld and K.H. Baumann for the acquisition and handling of the CTD data during the SO260 Cruise. We also thank S. Brix-Elsig, C.M.
Chiessi, and D. Hebbeln for constructive discussions and useful com- ments during the writing process. We acknowledge Schlumberger for providing the VISTA 2D/3D Seismic Data Processing software package and to IHS for providing the KINGDOM seismic interpretation software.
We would also like to thank the anonymous reviewers, who have contributed to improve this manuscript with their constructive com- ments.