1. Introduction and background
There is a growing need to easily and rapidly detect spe- cific molecules in a sample and biosensors are on the rise to fulfil it. The best-known example is the detection of the blood sugar level of diabetics, but there are many more applications in healthcare, consumer goods, or environmental protection. For instance, pathogens are being detected to stop the spread of illnesses (Ecker, et al., 2008), residues of antibiotics in food are being monitored to avoid antibiotic resistance (Wegener, 2003), contaminations of water and air are examined to protect the environment (Justino, Duarte and Rocha-
Santos, 2017), and many more. We have picked a spe- cific kind of colorimetric biosensor, which before only existed as a laboratory assay, to upgrade it into a ready- to-use biosensor. After giving the definition of a bio- sensor and introducing these colorimetric biosensor assays, we will state the specific aim of our research.
1.1 Biosensors
The International Union of Pure and Applied Chemistry (IUPAC) defined in Thévenot, et al. (2001) that a bio- sensor is a device that transforms chemical informa- tion, e.g. concentration of a specific analyte in a sample,
JPMTR 139 | 2006 Original scientific paper
DOI 10.14622/JPMTR-2006 Received: 2020-04-29
UDC 543.4|53.082-023.5|(0.003) Accepted: 2020-10-28
Development and validation of a 3D-printed spectral verification system for colorimetric-based biosensors
Jacqueline Balles1,2, Robert Reiners1, Dieter Spiehl1,2, Edgar Dörsam1,2 and Andreas Blaeser2,3
1 Technical University of Darmstadt, Department of Mechanical Engineering, stamm@idd.tu-darmstadt.de
Institute of Printing Science and Technology, spiehl@idd.tu-darmstadt.de
Magdalenenstr. 2, 64289 Darmstadt, Germany doersam@idd.tu-darmstadt.de
2 Technical University of Darmstadt, Centre for Synthetic Biology, blaeser@idd.tu-darmstadt.de Schnittspahnstr. 10, B2|05, 64287 Darmstadt, Germany
3 Technical University of Darmstadt, Department of Mechanical Engineering, BioMedical Printing Technology,
Magdalenenstr. 2, 64289 Darmstadt, Germany
Abstract
We propose a method to transfer colorimetric assays based on gold nanoparticle aggregation from the laboratory to clinics, practices, or even to an application at home, by creating printed biosensors. While colorimetric assays need laboratory equipment and trained personnel, our printed biosensors (through manual pipetting) are storable, porta- ble and usable from anyone anywhere. The method is verified using a model system for detection of the analyte amino acid cysteine (cys) and a spectral experimental setup in transmission. The model system consists of dispersed gold nanoparticles, which aggregate after cys addition. The biosensor is created by pipetting droplets of a gold nanopar- ticle solution onto the carrier Hostaphan GN 4600. Its functionality is sustained during the drying process through an addition of glucose, which preserves the gold nanoparticles from aggregation through its amorphous state. The glucose mixture can be kept amorphous over a long time by controlling the surrounding humidity with silica gel beads in an airtight container. The sample mount for the experimental setup is 3D-printed and designed to measure the spectral transmittance of the biosensor before and after analyte addition. The characterization of the setup suggests to expect coefficients of variation below 1 %, which validates its use. The biosensor and transmission spectrometer are tested with analyte concentrations between 10 mM and 50 mM. After a successful verification the printed bio- sensor would be ready to be evaluated without special equipment, meaning visually or with commercially available imaging techniques. Keeping in mind the possible application at home, the most obvious solution is using your own eyes or smartphone. These methods are discussed in the outlook.
Keywords: spectrometer, gold nanoparticle aggregation, color change, ready to use, printed biosensor
into an analytically useful signal. To be more precise, a biosensor consists of several parts working together, as visualized in Figure 1. It represents what we plan to achieve in the future. In this paper we only analyze the transducer part. The recognition element works with a biochemical mechanism and is coupled via an interface to the transducer, which transforms the output from the recognition element into a measurable signal that is usually amplified.
Figure 1: Schematic representation of a specific colorimetric biosensor based on gold nanoparticles 1.2 Biosensor assays using gold nanoparticle
aggregation
One way to realize colorimetric biosensors is by using gold nanoparticles (AuNP) and their color change through aggregation as transducer element. The phys- ical phenomenon that enables the intense colors of AuNP ranging from red over purple to blue is called the localized surface plasmon resonance (LSPR). Details on the LSPR can be obtained in the review from Petryayeva and Krull (2011) amongst others. The essence is that the colors are caused by specific absorption spectra that are linked to the particle agglomeration size.
Figure 2: Absorption spectra of gold nanoparticles dispersed (A) and aggregated after cys addition (B, C),
measured in liquid state with a well plate reader, where (D) visualizes schematically the aggregation
by cys; altered from Zhong, et al. (2004) Figure 2 depicts the general idea: a well distributed solution of AuNPs in buffer solution absorbs wave- lengths in the green region and appears red (A). If the particles get agglomerated or linked to bigger clusters, the absorption peak broadens and shifts to higher wavelengths; accordingly, the color shifts to purple (B) or blue (C). This so-called aggregation can be brought about in different ways, which can be categorized into specific and unspecific aggregation. Examples for unspecific aggregation are destabilization mechanisms
or unspecific linkers, e.g. the amino acid cysteine (cys).
Cys binds to the surface of AuNP with the NH3+ and SH end groups (D) and creates links that form clusters.
If AuNP are used as a transducer in biosensors, only aggregation as a reaction to the specific analyte is wanted. This is called specific aggregation and can be realized by functionalizing the AuNP surface with rec- ognition elements. A good overview on the possible detector designs of AuNP based colorimetric biosen- sors is given by Zhao, Brook and Li (2008). One recog- nition element with high affinity and selectivity that is often used in this context are aptamers. They are single stranded DNA or RNA nucleic acids that bind through their complex 3D structure. Biosensors with aptamers as recognition element are called aptasensors. To give some examples on AuNP based aptasensors: Shi, et al.
(2013) measured acetamiprid in soil samples, Song, et al. (2011) sensed the antibiotic kanamycin, Wei, et al. (2007) detected the protein thrombin, and Zheng, Wang and Yang (2011) determined dopamine levels. All of these biosensors have in common, that they are eval- uated in liquid form using test tubes or micro plates and are dependent on the laboratory equipment and personnel. The absorption curves of the liquids are measured and presented as intensity ratios over ana- lyte concentration and show either a linear or loga- rithmic behavior. Therefore, we refer to these kinds of biosensors as assays.
1.3 Printing biosensors
Generally, printing techniques can be divided into conventional and digital printing. Conventional print- ing always needs a printing plate, while digital print- ing has the advantage of easily adjustable layout and usually smaller dead-beat volumes (Rech, 2000). The different digital printing techniques differ in amount of transferred ink. Inkjet transfers droplets with vol- umes of several pico liters (Hoath, 2016), pipetting and spotting are in the range of micro liters (Zhao, et al., 2008) and pneumatic dispensing works by depositing lines or dots of micro liter volumes with a controlled, pressurized air source (Komuro, et al., 2013). Printing of biomaterials often means pipetting or dispensing.
Here we use Eppendorf Research plus pipettes for manual pipetting to deposit the model system, but in future research this step can be automated.
1.4 Aim of research
The ultimate goal of our research is to bring biosen- sor assays based on gold nanoparticle aggregation from the laboratory into small clinics and homes by printing portable biosensor test strips. The difficulty of printing these kinds of biosensors lies in preserving the dispersed status of the AuNP during the drying and
storing process. Without additives the water within the deposited AuNP droplets will evaporate and leave aggregated AuNP behind. In order to prevent prema- ture nanoparticle aggregation additives are required.
In the literature, different types of sugars have suc- cessfully been applied for this task, e.g. in paper-based biosensors (Zhao, et al., 2008) or the conjugate pads of lateral flow tests (Choi, et al., 2010). Thus, the appli- cability of different sugars as additives were tested within this study.
The research described in this paper represents the first step: a printed unspecific biosensor, which can detect cys and a spectral measuring setup to verify its functionality. The idea is to start with an unspecific platform technology and later transfer it to a specific AuNP biosensor. In previous work we have been suc- cessful with a similar transfer. In Jaeger, et al. (2019) we printed a biosensor onto filter paper detecting the anti- biotic ciprofloxacin based on fluorescence. The work was based on printing DNA and DNA dyes as an unspe- cific biosensor, which was presented at the IARIGAI conference in 2018 and published in the JPMTR one year later (Stamm, et al., 2019).
2. Materials and methods
2.1 Construction of the transmission spectrometer To verify the functionality of the printed biosensor we needed an experimental setup to measure the absorption spectra. In the liquid state AuNP absorp- tion spectra are usually measured by absorbance microplate readers. For this we used the CLARIOstar Plus microplate reader from BMG LABTECH. It works by sending a light beam with intensity I0 through the probe and measuring the intensity I afterwards. The transmittance T is then calculated by the ratio of the two intensities and the absorbance A by the logarithm of T:
𝑇𝑇 =𝐼𝐼
𝐼𝐼$, 𝐴𝐴 = −𝑙𝑙𝑙𝑙𝑙𝑙,$𝑇𝑇 [1]
The printed biosensor could not be evaluated using a microplate reader, because it is only built for homo- geneous liquids. We needed a setup that will average over the whole sample by using one bigger light beam.
For this purpose, we created a transmission spectrom- eter with a 3D-printed mount and a Nanocalc 2000 UV-Vis-NIR spectrometer. The spectrometer measures light intensities in counts over wavelengths. Over and underexposure can be adjusted by varying the integra- tion time. The wavelengths are covered in 1 nm steps between 201 nm and 890 nm. To operate it in transmis- sion mode another UV-Vis-NIR optical fiber was needed (30–1 100 nm from Ocean Optics) and a 74-UV collima- tor lens (Φ 5 mm; 185–2 500 nm from Ocean Optics).
A mount was 3D-printed to hold everything together and specimen holders were also 3D-printed to enclose the sample and position it in the light beam. All parts were created with the 3D printer Prusa i3 MK3 and the material polylactic acid (PLA) through Fused Filament Fabrication.
2.2 Characterization of the transmission spectrometer
To validate the measurements with the transmis- sion spectrometer it needed to be characterized. The warm-up phase could be derived from the average coefficients of variation (CV) between the light source spectra of increasing time. Crosstalk could be exam- ined by using a laser diode from Laser Components, type: FP-D-450-1-C-C, with a peak at 450 nm and a peak width at half-height of 1–2 nm. The repeatability of transmission measurements could be validated by comparing the CVs of several measurements from fixed scenarios. For this purpose, we used the green optical cast plastic color filter from Edmund optics with the stock number 43-935. A time dependency was exam- ined by 19 measurements of the same filter with the same specimen holder, without removing it, and with- out calibration in between. This series was compared to a well plate reader measurement. The repositioning accuracy was tested for one and for different specimen holders, by reinserting it 19 times. Finally, a recalibra- tion was made in between measurements to test its effect on the CVs.
2.3 Biosensor fabrication
The model system used in this research was the well- known AuNP aggregation by addition of the analyte cys, as introduced in Figure 2. The biosensor consisted of 3 µl printed ink droplets on a carrier material. The ink was a mixture of AuNP and additives. The pre- treated side of polyethylene terephthalate (PET) foil Hostaphan GN 4600 from Mitsubishi Polyester Film GmbH was selected as carrier for the sensor system.
The biosensor was evaluated by pipetting the analyte solution onto the dried AuNP droplets.
2.4 Ink and analyte fabrication
The ink was prepared by blending AuNPs and additives by the mixing ratios of 1:1, 2:1 or 2:3 to reduce the orig- inal concentrations. The additives were needed to pre- vent premature aggregation of the AuNP during drying and storing. The AuNP were concentrated as follows:
• The store bought AuNP (Sigma Aldrich, prod.
no.: 777137, USA) solution came in citrate buffer and had a concentration of 1.64 × 10¹² particles per ml which equals 2.72 nM. The 10× and 20× solutions
were produced by centrifugation and removal of the supernatant; 10× equals 90 % removal and 20×
equals 95 % removal.
• The concentrations of the additives sucrose (Sucrose, Sigma Aldrich, prod. no.: S7903 USA), glucose (D(+)-Glucose, Carl Roth, prod.no.: X997.2, Germany), fructose (D(-)-Fructose, VWR, prod. no.:
24282.290, Germany), agarose (Agarose, low gel- ling temperature, Sigma Aldrich, prod. no.: A9414- 100G, USA) and alginate (Alginic acid sodium salt from brown algae, Sigma Aldrich, prod. no.: 71238- 250G, USA) were prepared in weight percentages, by being dissolved in osmose water. Isopropanol (Böttcherin IPA, Felix Böttcher, prod. no.: 10501, Germany) was used as delivered.
• The analyte solutions were prepared by creat- ing a stock solution and diluting it to the desired molar concentrations. A 1 M stock solution was prepared by dissolving 1.2116 g of cys (L-Cysteine, Sigma Aldrich, prod. no.: W326305, USA) in 10 ml of osmose water. Dilutions between 5 mM and 50 mM were used.
2.5 Drying and storage of biosensors
The phenomenon of amorph sugars crystallizing has been observed by papers on related research topics.
Labuza and Labuza (2004) studied the stability of cot- ton candy, which consists of sucrose. They found that by storing it at room temperature with reduced humid- ity between zero and 11 % the cotton candy stayed amorphous for up to 2 years. As the humidity increases the time until crystallization decreases. The explana- tion is that to stay amorphous the sugar has to stay at or above the glass transition temperature, which is related to the given relative humidity. Leinen and Labuza (2006) explored the possibility to add a small percent of another sugar to an amorphous sucrose sys- tem to increase its stability.
The drying behavior and storage over 4 weeks were investigated at the example of the additive sucrose. The ink was prepared by using 10× AuNP and 30 % sucrose at a mixing ratio of 2:1. There were four conditions used to dry 3 µl droplets of the ink on the Hostaphan foil: open, in the oven, in the fridge and dehumidified.
The open samples were exposed to 25 °C and 45 % air relative humidity. The oven samples were dried for 1.5 hours in a 60 °C oven and then stored in the open.
The fridge samples were immediately put in a box and stored at 4 °C. The dehumidified samples were stored in airtight containers with silica gel beads (Carl Roth, prod. no.: 2440, Germany). The beads have an incorpo- rated indicator, which changes the beads’ color from dark blue to pink at saturation. The humidity in the
box was measured to be lower than 20 %, by the dig- ital Thermo-Hygrometer (VWR, prod. no.: 620-0915, Germany). But the humidity could be considerably lower, as the color of the beads stayed blue for months when the box stayed unopened.
3. Results and discussion
The present study describes the development and val- idation of a 3D-printed spectral verification system for colorimetric-based biosensors focusing on two objectives. First, the suitability of different sugars and polysaccharides as nanoparticle aggregation prevent- ing additives were tested on an unspecific biosensor.
Second, the development of a spectral setup to validate the functionality of the printed biosensor is presented.
3.1 Experimentally optimizing the biosensor fabrication
We evaluated the suitability of the different additives qualitatively by observation with the human eye. The additives and the AuNP solutions were prepared as explained in Section 2. The ink was prepared by mixing both solutions in the stated mixing ratio. The suitabil- ity experiment consisted of two steps.
First several 3 µl droplets of each ink were pipetted onto the foil and let dry for approximately one hour.
The color is supposed to stay red. In a second step dif- ferent concentrations of the aggregation analyte were pipetted on top. Only after the second step the color is supposed to change. In our experiments the first step was successful with sucrose, glucose, fructose and alg- inate. Nearly homogeneous droplets were formed dur- ing the drying process. However, in the second step the biosensor with alginate did not change its color after analyte addition.
Between the suitable analytes glucose was chosen for transmission measurements of the biosensor, because it yielded the fastest color change after analyte addi- tion. Additionally, other additives and compositions were tested, which did not yield promising results. All results are summarized in Table 1.
While strong colors could be observed in reflection with 20× AuNP and mixing ratios of 1:1 with glucose, the absorption is too high for the transmission spec- trometer to yield good results. This is why the mix- ing ratio was reduced to 2:3. The color change of the biosensor used for transmission measurements is shown in Figure 3. The pictures before aggregation were obtained after a 24-hour drying period and the after-aggregation pictures were obtained 40 minutes after cys addition.
Figure 4: Photographs of the results of the drying and storing experiment with 3 µl drops of 2:1 10× AuNP and 30 % sucrose after four weeks; nine samples are shown for each condition: open, oven, fridge and dehumidified, which are either aggregated, crystallized or functional;
one exemplary sample of each state is magnified 3.2 Buildup and characterization
of a transmission spectrometer
The measuring setup and specimen holders are shown in Figure 5; the construction and light path are illus- trated in Figure 6. The mount was constructed to meet Figure 3: Photograph of four pipetted unspecific
biosensors: the droplets consist of 2:3 AuNP (20×) and glucose (50 %), they were captured under D65 lighting
panel before and after aggregation with 3 µl of different cys solutions
The results of the drying and storing experiment for four weeks are shown in Figure 4. If the drops were left in the open, they aggregated (blue dots) or crystallized (lighter dots). At high temperatures even more drops crystallized. Storage at low temperatures lead to no visible change compared to the open. The best solution was storing the biosensors in airtight containers with silica gel beads. This way they could be stored at least four weeks and stay functional (red color).
Table 1: Suitability of different additives Additive
Concentration AuNP : additive
Mixing
ratios Results Suitable?
Sucrose 10× : 30 % 2:1 Slow aggregation. Nearly homogeneous droplets. Yes Sucrose 20× : 50 % 1:1 Slow aggregation. Nearly homogeneous droplets,
preferable to 30 %.
Yes Glucose 20× : 50 % 1:1 Quick aggregation with cys. Nearly homogeneous
droplets.
Yes Fructose 20× : 50 % 1:1 Slow aggregation. Nearly homogeneous droplets. Yes Agarose 10× : 0.5 % 2:1 Highly irregular aggregation and color
distribution.
No Agarose 10× : 0.25 % 2:1 Highly irregular aggregation and color
distribution.
No
Alginate 10× : 0.5 % 2:1 No aggregation of AuNP. No
Sucrose & Isopropanol 10×: 30 % : 99.9 % 2:1:1 Disintegration and running and reduced aggregation.
No Sucrose & Agarose 10× : 30 % : 0.5 % 2:1:1 Less homogeneous than agarose alone. Moderately
a) b)
Figure 5: Measuring setup including (a) the NanoCalc 2000 spectrometer and the 3D-printed mount, and (b) the specimen holders, which enclose the biosensor and are inserted into the measuring setup
several requirements, which are that the samples can be placed precisely at the same location, while the dis- tance between light source and sample as well as sam- ple and detector can be adapted. The conic light beam illuminated the entire hole with 2.5 mm diameter in the specimen holder and therefore the whole sample.
Furthermore, the samples were placed horizontally to enable measurements in the liquid state with the light path perpendicular to the sample. All components can be dismounted through screw connections, exterior light is shielded and it is possible to easily convert back to reflective mode. The whole setup will be called transmission spectrometer.
To validate the measurements with the newly created transmission spectrometer, a thorough characteri- zation was carried out. A needed warm-up phase of 10 minutes was derived from the average CVs between the light source spectra of increasing time. The first measurement differs from the others with an aver- age CV of 0.027. But, after 10 minutes the CV is below 0.0021. Crosstalk is examined by using a laser diode
with a peak at 450 nm and a peak width at half-height of 1–2 nm. The measured spectrum exhibited a peak at 451 nm with 7 nm width. This shows that the precision of the detector is indeed 1 nm, but the crosstalk is big- ger. Finally, transmittance measurements of the green plastic color filter were carried out to test the repeata- bility with five different test series.
The first test series measured the time dependency after the warm up phase. The filter was measured 19 times without removing it and without calibra- tions in between. The average transmittance spectrum is shown in Figure 7. The average CV and percen- tal standard deviation can be found in Table 2, test series 1. The CV is the highest for transmittance values below 470 nm, which are close to zero. Still the devia- tions are very small, with a maximal CV of 0.075. For each test series the average CV is given for all wave- lengths and for wavelengths longer than 470 nm. The later excludes transmittance values close to zero and is called “zero excluded”. For the first test series the average CVs are 0.014 over all wavelengths, and 0.005 for zero excluded.
Table 2: Average CV results from dividing the standard deviation by the transmittance values given from all values (overall) and excluding transmittance values close to 0 (zero excluded)
for five test series conducted measuring the green color filter Test series
Coefficient of variation
Average overall Average zero excluded 1: Time dependent variation, the sample is not moved (Figure 7) 0.014 0.005
2: Comparing the results of first series
with well plate reader measurements (Figure 8)
0.138 0.045
3: Repositioning accuracy by using the same specimen holder, the sample removing and reinserting between measurements
0.019 0.009
4: Repositioning accuracy by using different specimen holders 0.024 0.013 5: Recalibration between measurements of fourth series 0.020 0.008 Figure 6: Schematic of the 3D-printed mount; A: front view, B: side view,
C: cross section view, D: exploded view and E: optical light path
0 % 10 % 20 % 30 % 40 % 50 %
0.00 0.02 0.04 0.06 0.08
400 450 500 550 600 650 700
Transmittance
Coefficient of variation
Wavelength (nm)
CV own setup Transmittance with own setup
Figure 7: First test series: average transmittance (blue) and CV (orange) of 19 measurements with the same
specimen holder, same green color filter and no removal; the errors given by standard deviation are too
small to be visible as error bars.
In the second test series the measured spectra with the transmission spectrometer were compared to the aver- age transmittance measurement with the well plate reader CLARIOstar Plus of the same filter. Both average transmittance spectra are shown in Figure 8, including the CVs of the CLARIOstar measurements and the CVs of both average transmittance spectra to give a com- parison between them. The CLARIOstar measurements consisted of two data sets, which each consisted of 22 averaged data points taken. The average CVs over all wavelengths of the CLARIOstar measurement are 0.035 and with zero excluded 0.004, although the maximal CV reaches a value of 0.85. These high CV values are rare and do not matter since they only occur for values close to zero. In a next step the average spectra of both measurement methods were compared. The average CVs between the two average spectra are overall 0.138 and with zero excluded 0.045. Both values show an increase of more than the power of ten compared to the other test series. In Section 3.3 these values magni- tudes will be compared to the magnitudes of measured biosensor samples.
50 % 40 % 30 % 20 % 10 % 0.00 0 %
0.20 0.40 0.60 0.80 1.00
400 450 500 550 600 650 700
Transmittance
Coefficient of variation
Wavelength (nm)
CV CLARIOstar CV between T with own setup T with CLARIOstar
Figure 8: Second test series: average transmittance of the green color filter from own setup (blue) and from well plate reader CLARIOstar (grey); the CVs are given for the CLARIOstar measurements (yellow) and for the deviation between the average transmission spectra of
both measurements (orange)
In Table 2 the results are summarized, including three additional test series. Later when measuring the trans- mittance spectra of the biosensors will be removing
and reinserting samples (test series 3) with different specimen holders (test series 4). This will increase the errors, while a new calibration in between these meas- urements (test series 5) will reduce the error. The max- imal CV, excluding test series 2, resulted while using different specimen holders and without calibration between measurements. It amounts to 0.024 over all wavelengths.
3.3 Biosensor measurements
Finally, the transmission spectrometer was tested with the biosensor. For the following experiment a new cali- bration was made in between different samples. As these transmittance spectra do not get close to zero an average CV of 0.008 is expected resulting from the measuring setup. Forty biosensors with the properties described in Section 2 were created. Here we use 20×
AuNP and 50 % glucose in a mixing ratio of 2:3. Twenty samples were measured after drying for 1 hour and the other 20 samples after drying for 24 hours. Figure 9 shows the average transmittance spectrum and cor- responding CVs at the example of the AuNP measure- ment after 24 hours. Additionally, the spectra of the two samples with minimal and maximal transmittance are included. At smaller wavelengths below 500 nm the CV is around 0.13, it increases and reaches a maximum at 560 nm with 0.16. Afterwards the CV decreases con- stantly and reaches 0.06 at 650 nm. This shows that the crucial region, where most of the spectral change happens is below 650 nm. For the other samples the CV is more constant over the whole spectrum.
0 % 20 % 40 % 60 % 80 % 100 %
0.00 0.05 0.10 0.15 0.20
400 450 500 550 600 650 700
Transmittance
Coefficient of variation
Wavelength (nm) CV
Minimal transmittance
Average transmittance Maximal transmittance
Figure 9: The average transmittance of the AuNP-after- 24-hours measurement including the corresponding CVs
and the transmittance spectra of two samples with minimal and maximal transmittance
After the measurement of samples dried for 24-hours, the analyte was added: 3 µl of four different analyte solutions were pipetted onto the dried AuNP drop- lets. The concentrations of the analyte solutions were 10 mM, 25 mM and 50 mM cys in water, as a reference only water was used. This way, 10 identical biosensors for each analyte concentration were tested. One hour after analyte addition the color change was complete and the transmittance of the biosensors was measured again. Figure 10 shows the average transmittance spec-
tra of all different measurements. The absorption peak becomes a transmittance valley in this representation.
The higher the analyte concentration the broader the valley and the greater the shift to bigger wavelengths.
At the same time the slope connecting the transmit- tance valley and higher wavelengths gets less steep.
Only considering concentrations higher than 25 mM another phenomenon can be observed: the overall transmittance increases, making the sample more and more translucent. The transmittance curve of the AuNPs without any analyte also shifts to higher wave- length while being stored for one day and the water addition increases the transmittance a little bit, while the slope gets a little less steep. These three transfor- mations are signs that a little bit of aggregation was already taking place, without analyte addition. The average CVs of the AuNP spectra are: 0.125 (1 hour), 0.113 (24 hours), 0.111 (10 mM cys), 0.115 (25 mM cys) and 0.096 (50 mM cys). These values should be com- pared to the CVs with zero excluded from Table 2, because here we have no values close to zero.
10 % 30 % 50 % 70 % 90 %
400 450 500 550 600 650 700
Transmittance
Wavelength (nm)
AuNP 1 hour AuNP 1 day AuNP & water AuNP & 10 mM Cys AuNP & 25 mM Cys AuNP & 50 mM Cys
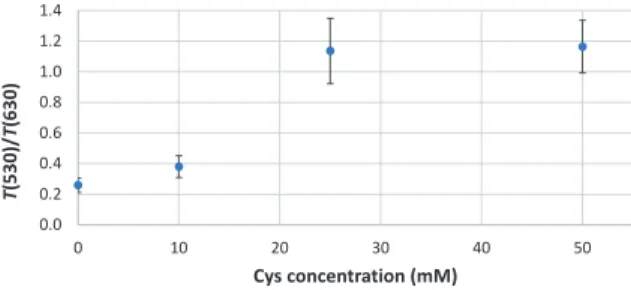
Figure 10: The transmittance curves of AuNP after drying for one hour and for one day, after the addition of osmose water, 10 mM cys, 25 mM cys and 50 mM cys To conclude the analyte concentration from measured transmittance spectra of unknown samples, a simpler relation is needed. In literature usually a ratio between two points of the transmittance or absorption spec- trum is formed and plotted over the analyte concen- tration. One point describes the red fraction, the other the blue fraction. The exact wavelengths are chosen according to the sample.
0.0 0.2 0.4 0.6 0.8 1.0 1.2 1.4
0 10 20 30 40 50
T(530)/T(630)
Cys concentration (mM)
Figure 11: Ratio of the transmissions from 530 nm (red) to 630 nm (blue) over cys concentration taken from the
transmission spectra shown in Figure 9
In Figure 11 we used the transmittance at 530 nm for the red value and the transmittance at 630 nm for the blue value. As this was a proof-of-concept experiment, we did not measure enough different analyte concen- trations to precisely describe the course of the trans- mittance ratio over cys concentration. But, from these values it is possible to derive the region of interest. In future research we will focus on the region between 10 mM and 25 mM.
Usually the light source spectrum should be cancelled out in the transmittance spectrum, which is calculated by dividing the light intensity after and before passing through the probe (see Equation [1]). But this is only true if the detector counts are linear with increasing intensity. The linearity of the spectrometer detector was examined by measuring a series of spectra with increasing integration time. For exemplary wave- lengths the counts were plotted over the integration time and it was found that its course was only linear up to 2 500 counts from maximal 4 096 counts. This means that measurements should only be carried out in the lower 61 % region of the maximal counts and not up to 80 % as the producer states.
4. Conclusions and outlook
With this research we showed that it is possible to print and dry AuNP biosensor assays when using glucose or sucrose as additives, to store the printed biosensors and to spectrally evaluate the analyte concentration based on a model system consisting of dispersed gold nanoparticles, which aggregate after cys addition.
One disadvantage of this method is the crystallization which can occur if the biosensors are stored at high humidity. We chose to use silica gel beads in an air-tight storing box to decrease the humidity and slow down the crystallization process. Another solution could be using additional sugars such as trehalose and raffinose or vacuum-packing the biosensors individually, but the latter would need a mechanical protection around the AuNP droplets. Another disadvantage is that after analyte addition the droplets are in liquid form and prone to running while handling the biosensor. This could be solved by creating depressions in the carrier material which hold the liquid at its original position.
We experimented with this, which yielded good results for visual and imaging processes, but not for the spec- tral measurements, because the depressions enhance the lens effect of the droplets. Moreover, we analyzed the occurring bumps in the transmittance spectra at 656 nm and 580 nm. We found that the linearity of the detector is only given in the lower 61 % region of the maximal counts. Future research should consider this and receive no bumps in the spectra.
As an outlook we have some ideas how a biosensor created based on our method could be evaluated after analyte addition in a home application. A user-friendly method would include either visually evaluating the changed color or using a smartphone as measuring equipment. The later could use the built-in camera to take a picture. Research would be needed on if the automatic picture enhancements are hindering or helpful. The RGB values of the droplets could be compared to a data base with pictures of known ana- lyte concentrations or an algorithm could be found to directly calculate the concentrations. Either way a cam- era calibration will be needed at some point to make
up for varying environmental conditions and different types of installed cameras. The visual analysis as well as the smartphone based one would need a reference color chart for comparison, which could be printed on a reference piece from the same material as the carrier material of the biosensor.
Another idea for visual analysis includes printing several droplets on one biosensor that have increasing sensi- bility for the analyte. The user would only have to judge for each droplet if it had changed color or not and the analyte concentration would lie between the last drop- let which had changed color and the first which had not.
Acknowledgments
D.S. thanks the Merck KGaA for support through the Merck Lab @ TU Darmstadt, also we thank the Technical University of Darmstadt for funding our vital preliminary work within the project Forum for Interdisciplinary Research.
References
Choi, D.H., Lee, S.K., Oh, Y.K., Bae, B.W., Lee, S.D., Kim, S., Shin, Y.B. and Kim, M.-G., 2010. A dual gold nanoparticle conjugate-based lateral flow assay (LFA) method for the analysis of troponin I. Biosensors and Bioelectronics, 25(8), pp. 1999–2002. https://doi.org/10.1016/j.bios.2010.01.019.
Ecker, D.J., Sampath, R., Massire, C., Blyn, L.B., Hall, T.A., Eshoo, M.W. and Hofstadler, S.A., 2008. Ibis T5000: a universal biosensor approach for microbiology. Nature Reviews Microbiology, 6(7), pp. 553–558.
https://doi.org/10.1038/nrmicro1918.
Hoath, S.D. ed., 2016. Fundamentals of inkjet printing: the science of inkjet and droplets. Weinheim, Germany:
John Wiley & Sons.
Jaeger, J., Groher, F., Stamm, J., Spiehl, D., Braun, J., Dörsam, E. and Suess, B., 2019. Characterization and inkjet printing of an RNA aptamer for paper-based biosensing of ciprofloxacin. Biosensors, 9(1): 7. https://doi.org/10.3390/bios9010007.
Justino, C.I.L., Duarte, A.C. and Rocha-Santos, T.A.P., 2017. Recent progress in biosensors for environmental monitoring:
a review. Sensors, 17(12): 2918. https://doi.org/10.3390/s17122918.
Komuro, N., Takaki, S., Suzuki, K. and Citterio, D., 2013. Inkjet printed (bio)chemical sensing devices. Analytical and Bioanalytical Chemistry, 405(17), pp. 5785–5805. https://doi.org/10.1007/s00216-013-7013-z.
Labuza, T.P. and Labuza P.S., 2004. Influence of temperature and relative humidity on the physical states of cotton candy.
Journal of Food Processing and Preservation, 28(4), pp. 274–287. https://doi.org/10.1111/j.1745-4549.2004.24041.x.
Leinen, K.M. and Labuza, T.P., 2006. Crystallization inhibition of an amorphous sucrose system using raffinose. Journal of Zhejiang University – Science B, 7(2), pp. 85–89. https://doi.org/10.1631/jzus.2006.B0085.
Petryayeva, E. and Krull, U.J., 2011. Localized surface plasmon resonance: nanostructures, bioassays
and biosensing—a review. Analytica Chimica Acta, 706(1), pp. 8–24. https://doi.org/10.1016/j.aca.2011.08.020.
Rech, H., 2000. Druckverfahren: Übersicht zu den Druckverfahren. In: H. Kipphan, ed. Handbuch der Printmedien:
Technologien und Produktionsverfahren. Berlin, Germany: Springer, pp. 41–42.
Shi, H., Zhao, G., Liu, M., Fan, L. and Cao, T., 2013. Aptamer-based colorimetric sensing of acetamiprid in soil samples:
sensitivity, selectivity and mechanism. Journal of Hazardous Materials, 260, pp. 754–761.
https://doi.org/10.1016/j.jhazmat.2013.06.031.
Song, K.-M., Cho, M., Jo, H., Min, K., Jeon, S.H., Kim, T., Han, M.S., Ku, J.K. and Ban, C., 2011. Gold nanoparticle-based colorimetric detection of kanamycin using a DNA aptamer. Analytical Biochemistry, 415(2), pp. 175–181.
https://doi.org/10.1016/j.ab.2011.04.007.
Stamm, J., Spiehl, D., Jaeger, J., Groher, F., Meckel, T., Suess, B. and Dörsam, E., 2019. A test system for the printing of functional nucleic acids onto different carriers and verification of its functionality by DNA dyes. Journal of Print and Media Technology Research, 8(1), pp. 7–17. https://doi.org/10.14622/JPMTR-1821.
Thévenot, D.R., Toth, K., Durst, R.A. and Wilson, G.S., 2001. Electrochemical biosensors: recommended definitions and classification. Biosensors and Bioelectronics, 16(1–2), pp. 121–131. https://doi.org/10.1016/S0956-5663(01)00115-4.
Wegener, H.C., 2003. Antibiotics in animal feed and their role in resistance development. Current Opinion in Microbiology, 6(5), pp. 439–445. https://doi.org/10.1016/j.mib.2003.09.009.
Wei, H., Li, B., Li, J., Wang, E. and Dong, S., 2007. Simple and sensitive aptamer-based colorimetric sensing of protein using unmodified gold nanoparticle probes. Chemical Communications, (36), 3735–3737.
https://doi.org/10.1039/B707642H.
Zhao, W., Brook, M.A. and Li, Y., 2008. Design of gold nanoparticle-based colorimetric biosensing assays. ChemBioChem, 9(15), pp. 2363–2371. https://doi.org/10.1002/cbic.200800282.
Zhao, W., Ali, M.M., Aguirre, S.D., Brook, M.A. and Li, Y., 2008. Paper-based bioassays using gold nanoparticle colorimetric probes. Analytical Chemistry, 80(22), pp. 8431–8437. https://doi.org/10.1021/ac801008q.
Zheng, Y., Wang, Y. and Yang, X., 2011. Aptamer-based colorimetric biosensing of dopamine using unmodified gold nanoparticles. Sensors and Actuators B: Chemical, 156(1), pp. 95–99. https://doi.org/10.1016/j.snb.2011.03.077.
Zhong, Z., Patskovskyy, S., Bouvrette, P., Luong, J.H.T. and Gedanken, A., 2004. The surface chemistry of Au colloids and their interactions with functional amino acids. The Journal of Physical Chemistry B, 108(13), pp. 4046–4052.
https://doi.org/10.1021/jp037056a.