Assessing the tax performance of developing countries
Christian von Haldenwang Maksym Ivanyna
Bonn 2010
Discussion Paper / Deutsches Institut für Entwicklungspolitik ISSN 1860-0441
Die deutsche Nationalbibliothek verzeichnet diese Publikation in der Deutschen Nationalbibliografie;
detaillierte bibliografische Daten sind im Internet über http://dnb.d-nb.de abrufbar.
The Deutsche Nationalbibliothek lists this publication in the Deutsche Nationalbibliografie; detailed bibliographic data is available in the Internet at http://dnb.d-nb.de.
ISBN 978-3-88985-528-2
Dr. Christian von Haldenwang, Deutsches Institut für Entwicklungspolitik, Senior Researcher, Department III: Governance, Statehood, Security.
E-Mail: Christian.vonHaldenwang@die-gdi.de Dr. Maksym Ivanyna, Michigan State University E-Mail: ivanynam@msu.edu
© Deutsches Institut für Entwicklungspolitik gGmbH Tulpenfeld 6, 53113 Bonn
℡ +49 (0)228 94927-0 +49 (0)228 94927-130 E-mail: die@die-gdi.de http://www.die-gdi.de
Acknowledgements
This paper is the outcome of a research project undertaken by the German Development Institute / Deutsches Institut für Entwicklungspolitik (DIE) and co-financed by the Kredit- anstalt für Wiederaufbau (KfW). We would like to thank KfW, and specifically Carmen Schickinger of the KfW Governance Centre, for supporting the project.
At the DIE, Jörg Faust, Stefan Leiderer, Melody García and Sebastian Ziaja have provided valuable advice at various stages of the project. We would also like to thank Philipp Krause (London School of Economics and Political Science, LSE) for participating in the formulation of the basic arguments which we discuss in detail in the present paper, and Giulia Mascagni (University of Sussex) and Hyun-Ju Koh (Deutsche Gesellschaft für Technische Zusammenarbeit – GTZ, Eschborn) for their helpful comments. Finally, we gratefully acknowledge the excellent work of Gertrud Frankenreiter in the administration of the project, Gisela Kuhlmann in assisting with the publication and Rodney Sayer in proof-reading the document.
Contents
Abbreviations
Executive Summary 1
1 Introduction 5
2 Assessing tax performance – concepts and data 7
2.1 The analytical narrative 7
2.2 The data challenge 9
3 Results of the analysis 12
3.1 Classification of countries 12
3.2 Robustness checks and specifications 15
3.3 Tax performance: changes over time 18
3.4 Tax performance: some stylised facts 23
3.5 Alternative sources of revenue 27
3.6 Governance levels 27
4 Conclusion 33
Bibliography 35
Annex 37
Table 13: All countries, distance from the trend line 39
Table 14: ISO country codes 40
Figures and Tables
Figure 1: Relation between tax ratio and log GDP per capita 12
Figure 2: Tax performance in the world 15
Figure 3: Relationship between tax ratio and log GDP per capita, 1997–99
and 2001–03 21
Figure 4: Groups of tax performers, stylised facts 24
Figure 5: Low tax performers relative to the world average: Governance scores 30
Figure 6: Low tax performers by categories 32
Table 1: Tax ratio and log GDP per capita – descriptive statistics 11 Table 2: Tax ratio and log GDP per capita – regressions 13
Table 3: Low and high tax performers 14
Table 4: Tax ratio and log GDP per capita – alternative specifications 16 Table 5: Tax ratio and log GDP per capita – poor vs rich countries 18
Table 6: Tax revenue data patterns by year 19
Table 7: Tax ratio and log GDP per capita – testing for sample selection 20 Table 8: Tax ratio and log GDP per capita – 1997–99 and 2001–03 20 Table 9: Tax performance progress matrix: 1997–99 and 2001–03 vs 2007–08 22 Table 10: Low tax performers vs the rest of the world: regressions 25 Table 11: Low tax performers: General information and public finance 26 Table 12: Low tax performers: Governance, size, special circumstances 29
Abbreviations
AfDB African Development Bank AsDB Asian Development Bank
CG Central Government
ColTax Collecting Taxes Database
CPIA Country Policy and Institutional Assessment (World Bank)
DIE Deutsches Institut für Entwicklungspolitik (German Development Institute) ECLAC UN Economic Commission for Latin America and the Caribbean
GDP Gross Domestic Product
GE Government Effectiveness (WGI) GFS Government Finance Statistics (IMF)
GG General Government
IMF International Monetary Fund
KfW Kreditanstalt für Wiederaufbau
LSE London School of Economics and Political Science MENA Middle East / North Africa
ODA Official Development Assistance
OECD Organisation for Economic Co-operation and Development OLS Ordinary Least Squares
PEFA Public Expenditure and Financial Accountability PPP Purchasing Power Parity
SNG Subnational Government TPA Tax Performance Assessment
USAID United States Agency for International Development VAT Value Added Tax
V&A Voice and Accountability (WGI) WDI World Development Indicators WGI World Governance Indicators
Executive Summary
Some countries fail to ensure that their citizens and businesses make an appropriate contri- bution to the financing of public tasks. But not all countries with a low tax ratio automati- cally fall into this category. As a first observation, there is a well established positive rela- tionship between a country’s ability to collect taxes and its development level. Hence, it does not make much sense to assess a low-income country’s tax effort by comparing it to the levels of the Organisation for Economic Co-operation and Development (OECD) or to certain absolute values. Governments, donors and international organisations need to be able to judge the performance of tax systems in a broader context of development, govern- ance and international cooperation.
The tax performance assessment (TPA) introduced in this paper seeks to give a comparative overview of the tax performance of developing countries, based on aggregate data and country-specific information. This should put governments, donors and international or- ganisations in a better position to decide on tax reform programmes and aid modalities. The analysis proceeds as follows:
— First, the TPA relates the 2007-08 tax ratio (tax revenue as a percentage of the Gross Domestic Product – GDP) of a large number of countries to their GDP per capita. It es- tablishes a trend (or regression) line and determines the distance of each country from this line. According to their relative position, countries are then grouped into three broad categories: average tax performers, high tax performers and low tax performers.
— Second, the exercise is repeated for two additional observation periods, 1997-99 and 2001–03 (roughly ten and five years from 2007–08), to identify countries changing categories over time.
— Third, we assume that governments with “easy” access to alternative sources of finance do not have a strong incentive to engage in cumbersome domestic tax collection. The TPA therefore looks at non-tax revenue in general and grants of Official Development Assistance (ODA) in particular.
— Fourth, we analyse the governance of countries with a low tax performance in order to distinguish between those states that collect few taxes because societies want to have a low tax ratio and those cases where other aspects may be more important than the po- litical will of the citizens.
Empirical findings
For the observation period 2007–08 we gathered data on a total of 177 countries. Of these, 36 qualify as high tax performers, whereas 41 fall in the low tax performing group. The remaining 100 countries are considered average performers. The results of our analysis en- able us to discern some regional patterns:
— Many Latin American and Caribbean countries find themselves below the trend line.
The only high tax performers in this region are Brazil and Guyana.
— Another part of the world where low tax performance clearly prevails is South and Southeast Asia. Here, high tax performers are virtually absent.
— Africa presents some mixed results, several countries falling into the high tax perform- ance category, while others count as low tax performers.
— Finally, high tax performers predominate in Western Europe and in many formerly socialist states of Eastern Europe and the former Soviet Union.
Christian von Haldenwang / Maksym Ivanyna
For the observation periods 1997–99 and 2001–03 we gathered data on 158 cases. A total of 53 countries changed categories between 1997–99 and 2007–08. Of these, 32 registered a downward trend, while 21 improved their relative position. Again, some regional patterns emerge:
— Many South and Southeast Asian countries moved to the low tax performers’ group.
An important exception is China, which changed from low to average performance.
— In a similar fashion, nine sub-Saharan African countries moved to lower categories, with only Liberia changing from average to high performance.
— In other regions, the picture is more ambiguous. In Latin America and the Caribbean, for instance, three countries fell from average to low tax performance, while another three countries changed from low to average and one country (Brazil) from average to high performance.
Alternative sources of revenue: Non-tax revenue is higher for low tax performers in all income groups, but total revenues and total expenditures are lower. This means that the lack of tax revenue is only partly offset by alternative sources of financing.
As regards other sources of financing, it appears that low tax performers do not receive much foreign aid (ODA grants); nor do they have much access to external borrowing. More than half of them (23 countries) finance less than 1 per cent of GDP with ODA grants, whereas the world average stands at 6.7 per cent. Only six of the 41 low tax performers score higher than the world average in terms of ODA grants. In contrast, low-income high tax performers clearly receive more aid and more loans from the international community.
Governance: The size of the public sector and the quality and quantity of public services may be the outcome of choice by a society. If a country is governed in a democratic and transparent manner, there is no reason to talk about revenue mobilisation problems, even if the country has a low tax ratio. However, the combined picture produced by the Polity IV democracy index and the World Governance Indicators (WGI) Voice and Accountability Index suggests that low tax performing countries are less democratic, regardless of income group. There are only four low tax performers with a positive rating in both indices: Pa- nama, India, the Dominican Republic and Timor-Leste.
It can also be deduced from the WGI Government Effectiveness index that only a few low tax performers have a public sector capable of implementing public policies in an orderly and transparent way. Thirteen of 40 countries (there are no data on Palau) achieve scores above the world mean. Among these are several small high-income countries as well as some rather non-democratic or blatantly authoritarian states such as Singapore and Kuwait.
Two countries, Colombia and the Philippines, qualify as “democracies” in the Polity IV index and are rated above the Government Effectiveness mean, but register below-average scores in the Voice and Accountability Index. They could be considered borderline cases.
Hence, there are just two countries (Panama and India) with positive scores in all three in- dicator sets. In fact, of the lower-middle-income and low-income countries with low tax performance, India alone has high governance rankings, and it would most probably be among the average tax performers if its revenue data included subnational governments.
Finally, we consider whether countries face circumstances that may inhibit tax collection regardless of the government’s political will. In particular, we look at the number of battle- related deaths as a proxy for civil unrest or war in a country; and at the number of displaced persons as a proxy for major humanitarian catastrophes (e. g. natural disasters or violent conflicts). In general terms, low tax performers have a higher death toll in armed conflicts and a larger number of displaced persons. This is especially true of the lower-middle- income and low-income groups, indicating that low tax performance may also be related to special circumstances.
To summarise the findings, we can identify three relatively distinct groups of low tax performing countries:
— a first group consisting of nine states with high non-tax revenue, low ODA grants and, in most cases, low governance ratings;
— a second group composed of six countries with high levels of governance and small public sectors. Three other countries with medium levels of governance and a small government can also be ascribed to this group;
— a third group of 22 countries that generally have low non-tax revenue, low levels of governance and, in most cases, relatively high levels of ODA or external borrowing.
The reasons for the low tax performance of the first two groups are relatively clear: the first has no strong incentive to engage in tax collection (because of its high non-tax revenue), and the second has no preference for collecting much in the way of taxes (as indicated by high to medium governance levels). The reasons for low levels of tax collection in the third group are less apparent and probably more diverse. Lack of capacity (ineffective tax ad- ministration) or tax effort (for instance, resistance to tax policy reform, high levels of “per- mitted” tax evasion) could be possible explanations.
This is consistent with the finding that 16 of the 22 countries in the third group were aver- age tax performers ten years ago. Most are Asian or sub-Saharan African countries. In a period of growth and expanding public revenues worldwide, it appears that these states were in a weak position to improve their fiscal standing in line with the rest of the world.
To sum up, states with a relatively low or diminishing tax performance in our analysis do not automatically qualify as “bad” or “defective” cases. It is possible that their tax ratio is low because they enjoy access to alternative sources of finance, or because societies have chosen to limit the range of state action. Besides this, tax performance may be shaped by specific conditions or other factors, such as natural disasters and violent conflicts.
Development policy should consider these findings on a case-by-case basis. It must not focus solely on the tax ratio, but consider a partner country’s tax system as a whole, in a broader governance context. However, the results presented above seem to indicate that regional patterns may play a role in at least some parts of the world. This lends additional weight to those initiatives which raise the issue of domestic revenue mobilisation on a mul- tilateral level.
Christian von Haldenwang / Maksym Ivanyna
In the context of bilateral development cooperation, states with persistently and signifi- cantly low tax ratios should be encouraged to be more active in fiscal terms and to step up revenue collection. For those countries with low governance levels, this goes beyond ex- pressions of political will on the part of ruling elites. Among other issues, governments and donors need to address the following questions:
— Is there a record of (failed) attempts to improve tax collection? Is there a consensus among political actors with regard to the causes of success or failure?
— How has external intervention influenced the tax regime in the past? For instance, pres- sure to liberalise the economy may have eroded revenues from trade taxes.
— Who loses and who benefits from tax reform? What are the incentives for change?
More reliable data for large numbers of countries would be necessary if this type of analysis was to be expanded to include, for instance, subnational revenues and the characteristics of tax administration. Even today, however, development policy can find support in a number of general indicators or approaches presented in this paper.
1 Introduction
Countries with a low tax yield or lax enforcement of tax laws are running out of time.
Such international players as the Organisation for Economic Co-operation and Develop- ment (OECD), the World Bank and the G20 are calling for more determined action to combat tax evasion and avoidance. With the world still fighting the effects of the global financial and economic crisis, there is growing pressure on tax havens to increase the transparency of their tax systems and put an end to unfair competitive practices. Develop- ing countries, too, are being urged to do more to mobilise domestic resources rather than rely on a constant inflow of official development assistance (ODA) funds.1
Some countries clearly fail to ensure that their citizens and businesses make an appropriate contribution to the financing of public tasks. In such cases there are a number of reasons for changing the development portfolio, reducing ODA or even stopping cooperation alto- gether (von Haldenwang / Krause 2009). But not all countries with a low tax ratio auto- matically fall into this category. Governments, donors and international organisations need to be able to assess the performance of tax systems in a broader context of development, governance and international cooperation.
Surprisingly, there is at present no such comprehensive and comparative approach to the tax system performance of developing countries, although several donors and international organisations are gathering data on tax revenues, the composition of tax systems and the quality of tax policy and administration.2 Most developing countries are the subject of at least some country-specific information on tax systems and revenues. At the same time, there is a growing body of macro-quantitative research on the relationship between tax systems or tax revenues and foreign rents (including ODA flows), per capita GDP and other variables.3
However, hardly any tools exist for comparing the tax systems of individual countries, linking tax performance to other factors of political and socio-economic development. Nor is much information available on the evolution of tax systems over time. Generally speak- ing, much of the in-depth information available is not truly comparative,4 and much of the comparative information available is not truly in-depth.
1 According to the 2005 United Nations Millennium Project report “Investing in Development,” low- income countries should raise their domestic revenues by an additional 4 per cent of GDP by 2015. Si- milarly, the 2008 Doha Declaration on Financing for Development includes a pledge to “enhance tax re- venues through modernized tax systems, more efficient tax collection, broadening the tax base and ef- fectively combating tax evasion.” See also OECD (2010); EC (2010).
2 The most important providers of this kind of information are the OECD (reports and databases, espe- cially on sub-Saharan Africa), the World Bank’s Country Policy and Institutional Assessments (CPIAs) and Doing Business Reports, the European Commission’s Fiscal Blueprints, the Public Expenditure and Financial Accountability (PEFA) Reports and the Collecting Taxes database funded by the United States Agency for International Development (USAID).
3 For recent contributions to these debates, see Carter (2010); Hart (2010); Aizenman / Jinjarak (2009);
Morrison (2009); Fuest / Riedel (2009); Besley / Persson (2009); Knack (2008); Gambaro / Meyer- Spasche / Rahman (2007); Gupta (2007).
4 It could be argued that PEFA and CPIA scores do lend themselves to (within-country or cross-country) comparisons. De Renzio (2009) and PEFA Secretariat (2009) discuss this issue with regard to PEFA scores.
Christian von Haldenwang / Maksym Ivanyna
As a result, governments and donors usually approach the issue of tax reform in develop- ing countries on a strict case-by-case basis. Tax-related criteria of donor programmes or new aid modalities are defined without the potential of available comparative data being fully tapped. Typically, the tax ratio (tax revenue as a percentage of GDP) in developing countries is assessed by comparing it to certain absolute threshold values, regional aver- ages or OECD tax ratios. None of these procedures, however, appears to be convincing, as they do not take any account at all of the conditions and development levels of individual countries.
Against this background, more elaborate approaches seek to measure the tax effort by tak- ing account of specific country characteristics, such as per capita income, the trade / GDP ratio or the relative size of the agricultural sector.5 These variables, however, may also be subject to change. For instance, Aizenman / Jinjarak (2009) find evidence that trade liber- alisation brought upon developing countries in the course of globalisation has led to a shift from “easy-to-collect taxes” (tariffs, seigniorage) to “hard-to-collect taxes” (Value Added Tax – VAT, income taxes). Poor countries, which are usually more dependent on tariffs, often find it difficult to compensate for shrinking revenues after tariff cuts. This is espe- cially true of countries where institutional quality is low.
The tax performance assessment (TPA) introduced in the following sections relates tax ratios to development levels (proxied by per capita income) as the first step of the analy- sis. In subsequent steps it seeks to give a comparative overview of the tax performance of developing countries, based on aggregate and country-specific information. This should put governments, donors and international organisations in a better position to decide on tax reform programmes and aid modalities.
The TPA relates observed values to cross-country trends instead of comparing them with predicted values (“tax capacity”) on a case-by-case basis. This approach is adopted be- cause of the difficulty of determining the “real” tax capacity of individual states. The ca- pacity of states to collect taxes is affected not only by economic variables, but by many other political, social and geographical factors. Low “tax effort” (in the specific sense in- troduced above) may not be the only reason for low tax revenue. Rather than focusing on aggregate results, the TPA also seeks to give easy-to-access information on individual countries or groups of countries. Because of this focus, additional efforts have been de- voted to data collection.
The TPA does not discuss the composition of tax systems or the quality of specific taxes.
Many African countries, for example, have a rather high tax ratio, largely because they receive a major share of their revenues from trade taxes, which are said to be particularly
“distorting” owing to their small tax base. However, we cannot gauge the developmental effect of these tax revenues by looking at market distortions alone: we also need to con- sider how tax revenues are spent, what form the incentive structure for the private sector takes and so on.
5 See OECD / AfDB / UNECA (2010, 94–96) for data on the tax effort of 42 African countries; Piancas- telli (2001) for a sample of 75 countries; Teera / Hudson (2004) for a sample of 120 countries; Gambaro / Meyer-Spasche / Rahman (2007) for a sample of 65 aid-recipient countries.
The following section summarises the underlying analytical narrative of the TPA and dis- cusses the problem of data quality and accessibility. Section 3 presents the findings of our analysis. The concluding section, Section 4, summarises the results and addresses the question of how development cooperation partners should handle the findings presented in this paper.
2 Assessing tax performance – concepts and data 2.1 The analytical narrative
State capacity includes the capacity to collect taxes. States with low per capita income do not, as a rule, meet the administrative and institutional requirements for a tax system at OECD level. Public expenditure, on the other hand, rises with higher development levels, generating pressure to mobilise revenue.6 An appropriate appraisal of a state’s efforts to tax its citizens must therefore take its level of development into account. A positive rela- tionship between tax ratio and per capita GDP (as a proxy for development) has been demonstrated in the literature since the 1960s (Musgrave 1969; Chelliah 1971; Tanzi 1992; Piancastelli 2001; Teera / Hudson 2004; Gambaro / Meyer-Spasche / Rahman 2007).
Hence, the first assumption made in this paper is that the capacity of the government of country X to raise tax revenue increases with that country’s development level:
ri = α + β log gi + εi, i = 1,N, (1)
where ri is total tax revenue as a share of GDP in country i, gi is the GDP per capita in country i, and εi is the residual, which includes all the other factors affecting ri.
This assumption does not establish a causal relationship between tax ratio and develop- ment level. It shows, however, that there is little sense in assessing a low-income coun- try’s tax effort by comparing it to OECD levels or to certain absolute values. At the same time, linking tax revenue to development levels leads to more realistic expectations con- cerning changes in tax revenue. Drastic alterations from one year to another are typically the outcome of external shocks, or the product of data corruption and misreporting.
The TPA relates the tax ratios of a large number of countries to their logged GDP per cap- ita. It establishes a trend line and determines the distance of each country from this line.
According to their position relative to the trend line, countries are then grouped into three categories: average tax performers, high tax performers and low tax performers. Grouping countries into these broad categories gives us a first idea of how they fare in terms of tax collection at a given point in time. By choosing 2007/08 as the most recent observation period, we cover the years before the outbreak of the world economic crisis, with its rather distorting impacts on the public finances of many developing and developed countries. We are also able to gather data for a large group of countries.7
6 This tendency is known as “Wagner’s Law”, see Musgrave (1969, 73–75); de Ferranti et al. (2004, 250).
7 For each of the 177 countries of our sample, data from 2007 and 2008 were averaged and then compiled into one series. For ten countries (Anguilla, Antigua and Barbuda, Barbados, Dominica, Gabon, Sao
Christian von Haldenwang / Maksym Ivanyna
Besides gaining an impression of recent tax performance, we want to know how tax per- formance changes over time. For instance, it could be that a country is still below the trend line, although it has increased its tax ratio in recent years. Only long-term observation will provide information on the fiscal development of a country or group of countries. We build two additional series for the periods 1997–99 and 2001–03 (roughly ten and five years from 2007/08). As governments, donors and international institutions are likely to be especially interested in countries with a persistently low, or even diminishing, tax per- formance, we take a closer look at these two groups in our analysis.
The second assumption guiding our analysis concerns the relationship between tax and non-tax revenue. The tax effort approaches mentioned above identify additional factors that influence the tax ratio. The TPA follows this approach in that it assumes that govern- ments with “easy” access to alternative sources of finance do not have a strong incentive to engage in cumbersome domestic tax collection.
We consider non-tax revenue in general and ODA grants in particular. On the one hand, exporters of non-renewable energy sources (oil, gas) and minerals (copper, gold) may not have to achieve high tax ratios in order to finance public services. A state that receives substantial rents from oil or gas exports will feel little inclination to resort to the laborious business of depriving its citizens of some of their income when it can finance its essential functions as things are. The best example of this is the Persian Gulf states, some of which maintain single-digit tax ratios despite having medium to high per capita incomes.
On the other hand, states heavily dependent on ODA grants may be tempted to refrain from additional domestic revenue mobilisation – unless ODA conditions (such as co- financing schemes or tax collection targets) change the incentive structure, or longer-term political perspectives lead governments actively to seek independence from ODA inflows.
There is a growing body of research on these issues, but findings are still inconclusive (Carter 2010).
The third assumption concerns the governance dimension of revenue mobilisation. A low tax yield is not always the outcome of some kind of error or defective governance.
Different societies have different views on what states should do and how much they should cost. Of the OECD member countries, the USA and Japan stand out as having a rather low tax yield, whereas the Nordic countries are famous for their high tax ratio. Nei- ther does our trend line necessarily represent the “golden middle” between under- and overtaxation, nor does every society aspire to become another Sweden or Denmark.
Consequently, we should distinguish between states that collect few taxes because citizens want to have a low tax ratio and those where other aspects may be more important than the political will of the citizens. Factors such as democratic participation, free and fair elec- tions and regime stability determine the capacity of societies to reach political decisions based on the common interest, while such factors as administrative capacity, level of cor- ruption and rule of law determine the capacity of public administrations to implement these policies.
Societies with low levels of governance are typically not in a position to choose and im- plement a tax system from a common interest perspective. Hence, in cases where low tax performance coincides with low levels of governance we find it hard to believe that the tax
Tome and Principe, Qatar, United Arab Emirates, West Bank and Gaza, Zimbabwe), one of the two ob- servations was missing. In these cases we took the remaining one.
ratio is the product of transparent, democratic decision-making and capable public admini- stration. Rather, we would assume that in these cases some powerful groups are imposing a tax system according to their particular interests – or that they are successfully obstruct- ing tax reform initiatives. In addition, we consider it easier in political terms to have a low tax ratio than a high one. We therefore assume lower levels of governance to be more conducive to lower tax ratios.
To summarise, states with a relatively low or diminishing tax performance in our analysis do not automatically qualify as “bad” or “defective” cases. It is possible that their tax ratio is low because they enjoy “easy” access to alternative sources of finance, or because so- cieties have chosen to limit the range of state action. Besides this, tax performance may be shaped by specific conditions, such as natural disasters or violent conflicts (Everest- Phillips 2010, 76). Against this background, the TPA should not be seen as a single ana- lytical tool. Rather, it is designed to put country-specific information in a broader context and to sharpen the comparative focus of aggregate analysis.
2.2 The data challenge
Gathering data on actual tax revenue collection in developing countries is still quite a dif- ficult task. For one thing, the informal sector accounts for a significant part of the eco- nomic activity of many developing countries (Olken / Singhal 2009). This may lead to effective tax rates and the tax ratio being overstated (Aizenman / Jinjarak 2009, 668).
Some states do not report GDP or revenue data at all. Various states have changed to ac- crual accounting, while many others still rely on cash accounting (though this difference is less relevant to revenue than to expenditure). Furthermore, data series often use different definitions of governments or different classifications of revenues – sometimes simultane- ously and without prior explanation.
Levels of government: From the International Monetary Fund’s Government Finance Statistics (IMF GFS), the standard source of information on public finances in developing countries, we take general government (GG) as the broadest category in terms of revenue statistics. It comprises central government (CG), state and local governments, social secu- rity funds and non-market non-profit institutions. However, quite a few countries (espe- cially developing countries) report data only on CG (sometimes including social security funds), not on GG. As a result, most research papers that consider developing countries use CG data (see, for example, Teera / Hudson 2004; Gambaro / Meyer-Spasche / Rahman 2007).
For our purposes, however, this would not be appropriate, since we want to take account of all government revenues in as many countries as possible. Subnational levels are impor- tant tax collectors in some countries, especially in the higher-income group, although in most of the low- or lower-middle-income countries they play only a minor role: in 2008, the mean difference between GG and CG tax revenue among lower-middle-income coun- tries was 1.31 per cent of GDP (in those 19 countries that report both data in IMF GFS), while in higher-income countries it was 5.76 per cent (27 countries). Thus, relying solely
Christian von Haldenwang / Maksym Ivanyna
on CG data would tilt our findings substantially “in favour” of the lower-income countries in our sample.8
Classification of revenues: The GFS distinguish four kinds of general government reve- nue: taxes, social contributions, grants and other revenues. “Grants” refer to grants from international organisations or governments of third countries. “Other revenues” refer to property income, sales of goods and services, fines, voluntary transfers and others. The lines between categories may be somewhat blurred, as countries interpret them differently.
For instance, some countries (such as Australia) do not report social security contribu- tions, since they treat them as taxes. Another challenge arises from differences in the treatment of revenues from extractive industries, which may appear as “taxes” in some cases and as “other revenues” in others.
Against this background we opt for a broad view of “tax revenue,” taking it to cover taxes and social contributions. Again, omitting one of these sources would distort the overall picture of tax revenue. Social security contributions are hardly a relevant source of reve- nue in low-income countries, but it is obvious that social security is considered a public task in most countries with higher tax ratios. In Germany, for example, more than EUR 80 billion is transferred from the government budget to the public pension system each year.
Omitting these revenues from our calculations would therefore not be justified.9
Data sources: For GDP per capita, we take data from the World Development Indicators.
We consider GDP per capita in constant 2000 US dollars and GDP per capita in constant 2005 Purchasing Power Parity units (PPP). Both variables produce similar results (see Table 1 below). We consider constant 2000 US dollars to be more appropriate for our analysis, because (i) it is a more “neutral” indicator of levels of development (differences between constant US dollars and PPP already take account of differences in development levels due, for instance, to cheaper services in developing countries), (ii) the sample is slightly larger (177 compared to 174 countries) and (iii) the indicator appears to be more transparent, as determining PPP is in itself a complex operation and subject to debate.
For tax revenues, we take data from the following sources (ranked according to priority):
(i) OECD, (ii) Eurostat, (iii) UN Economic Commission for Latin America and the Carib- bean (ECLAC, or CEPAL for its Spanish name), (iv) IMF GFS GG, (v) IMF GFS CG, (vi) individual country data from IMF “Article IV consultation” and “selected issues” re- ports (for observation periods 1997–99 and 2001–03), (vii) Asian Development Bank, (viii) Collecting Taxes database. In the last two sources, the definition of tax revenue is often unclear. We found various cases where GG and CG data were used side by side, or where social contributions were treated incoherently.
8 Of course, including GG data for only a part of our sample (and CG data for the rest) also produces biased results, albeit on a much smaller scale. In our analysis we check for such bias by adjusting the tax revenue of those countries that report only CG with local tax revenue estimates, using data from Ivany- na / Shah (2010). See section 3.2 of this report.
9 To check for sample bias, we also consider tax revenue without social contributions. We find that the slope of the trend line changes, but there are few changes with regard to our three categories. See section 3.2 for more details.
Consequently, there are 189 countries in our sample for the construction of the trend line (see Table 1). GDP per capita is available for only 177 of these countries, but the missing data mostly concern small countries and territories in the Pacific Ocean and the Caribbean.
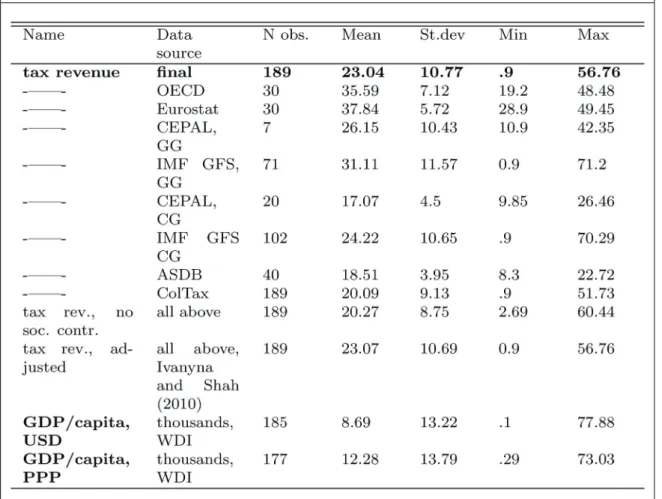
Table 1: Tax ratio and log GDP per capita – descriptive statistics
Note Abbreviations: GG – general government; CG – central government; OECD – Organisation for Eco- nomic Co-operation and Development; CEPAL/ECLAC – UN Economic Commission for Latin America and the Caribbean; IMF GFS – International Monetary Fund’s Government Finance Statistics; AsDB – Asian Development Bank; ColTax – Collecting Taxes. For all sources, tax revenue is for general govern- ment (unless otherwise specified), with social contributions included, average of 2007 and 2008, in per cent of GDP. AsDB and ColTax do not specify their definitions. GDP/capita, USD – GDP per capita in constant 2000 US dollars, thousands, average of 2007 and 2008. GDP/capita, PPP – GDP per capita in constant 2005 PPP units, thousands, average of 2007 and 2008.
Christian von Haldenwang / Maksym Ivanyna
3 Results of the analysis 3.1 Classification of countries
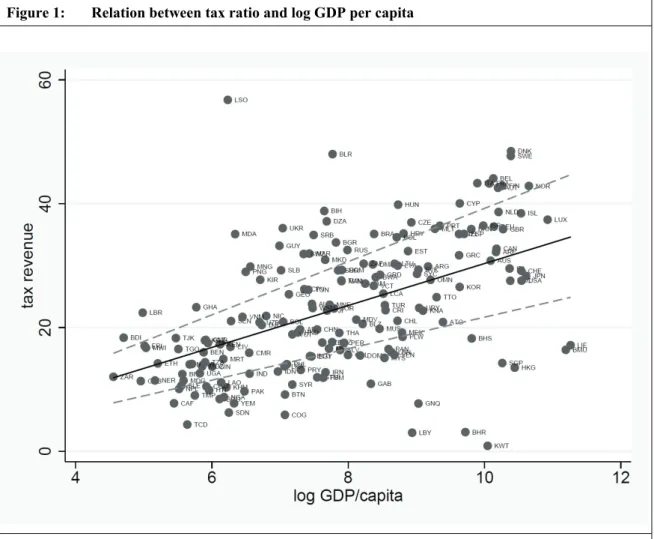
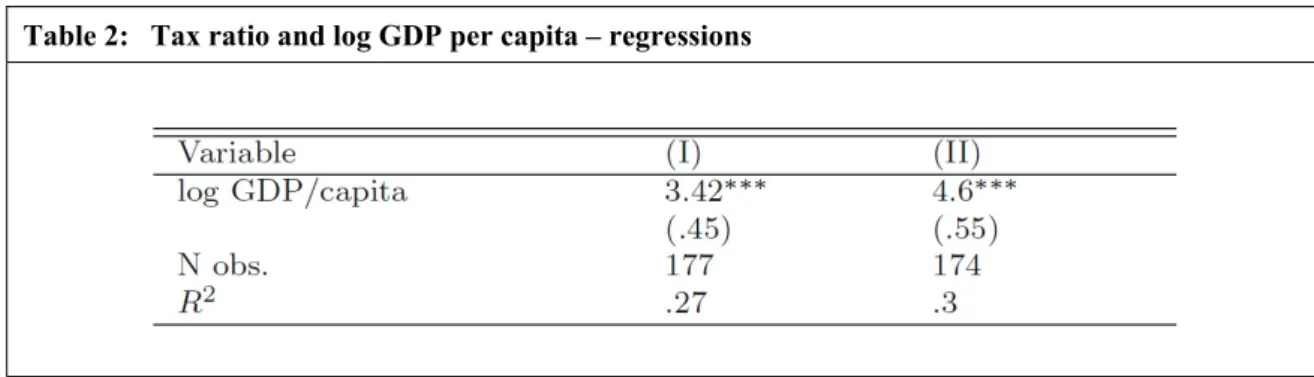
Figure 1 shows a scatter plot of tax ratio (tax revenue as per cent of GDP) versus log GDP per capita for 177 countries.10 Table 2 contains the results of the regression analysis. The relationship between tax ratio and log GDP per capita is statistically significant, even though the effect is rather small: in statistical terms, an increase of 10 per cent in log GDP per capita would increase the tax ratio by about 0.34 additional percentage points.
10 See Table 14 in the annex for a list of ISO country codes.
Figure 1: Relation between tax ratio and log GDP per capita
Note X-axis: tax revenue in per cent of GDP (= tax ratio), 2007/08. Y-axis: log GDP per capita in con- stant 2000 US dollars as of 2008. Data see Table 1. The solid black line is the trend line (fitted values).
The broken grey lines are the lower and upper boundaries of the 95 per cent confidence interval, i. e. there is a 95 per cent probability that the “real” trend line is located within the range marked by the broken lines. N=177.
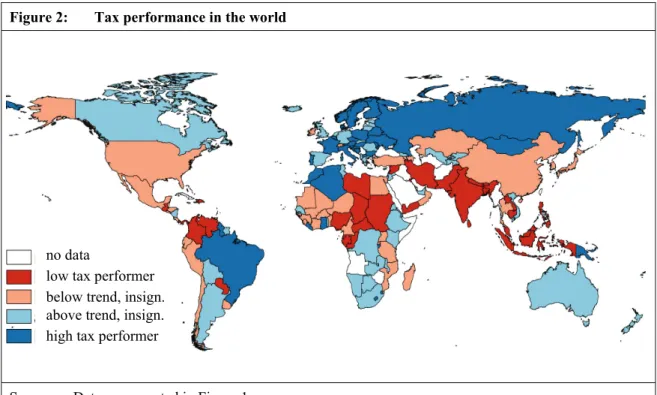
With the approach we have chosen, 36 of 177 countries qualify as high tax performers, whereas 41 countries fall into the low tax performing category. The remaining 100 coun- tries are average performers. Table 3 is a list of low and high tax performers,11 while Fig- ure 2 shows the results on a global map of tax performance.
We propose to call those countries whose tax ratio lies within the 95 per cent confidence interval of the trend (or regression) line (i) average tax performers,12 countries with a tax ratio above the 95 per cent confidence interval (ii) high tax performers and those with a tax ratio below the 95 per cent confidence interval (iii) low tax performers.13
The results of our analysis reveal some regional patterns. As can be seen from the map, many Latin America and Caribbean countries find themselves below the trend line, with Guatemala, Venezuela, Paraguay, Panama, the Dominican Republic and Colombia in the group of low tax performers. The only high tax performers in this region are Brazil and Guyana. Another part of the world where tax performance is particularly low is South and Southeast Asia. Bangladesh, Pakistan, Malaysia, Cambodia, Indonesia, Laos, Sri Lanka, India, Nepal and the Philippines are among the low performers. In this part of the world, high tax performers are virtually absent (Papua New Guinea and a few small island states are exceptions).
11 See Table 13 (Annex) for a list of all countries ranked according to their distance from the trend line.
12 In addition, average tax performers can be distinguished as a function of their location above (average- high) or below (average-low) the trend line.
13 There are, of course, other possible ways to set the boundaries, such as raising or lowering the confi- dence interval or defining absolute values (for instance, ± 5 per cent tax ratio). We consider the confi- dence interval a more appropriate measure than absolute values, because a specific variation in tax ratio means something different for countries with lower levels of tax revenue as against countries with higher levels. Low-income Burundi is therefore classified as a high tax performer with a tax ratio 6.01 per cent GDP above the trend line, whereas high-income Malta, 7.98 per cent distant from the trend line, is an average tax performer. See Figure 1, Table 13 (Annex). Furthermore, changing the confidence in- terval to, say, 90 per cent or 99 per cent would make our classification rather useless, since the vast ma- jority of countries would fall outside or in the average tax performer category.
Table 2: Tax ratio and log GDP per capita – regressions
Note *** – significant at 1 per cent level. Dependent variable: tax ratio as defined in Table 1. Right-hand side variable: column (I) – log GDP/capita, constant 2000 USD; column (II) – log GDP/capita, constant 2005 PPP – see definitions in Table 1. Estimation method: OLS. Standard errors are heteroscedasticity- robust.
Christian von Haldenwang / Maksym Ivanyna
Table 3: Low and high tax performers
Note Based on the estimation (I) from Table 2, res. less lb – residual from the regression less lower boundary of the 95 per cent confidence interval, res. less ub – residual from the regression less upper boundary of the 95 per cent confidence interval. The countries are sorted according to their distance from the lower (left column) or upper (right column) boundary of the 95 per cent confidence interval.
In contrast, Africa shows some mixed results, with countries such as Ghana, Burundi, Li- beria, Morocco and Algeria being among the high tax performers, while various Central African countries (such as Chad, Sudan, the Central African Republic and Nigeria) count as low tax performers. Finally, average-high and high tax performance predominate in Western Europe and in many formerly socialist states of Eastern Europe and the former Soviet Union. The most important high-income countries with tax ratios below the trend line (but still within the 95 per cent confidence interval) are the USA, Japan, Ireland and Switzerland.
3.2 Robustness checks and specifications
We performed several robustness checks and looked for alternative specifications of our main variables, GDP per capita and tax revenues (see Table 4). None of these exercises led to substantially different results.
Sensitivity to outliers: As Figure 1 and Table 3 show, Lesotho is an exceptional tax per- former, yet with a relatively low level of development. It derives 50 per cent of its tax revenues from the Southern Africa Customs Union, which may not be directly related to Lesotho’s own tax effort. Nonetheless, an outlier of this kind may skew the results of the whole regression. Similarly, the oil states Kuwait, Bahrain and Libya are clearly outliers in terms of low tax collection. We therefore repeated the analysis without Lesotho and the other three countries.The results of the two calculations are presented in columns (i) and (ii) of Table 4. In both cases there are only minor differences in the resulting lists, with four countries changing categories in the first exercise and seven countries in the second.
Figure 2: Tax performance in the world
Source: Data as presented in Figure 1.
no data
low tax performer below trend, insign.
above trend, insign.
high tax performer
Christian von Haldenwang / Maksym Ivanyna
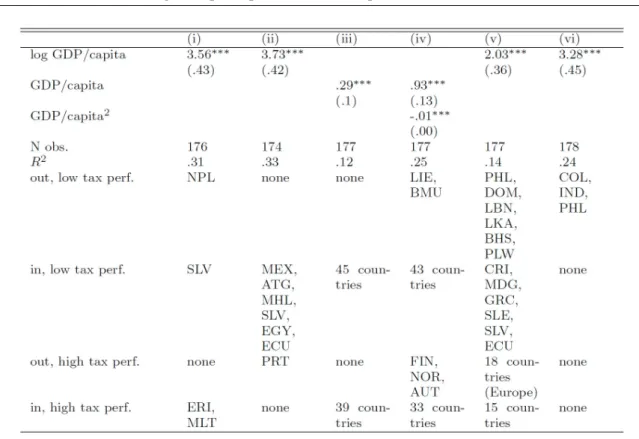
Alternative functional forms: In our main specification we take the logarithm of GDP per capita as a proxy for a country’s development. Alternatively, level data or GDP per capita squared (columns (iii) and (iv) of Table 4) can be used.14 All coefficients remain highly significant, even though the data explain less variation in tax revenue (R2 is higher when log GDP per capita is used). This results in much broader lists of low and high tax performing countries. Yet the “leaders” of the lists do not change compared to our main specification.
Alternative tax revenue measures: A broad definition of tax revenue was introduced above, covering general government information (where available) and including social security contributions. There are, however, alternative approaches: (i) a first option would be to use tax revenue without taking social contributions into account, while (ii) a second
14 We also ran several semiparametric spline-models to check for more complex non-linear relationships and found that our log-linear model fits the data best.
Table 4: Tax ratio and log GDP per capita – alternative specifications
Note Column (i): regression excluding Lesotho. Column (ii): regression excluding Kuwait, Bahrain, Libya. Column (iii): GDP/capita instead of log GDP/capita. Column (iv): GDP/capita squared. Column (v): tax ratio excluding social contributions. Column (vi): local tax revenue added for countries with only CG data. *** – significant at 1 per cent level. Dependent variable: columns (i), (ii), (iii), (iv) – tax ratio as defined in Table 1; column (v) – tax rev. no soc. contr., see Table 1 for definition; column (vi) – tax ratio, adjusted, see Table 1 for definition. GDP/capita is in constant 2000 USD, see definition in Table 1. Esti- mation method: all columns – OLS. Standard errors are heteroscedasticity-robust in all columns. In/out comparison is with the lists in Table 3.
option would consist in adjusting for local tax revenue in those countries which report only CG data (columns (v) and (vi) of Table 4).
(i) In the first case (excluding social contributions) the trend line becomes flatter, as ex- pected, since many high-income countries rely heavily on social contributions, whereas many developing countries do not report social contributions at all. As a result, many European countries drop out of the group of high tax performers, to be replaced by coun- tries with lesser reliance on (or different treatment of) social contributions (for example, Botswana, Namibia, Georgia, Iceland and Malta). At the same time, the list of low tax performing countries changes only slightly: the Philippines, the Dominican Republic, Lebanon, Sri Lanka, the Bahamas and Palau would move into the average performers group, whereas Costa Rica, Madagascar, Greece, Sierra Leone, El Salvador and Ecuador would join the low tax performers group.
(ii) The second alternative is to adjust the tax ratio for local tax revenue in the case of those countries that report only CG data. Non-reporting of GG data is clearly skewed to- wards lower income countries.15 But is the difference between CG and GG relevant to them?
— Data from Ivanyna / Shah (2010) reveal that, in 2005, the average subnational gov- ernment (SNG) expenditures of the countries that report GG data was 23.7 per cent of total expenditures (which are comparable to total revenue). For countries that report only CG data, the figure is 9.7 per cent, and for countries whose data we derive from AsDB or ColTax, it is 9.6 per cent.
— Subnational tax revenues are typically much lower than expenditures, especially in the case of the poorer countries. Ivanyna / Shah (2010) have estimated the vertical gap – the difference between a country’s SNG expenditures and own SNG revenues (ex- cluding intergovernmental transfers). According to these estimates, SNG in countries which report GG finance 56 per cent of their expenditures with own revenues. SNG in
“CG only” countries finance 57 per cent, and SNG in “AsDB and ColTax” countries finance 49 per cent.
— To give an example, the average tax revenue of “CG only” countries in our sample was 16.3 per cent of GDP in 2007/2008. If their presumed GG tax revenues were comparable to the GG expenditures reported by Ivanyna / Shah (2010), local govern- ment in an average “CG only” country would collect 9.7 per cent * 0.57 = 5.5 per cent of GG tax revenues. This means that, by using CG data, we are underestimating the actual GG tax revenue for an average “CG only” country by 16.3 per cent * 0.055 = 0.9 per cent. Even OECD and Eurostat data often differ by more than 0.9 per cent.
As expected, the results of the regression with the “adjusted” data are practically the same as in the main specification (even the point estimates are very close). Colombia and the Philippines change their position marginally (from “close to average” low tax performers to “close to low” average tax performers). Yet there is one major change: India makes a significant leap from the low to the average tax performing group: as a federal state, it has a much higher degree of fiscal decentralisation than other developing countries. However, since the data we use in this exercise stem from 2005 and earlier, and there is no direct
15 Of the 113 countries in the sample (excluding AsDB and ColTax sources), 35 report only CG data.
Higher-income countries: 2 of 37; upper-middle-income countries: 4 of 23; lower-middle- and lower- income countries: 29 of 53.
Christian von Haldenwang / Maksym Ivanyna
measure of local tax revenue for CG states, we do not use this adjustment in the main specification.
Different effects in different income groups: Is the relationship between tax ratio and level of development different in poorer countries from that in richer countries? To answer this question we split the sample in two: countries with lower GDP per capita (less than the median) and countries with higher GDP per capita (more than the median) (see Table 5). We find that the slope is flatter for richer countries (the point estimates are economi- cally different), which is not surprising, given that we use logged GDP. Yet the difference is not significant in statistical terms (at a 5 per cent significance level).
A second way of identifying non-linearities in the relationship between tax ratio and in- come is to regress the tax ratio on income group dummies as classified by the World Bank (see column (iii) of Table 5). The group of low-income countries is chosen as the baseline.
The biggest jump is from the low-income to the lower-middle-income group, after which the relationship flattens and then jumps again from upper-middle-income to high-income countries. This pattern supports our choice of log GDP per capita as a proxy for economic development (since it also assumes non-linearity between income and tax ratio of roughly the same kind).
3.3 Tax performance: changes over time
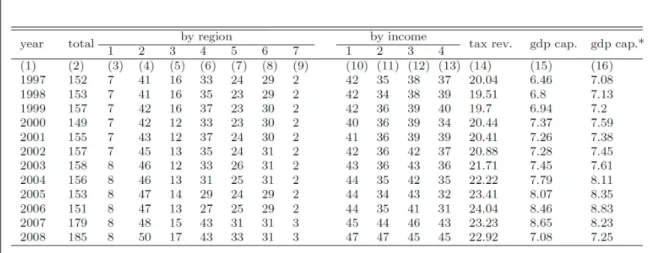
Also of interest to our paper are changes in tax performance over time. The sample in- cludes 1905 observations for tax revenue in the period 1997–2008. There is at least one non-missing observation in 193 countries, 10 being the average number of available time observations for a country. Most of the missing observations are in sub-Saharan African and small Caribbean countries. In general terms, data show that tax revenue is increasing slightly over time, in line with GDP per capita, which is consistent with our story (see Table 6).
Table 5: Tax ratio and log GDP per capita – poor vs rich countries
Note *** – significant at 1 per cent level. Dependent variable: tax ratio as defined in Table 1. Right-hand side variables: columns (i) and (ii) – log GDP/capita, USD; column (iii) – dummies for countries’ income groups as classified by the World Bank. Estimation method: OLS. Standard errors are heteroscedasticity- robust.
Poor countries are underrepresented in the sample in the earlier observation periods, as the higher figures in column (16) compared to column (15) reveal. This raises concerns about sample selection and the possibility of comparing the relative tax performance of a coun- try over time: If the samples of the previous observation periods were qualitatively differ- ent from 2007–08, a country’s change in position vis-à-vis the trend line could be due to sample selection rather than its own development (not even relative to the other countries).
However, the fact that the missing observations before 2007 mostly concern poor coun- tries does not necessarily mean that those countries are low tax performers. It is impossi- ble, of course, to test this directly (since the relevant data are the data that are missing), but there are some indirect checks (see Table 7). For instance, we checked for such vari- ables as lead selection indicator and the number of years that a country i reports tax reve- nue. We also reran the main regression for our 2007–08 sample, but excluded those coun- tries which did not report in 2006. Finally, we assumed that there was indeed a sample selection problem, and reformulated our main specification with only those countries that reported data in 1997–99 as well as in 2001–03 (158 countries, not shown in Table 7).
None of our tests produced results significantly different from our original argument, which means that there is no evidence of sample selection.
Table 6: Tax revenue data patterns by year
Note Columns 2–13 – number of observations for groups of countries. Column 14 – mean tax revenue as per cent of GDP. Column 15 – mean GDP/capita (thousands of constant 2000 US dollars) for all observa- tions. Column 16 – mean GDP/capita when tax revenue is available. Regions: 1– South Asia, 2 – Europe and Central Asia, 3 – Middle East and North Africa, 4 – Sub–Saharan Africa, 5 – Latin America and Caribbean, 6 – East Asia and Pacific, 7 – North America. Income groups: 1 – high income, 2 – upper middle income, 3 – lower middle income, 4 – low income. Countries are classified in accordance with the World Bank.
Souce: Data as presented in Table 1.
Christian von Haldenwang / Maksym Ivanyna
Table 8 contains the results from the regression analysis, and Figure 3 shows the scatter plots for 1997–99 and 2001–03. In both cases, the trend line is steeper than in 2007–08 (even though statistically the difference is small).
Table 9 summarises the changes of category for each period compared to 2007–08. As can be seen, a total of 53 countries changed categories between 1997–99 and 2007–08. Of these, 32 registered a downward trend, with 21 moving from average to low and 11 from high to average tax performance. In contrast, 21 countries improved their relative position, with 11 moving from low to average and another 10 from average to high tax perform- ance. Again, these changes do not necessarily imply an increased effort to collect taxes (or the lack of it) in each individual case. In the growth period from 2003 to 2008 in particu- lar, global economic activity helped many countries to improve their domestic revenue collection without any major intervention in the area of tax policy or administration. Some countries may have benefited more from this situation than others.
Table 7: Tax ratio and log GDP per capita – testing for sample selection
Note *** – significant at 1 per cent level. Dependent variable: in all columns tax ratio as defined in Table 1. Sample used: columns (i) and (ii) – all observations; column (iii) – 2008, excluding countries which did not report tax revenue in 2006. Right-hand side variables: log GDP/capita, USD; sit – selection indicator, 1 if rit is non-missing, 0 if rit is missing, where rit is tax ratio for a country i in a year or group of years t.
Estimation method: OLS. Standard errors are heteroscedasticity-robust.
Table 8: Tax ratio and log GDP per capita – 1997–99 and 2001–03
Note Column (i) – years 1997–99. Column (ii) – years 2001–03. *** – significant at 1 per cent level.
Dependent variable: tax ratio as defined in Table 1. Right hand side variable – log GDP/capita, USD.
Estimation method: OLS with inverse probability weighting based on log GDP/capita, USD. LR – likeli- hood ratio. Standard errors are heteroscedasticity-robust.
Figure 3: Relationship between tax ratio and log GDP per capita, 1997–99 and 2001–03
1997–99
2001–03
Note On the left, scatter plot for 1997–99. On the right, scatter plot for 2001–03. N = 158. For each sub- figure, X-axis: tax revenue in per cent of GDP (= tax ratio) as defined in Table 1. Y-axis: log GDP per capita in constant 2000 US dollars for the corresponding period. Data presented as in Table 6.
Christian von Haldenwang / Maksym Ivanyna
Table 9: Tax performance progress matrix: 1997–99 and 2001–03 vs 2007–08
Source: Data as presented in Figure 3
As a result, several countries changed their relative position in the world distribution of tax performance, but not their absolute performance: Nepal, the Central African Republic, Eritrea, Malawi and Haiti increased their tax ratio over time without positive changes in GDP/capita and yet ended up in the low performing group. These countries did make pro- gress in tax collection, but not as fast as the world average. With less certainty, the same can be said of Sri Lanka, the Philippines, Indonesia, Vietnam, Romania, Bangladesh and Cambodia.
Some regional patterns are also worth mentioning. For instance, among those who im- proved their performance are two transformation countries in Eastern Europe and Central Asia: Kazakhstan and Russia. On the other hand, six countries in that region changed to lower categories (Slovak Republic, the Baltic States, Romania and Uzbekistan).
Many South and Southeast Asian countries also lost ground and moved to the low tax per- formers’ group, examples being Nepal, Pakistan, Bangladesh, Laos, the Philippines, Indo- nesia, India, Sri Lanka and Vietnam. An important exception is China, which changed
71 countries
76 countries
21 countries
from low to average performance. Similarly, nine sub-Saharan African countries moved to lower categories (e. g. Chad, the Central African Republic, Nigeria, Malawi and Namibia), while Liberia alone changed from average to high performance.
In Latin America and the Caribbean, three countries moved from average to low tax per- formance (Paraguay, Haiti and Colombia), while four (Ecuador, Mexico, Peru and El Sal- vador) changed from low to average and one (Brazil) from average to high performance.16 In the Middle East / North Africa (MENA) region, three countries managed to move to higher categories (the United Arab Emirates, Morocco and Oman), while Syria and Yemen joined the low performance group.
An increase in non-tax revenue could have been a major reason for the decline in the tax performance of Malaysia, Colombia and Vietnam. The Central African Republic, Malawi and Haiti experienced significant increases in ODA grant inflows in the period considered, which could be an indicator of the substitution of foreign aid for tax effort in these coun- tries. For the remaining countries changes in ODA grants (in per cent of GDP) were either insignificant or even negative.
3.4 Tax performance: some stylised facts
In this section we take a closer look at the various tax performance groups. Figure 4 com- pares the mean scores achieved by low, average and high tax performing countries (within each graph) broken down into income groups (different graphs), relating them to four categories:
(i) public finance (tax ratio, total revenue, public expenditure); (ii) alternative sources of financing (non-tax revenue, ODA grants, net flow of external debt); (iii) governance (Pol- ity IV democracy and regime durability indices, World Governance Indicators (WGI) Voice and Accountability and Government Effectiveness Indices); and (iv) special cir- cumstances (battle-related deaths, displaced persons).
In Table 10 we present the results of regressions on the above-mentioned indicators, where the dependent variables are GDP per capita and a dummy equal to 1 if a country is a low tax performer. The results are generally consistent with Figure 4. Low tax perform- ers have significantly lower total revenue and total expenditure (columns (i) and (ii)). Fur- thermore, their governments are less democratic and less effective (columns (v), (vii) and (viii)). Yet in terms of population size, regime durability, foreign aid or indebtedness they are not statistically different from the rest of the world.
16 It should be noted, however, that many sub-Saharan African and smaller Caribbean states could not be included in the analysis because of the lack of data.
Christian von Haldenwang / Maksym Ivanyna
Figure 4: Groups of tax performers, stylised facts
Note Depicted are mean values by tax performance group (within each graph) and income group (differ- ent graphs). First row: taxes – tax revenue, per cent GDP; revenue, expense – GG revenue and expendi- ture, per cent GDP (sources – see Table 1). Second row: non-tax revenue – GG revenue minus tax reve- nue, per cent GDP (source as for tax revenue), oda grants – ODA grants + other grants to government (GG), per cent GDP (sources – OECD, IMF GFS); ext. debt flow – net public and publicly guaranteed external borrowing, per cent GDP (source – WDI). Third row: polity – POLITY2 index of democracy (source – Polity IV project); durab. – durability of regime, years (source – Polity IV project); WGI v&a – Voice and Accountability Index*10 (source – WGI); WGI gov.eff. – government effectiveness index*10 (source – WGI). Fourth row: displaced popul. – internally displaced persons, per cent total pop. (source – WDI); deaths in battle – battle-related deaths, per cent pop.*1000 (source – WDI). All figures are aver- ages of 2007–2008. Number of countries in each group: high income – 44 (low tax performance – 7, average – 25, high – 12); upper-middle income – 44 (low – 8, average – 27, high – 9); lower–middle income – 45 (low – 14, average – 21, high – 10); low income – 42 (low – 11, average – 27, high – 4)
Table 10: Low tax performers vs the rest of the world: regressions
Note * – significant at 10 per cent level, ** – significant at 5 per cent level, ***– significant at 1 per cent level. Years analysed in all regressions – 2007–08. See Figure 4 for definitions of dependent variables.
Right-hand side variables – GDP/ capita, thousands USD and dummy equal to 1 if a country is low tax performer (see Table 1 for the list). Estimation method in all regressions: OLS. Standard errors are het- eroscedasticity-robust.
Several facts are worth noting:
— As non-tax revenue, which includes property income, is higher for low tax performers in all income groups, the lack of tax revenue is partly offset by alternative sources of financing. However, non-tax revenue does not fully offset low tax revenue: total reve- nues and total expenditures are lower in low tax performing countries than in the other two categories, even though low tax performers from the upper-middle income group spend more and low tax performers from the lower-middle income group obtain more revenues than average tax performers.
— As regards the other sources of financing, it appears that low tax performers do not receive much foreign aid (ODA grants) or have much access to external borrowing. In contrast, average or high tax performing low-income countries clearly receive more aid and also, in the case of the four high tax performers, more loans from the interna- tional community. The stock of external debt also shows them to be far more indebted (see Table 11).
— According to the Polity IV and the WGI Voice and Accountability indicator sets, gov- ernments are less democratic in low tax performing countries, regardless of income group., They also tend to be less effective (as measured on the WGI Government Ef- fectiveness index), although the difference appears to be smaller. No clear pattern of regime durability emerges.
— In general terms, low tax performers also have a higher death toll in armed conflicts and a larger number of displaced persons. This is especially true of the lower-middle- income and low-income group, indicating that low tax performance may also be re- lated to special circumstances, such as violent conflicts or natural disasters, and not only to low tax effort in the specific meaning discussed above.
Christian von Haldenwang / Maksym Ivanyna
Table 11: Low tax performers: General information and public finance
Note Columns: gdp/cap – GDP per capita, thousands of constant US 2002 dollars (source – WDI); reg – region code and inc gr – income group, as classified by the World Bank (see definitions in Table 6); tax – tax revenue, per cent GDP (source – see Table 1); rev, exp – total government (GG) revenue and expendi- ture, per cent GDP (sources – same as tax); gr’s – ODA grants + other grants to government (GG), per cent GDP (sources – OECD, IMF’s GFS); debt flow – public and publicly guaranteed external borrowing, per cent GDP (source – WDI); debt stock – present value of total external debt, per cent GDP (source – WDI). All figures are averages of 2007–2008.