Research Collection
Report
Fluid inclusion and stable isotope studies of the copper mineralization at Mount Isa
Author(s):
Heinrich, Christoph A.; Andrew, Anita S.; Wilkins, Ronald W.T.
Publication Date:
1985-04
Permanent Link:
https://doi.org/10.3929/ethz-b-000405241
Rights / License:
In Copyright - Non-Commercial Use Permitted
This page was generated automatically upon download from the ETH Zurich Research Collection. For more information please consult the Terms of use.
ETH Library
RESTRICTED INVESTIGATION REPORT 1581R
INSTITUTE OF ENERGY AND EARTH RESOURCES
DIVISION OF MlNERALOGY & GEOCHEMISTRY
FLUID INCLUSION AND STABLE ISOTOPE STUDIES OF THE COPPER MINERALIZATION AT MOUNT ISA
CHRISTOPH A. HEINRICH^ ANITA S. ANDREW AND RONALD W.T. WlLKINS
P.O. Box 136 NORTH RYDE. NSW
AUSTRALIA 2113 APRIL 1985
Distribution list
Mr J.R. Blair, Chief Mine Geologist, Mount Isa Mines Ltd.
Dr D.J. Patterson, Research Geologist, Mount Isa Mines Ltd.
Dr D.R. Hudson, Acting Chief, CSIRO Division of Mineralogy and Geochemistry
Dr G.F. Taylor, Officer in Charge (North Ryde), CSIRO Division of Mineralogy and Geochemistry
Dr B.L. Gulson, CSIRO Division of Mineralogy and Geochemistry Dr A.S.Andrew, CSIRO Division of Mineralogy and Geochemistry Dr C.A.Heinrich, CSIRO Division of Mineralogy and Geochemistry Dr R.W.T.Wilkins, CSIRO Division of Mineralogy and Geochemistry IEER Editorial
IEER Port Melbourne IEER Record
Table of Contents
List of Figures, Plates and Tables 2
SUMMARY ^ INTRODUCTION 7 PART I: FLUID INCLUSION STUDIES 8 CHARACTERISTICS OF INCLUSION FLUIDS 8
Group 1: C02-rich inclusions 9 Group 2: NaCl-rich inclusions 11 Group 3: CaC12-rich inclusions 13 Low-density inclusions 15RELATIVE CHRONOLOGY OF FLUIDS AND ROCK ELEMENTS 22
General criteria 22Sample 73565 23 Sample 73509 25 Sample BP13 27 Sample 73518 29
Summary 32GEOTHERMOMETRY AND GEOBAROMETRY 33
Isochores for chloride-rich aqueous fluids 33 Stability and isochores of C02-rich fluids 35 The stability of dolomite + quartz + fluid 36 Interpretation and discussion 40
PART II: SULFUR ISOTOPE GEOCHEMISTRY 45 SAMPLE SELECTION AND ANALYTICAL METHODS 45 RESULTS 46
Copper orebodies 49 Other samples 52DISCUSSION 61
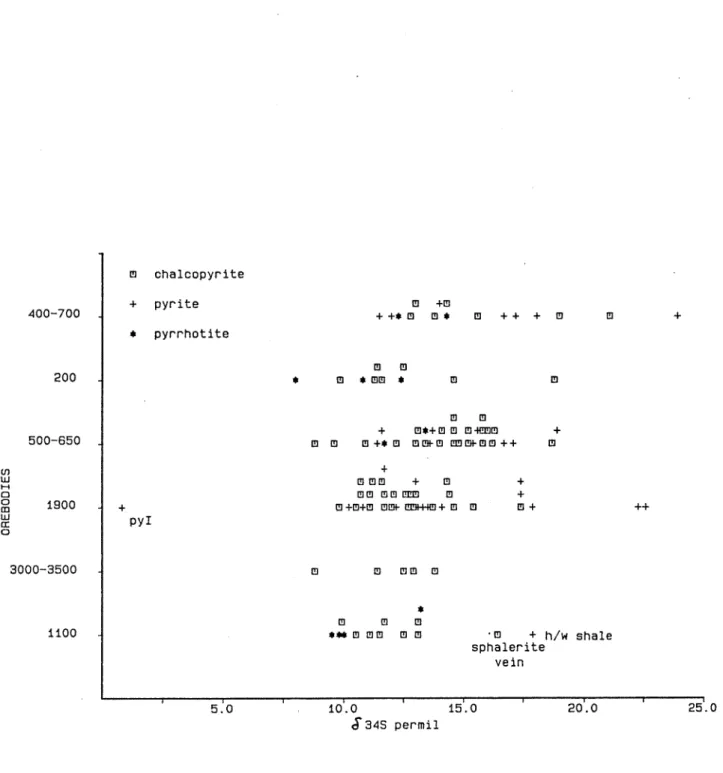
Sulfur isotope relationship of copper orebodies 61 Sulfur isotope relationship between Pb/Zn andCu-orebodies 62 Sulfur sources 63 Sulfur isotope constraints on the origin
of Cu-mineralization 65
CONCLUSIONS AND FUTURE WORK 67 ACKNOWLEDGEMENTS 71 REFERENCES 72 APPENDIX I : LIST OF NEW SAMPLES AND THEIR LOCATIONS 75
OF SAMPLES STUDIED BY FLUID INCLUSION APPENDIX II: DESCRIPTION 78
MICBOTHERMOMETRY
SampleSample Sample Sample Sample Sample Sample Sample Sample Sample
73506 BP13
73510
73518
73519
73520
73530
735^0
73542
73603
Figures
Figure 1: Plot of temperature of final homogenization (in deg C) vs. total salinity (in equivalent weight percent NaCl)
Figure 2: Histograms of homogenization temperatures (in deg C), subdivided according to different fluid inclusion and rock types Figure 3: Summary sheet of relative chronology of rock "elements"
and fluid inclusions in 73565
Figure 4: Summary sheet of relative chronology of rock "elements"
and fluid inclusions in 73509
Figure 5: Summary sheet of relative chronology of rock "elements"
and fluid inclusions in BP13
Figure 6: Summary sheet of relative chronology of rock "elements"
and fluid inclusions in 73518
Figure 7: P-T diagram showing estimated fields of formation of the three main groups of fluid inclusions. Group 1 = CO^-rich inclusions; Group 2 = NaCl-rich aqueous inclusions, mostly from siliceous alteration; Group 3 = late CaCl^-rich inclusions. See text for discussion and sources of experimental data used to define the fields.
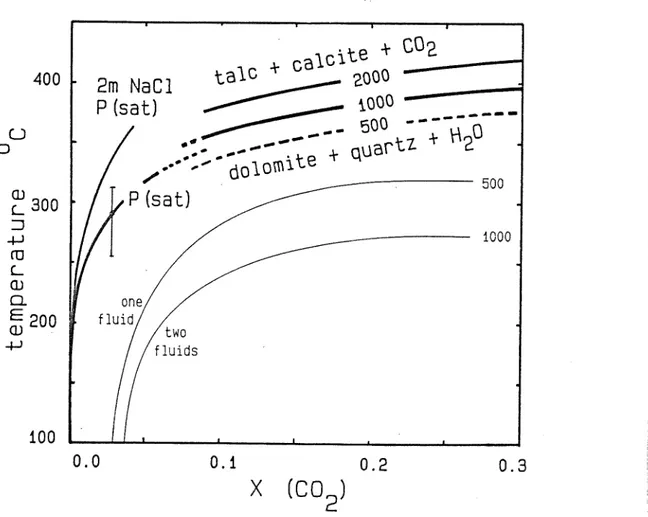
Figure 8: Diagram of temperature vs. mole fraction of CO showing the upper thermal stability limit of dolomite + quartz" + fluid (heavy lines) and two contours of the two-phase surface of the binary CO _ H^O system (fine lines). All contours are for constant pressure, labelled in bars. See text for discussion.
Figure 9: Sulfur isotope data for copper orebodies. Values in permil relative to CDT.
Plates
Plate 1: Photomicrographs of COg-rich fluid inclusions Plate 2: Photomicrographs of NaCl-rich fluid inclusions Plate 3: Photomicrographs of CaCl^.rich fluid inclusions Plate 4: Photomicrographs
A. Massive pyrite. Some large crystals have atoll structures preserved. Sample 73590 Bed 3.
B. Completely recrystallized section of bedded pyrite. Coalesced pyrites with atoll structure cut by pyrite (clear) + chalco- pyrite vein. Sample 73589A
Plate 5: Photomicrographs of coalescing pyrite with atoll structure preserved.
A. Sample 73589B Bed 5.
B. Sample 73590 Bed 3 Plate 6: Photomicrograph
A. Fine pyrite with atoll structure. Sample 73589A Bed 5
B. "Fury" pyrite with partial atoll structure. Sample 73589A Bed 3,
Tables
Table 1: Summary of microthermometric observations on the three main groups of fluid inclusions.
Table 2: Summary of fluid compositions of the three main groups of inclusions, as deduced from microthermometric data, estimated volume ratios, electron microprobe salt analysis, and some Laser Raman microprobe data.
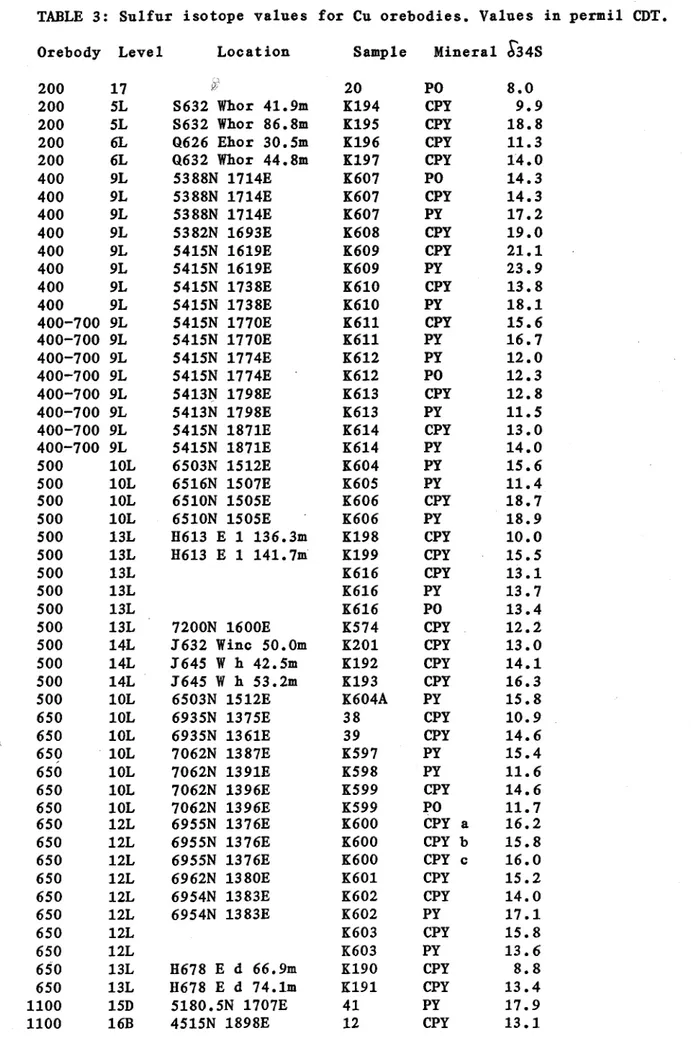
Table 3: Sulfur isotope values for Cu orebodies. Values in permil CTD.
Table 4: &3^S values for bedded pyrites from the vicinity of the 1100 orebody. Values in permil CDT.
Table 5: 634S values for Eastern Creek Volcanics and miscellaneous samples. Values in permil CDT.
SUMMARY
This report presents results of fluid inclusion and sulfur isotope investigations obtained during the first seven months of a research project aimed at understanding the geochemical aspects of the genesis of the copper mineralization at Mt. Isa. The two cooperative projects are jointly funded by Mount Isa Mines Ltd.
(MIM) and CSIRO, Division of Mineralogy and Geochemistry.
Microthermometric and electron microprobe analysis of fluid inclusions in samples of silica-dolomite breccia, mainly from the 1100 orebody and its surrounding rocks, have identified three major groups of fluids with clearly different compositions. The three groups of fluid inclusions also differ in the temperature - pressure conditions of their formation, which are further con- strained by calculated mineral stabilities.
1. C02-rich inclusions with about 17 mole % C02 and a low sali- nity are locally found in dolomitic breccia and probably repre- sent a relatively early fluid in the history of the silica- dolomite. They have been trapped at temperatures between 270 and 400 deg C, and required a minimum pressure of 750 bars. This suggests a minimum depth of burial of 3 km at least at some early stage of dolomitic alteration, but the significance of these inclusions for the genesis of the dolomitic breccia is not yet clear.
2. NaCl-rieh aqueous inclusions with wide range in salinity and a tendency to become more dilute with time are by far the most abundant inclusion type in dolomitic as well as siliceous breccia. They probably include the fluids responsible for silicic alteration and the main copper introduction. Most of these inclu-
sions homogenize in a narrow range between 140 and 170 deg C.
They have probably been trapped between 200 deg C / 750 bars and 280 deg C / 1500 bars, provided that the assumption is correct that the same minimum pressure as required for the C02-rich inclusions has also been maintained during silicic alteration.
Fluid inclusions found in faults cutting the 1100 orebody or its underlying rocks have similar composition but tend to be of somewhat higher-temperature origin.
3. CaC12-rich brines occur locally as late secondary inclusions with even lower homogenization temperature. They probably post- date the main hydrothermal activity.
Sulfur isotope values for samples of the Cu orebodies can be divided into two groups. The first, homogeneous in sulfur and lead isotopes, includes the large orebodies (1100, 3000-3500) while the second, isotopically inhomogeneous is associated with the smaller orebodies (200, 500-650, 400-700, 1900). The diffe- rences between these groups are interpreted as reflecting the amount of mixing of sulfur derived from the stratigraphy and that introduced to the system with the Cu mineralizing fluids.
The source of the introduced sulfur cannot be specified precisely. The Eastern Creek Volcanics in the vicinity of the mine are strongly altered and the sulfur isotopic signature of this alteration is similar to that proposed for the Cu-bearing fluid. However the Eastern Creek Volcanics remote from the mine have values typical of unaltered volcanic rocks. While the Eastern Creek Volcanics cannot be excluded as a potential sulfur source at present we favour an interpretation of the addition of sulfur to the Eastern Creek Volcanics at a similar time to that of the Cu mineralization hosted in the Urquhart Shales, and that
the sulfur has been leached from another source enriched in 34S.
Many potential sources, including evaporites, exist in the Mount Isa region.
Future work Is proposed.
INTRODUCTION
In September 1984, two joint CSIRO-Mount Isa Mines research projects were set up on stable isotope and fluid inclusion stu- dies of the Mount Isa copper orebodies. This is the first formal report covering work which has been done in the first half year.
The projects concern the source of sulfur and the sulfur budget in the Mount Isa copper orebodies and the composition of the copper ore-forming fluids and their interaction with the host rocks of the orebodies. The source of sulfur, particularly whether it is introduced or inherited, is a major question for the establishment of a genetic model to be used in exploration for new copper mineralization of silica-dolomite style. Any re- fined model must also be based on adequate information about the nature of the ore-forming fluids including data on temperature, and composition of the liquid and gaseous components. Together with stable isotopic data on the carbon, oxygen and hydrogen isotopes of the orebodies and their host rocks to be collected during the second half of the project(s), these data will make it possible to better interpret the mineralogical and geochemical patterns in and around the orebodies. This report contains infor- nation on fluid inclusions from the silica-dolomite and some other rocks from the mine area, and sulfur Isotope data mainly on copper ores and pyrites from the unmineralized host rock. It lays the basis for more detailed and intensive studies in the next parts of the two projects. The present emphasis is on the presen- tation of data, and any interpretation should be regarded as provisional and designed to provoke discussion.
The study forms part of CSIRO Institute of Energy and Earth Resources research programs CA (Exploration: Mineral Deposit Characteristics).
PART I : FLUID INCLUSION STUDIES
CHARACTERISTICS OF INCLUSION FLUIDS
Detailed petrographic microscopy of over 50 doubly polished thin sections (see Appendix I for locations) has shown that fluid inclusions are generally very abundant, but that only a small fraction of the samples contain inclusions of sufficient size for microthermometric investigation. Among these, a rather small number of samples were selected primarily on the basis of showing clear textural relations at the scale of handspecimen to thin section to establish the relative chronology of the fluids.
Most samples on which detailed fluid inclusion measurements have so far been made are from the 1100 orebody and its alteration envelope. They were studied mainly by a combination of heating/freezing stage microthermometry, and a newly developed method to semiquantitatively analyse cation ratios of the inclusion salts using the electron microprobe (Heinrich and Cousens, In prep.).
Detailed information on each of the samples is documented in Appendix II. This chapter presents a summary of the data and attempts to classify the observed inclusion fluids into major compositional groups. The temporal and small-scale spatial relation between these fluid types will be the subject of the next chapter.
Nearly all fluid inclusions found so far in the silica- dolomite fall into one of three major, rather clear-cut groups.
Each of these groups, however, includes a substantial range of fluid compositions and bulk densities of the inclusions (Fig.1,2). These three groups will be referred to as CO^-rich
inclusions (or Group 1), NaCl-rich inclusions (Group 2), and CaCl^ -rich inclusions (Group 3). (see Table 1 and 2).
Group 1: CO^-rich inclusions / ,^/ ^ , .^.^f1""'"1 '-"""
These relatively rare but important inclusions are recognised by their large bubble, which fills nearly half of the inclusion volume at room temperaturre. This bubble consists of liquid CO^, sometimes enclosing another smaller, fast moving bubble of gas. In the majority of the inclusions, however, the inner bubble only nucleates on slight cooling of the sample to
<10 deg C. This simple cooling test can be performed with an entire thin section and has so far allowed the identification of CO -rich inclusions in four samples: BP13, 73509, 73542 and
73565.
On cooling to lower temperatures, a barely visible gas clathrate nucleates in the aqueous phase near -30 deg C, masking the freezing of ice which occurs at a somewhat lower temperature.
Solid CO^ nucleates at approximately -95 deg C. Its final melting temperature on warming is between -58.5 and -56.5 deg C for most inclusions, suggesting that CO,, makes up more than 90 mole percent of the bubble (Burruss, 1981, Fig. 3.4). The density of the CO^-rich liquid is defined by the temperature of homogenization of the inner CO^(gas) bubble into the liquid CO^, which is observed at +20 to 23 deg C in the majority of inclusions. This and the volume ratio of liquid CO to H20, estimated at 40 deg C from length measurements on thin, tube- shaped inclusions occuring in sample 7352l2, allows us to estimate a mole fraction of X(CO ) = 0.17 +- 0.04. For this determination the graphical method suggested by Burruss (1981; Figs.3.13,3.14) was used, which is accurate enough considering that the volume estimation is the main source of uncertainty.
Plate 1 Photomicrographs of CO -rich fluid inclusions
Inclusions containing liquid H^O and a large bubble of liquid
co^.
(aT Possibly primary inclusion (b) mature secondary inclusion in clear dolomite. in dolomite, with an
additional gas bubble.
Sample BP13. •—• Sample 73542. <—•
•• 4
^ ••'.»
^lf ••••.v
'<^ t
All scale bars are
10 microns
r ' / / *. - ^^
(c) Isolated early or primary CO^-rich inclusion with a large bubble of liquid CO^ (upper righS corner), and two trails of later secondary NaCl-rich aqueous inclusions with relatively high homogenization temperature. Sample BP13, center of dolomite porphyroblast.
10
The salinity of the CO^-rich inclusions is very low but not accurately determined, because the melting of ice is difficult to see (and also not easily interpretable; cf. Collins, 1979) due to the presence of CO^-clathrate. This barely visible phase persists to at least +8.H deg C and generally to 9-11 deg C, suggesting that the salinity is always below 5 wt% (Burruss,1981, Fig.3.12).
Group 2: NaCl-rich inclusions
Two-phase inclusions containing an aqueous solution and a small bubble (5-15? of inclusion volume) are by far the most abundant inclusion type in all samples. These inclusions which have widely variable concentrations of NaCl and minor KC1 as the dominant dissolved salts are recognized by their ice melting behaviour. On warming up to -30 to -25 deg C after freezing, they form only a very small fraction of melt, which between -25 to -21 deg C suddenly increases due to the melting of NaC1.2H^o. The last melting of this salt hydrate can sometimes be directly observed, and always occurs between -23 and -21 deg C, i.e. close to the eutectic at -21.3 deg C of the binary system NaCl - H^,o.
Microprobe data shows that KC1 amounting to about 10? of the total salt is the only other major salt component.
At present we have little quantitative data on the gas content of these inclusions. A low gas content, and in particular a very low CO^ content, is suspected from the following observations.
Three Raman microprobe analyses of aqueous inclusions from the silica dolomite showed a predominance of CH^, and minor N-> in some of them. CO^ was dectable only in one sample from the so- called Buck Quartz, a fault at the base of the 1100 orebody filled with up to several metres of barren vein quartz. The low
11
Plate 2 Photomicrographs of NaCl-rich fluid inclusions
(a) Typical NaCl-rich 2-phase inclusion of intermediate salinity, in clear quartz associated with chalcopyrite. Sample 73520.
10
microns
^ 5
(b,c) Primary NaCl-bearing inclusions of relatively low salinity, from a late vugh crystal, sample 73519a.
(a, left) Isolated mature-shaped inclusion with a small
?carbonate daughter crystal.
(b, right) Inclusions attached to the wall of a small quartz crystal enclosed by the larger one.
12
intensity of the measured Raman peaks suggests a low gas pressure in the small bubbles, probably at the level of bars, or at most a few tens of bars.
It has never been observed that any solid phase condenses from the bubbles, and no gas clathrates are visible between 0 and +20 deg C. If it is accepted that these phases - which admittedly are very difficult to see - are indeed absent, then this leads to the following conclusion: either gases other than CO„ are predominant in the bubbles (e.g. CH^p N^); or alternatively, if COg is thr dominant gas component, then its pressure is below 10 bars (Burruss,1981,Fig.3.12). In either case the partial pressure of CO^ is probably very low, and under such conditions the bulk of any CO^ in the inclusion would be dissolved in the aqueous phase. At P(CO.-)) of, say, 25 bars., a pure aqu ecus solution at 25 deg C can contain a maximum of 3 mol % CO,, (dark, 1966, p.388), but a saline solution with 2 mol/kg NaCl (=13.6wt56) cannot con- tain more than 2 mol % CO^ (calculated from the data given by dark, 1966, and the "salting-out" or Setchenov-coefficient, as given by Naumov et al. 197lt, p. 249).
Group 3: CaClg - rich inclusions
These inclusions are rare and of subordinate abundance in all samples, but they are fairly widespread in siliceous and dolomitic breccia as well as in the Buck Quartz. They are charac- terised by the presence of small NaCl daughter crystals in some of them, and more generally by their typical low-temperature behaviour.
On cooling, they do not freeze to -190 deg C but seem to solidify as a gel, which then crystallizes to a brownish, rather coarse-textured mass of ice plus some liquid during warming
13
Plate 3 Photomicrographs of Cad -rich fluid inclusions (a) 3-phase inclusions with a
small NaCl daughter crystal.
Both photos sample 73519a.
(b) late 2-phase CaCl^-rich secondaries on sharp,"healed fracture plane
scale bars
10
microns
(c) Sharp trail of small 2-phase crosscutting area with scattered larger, even primary, NaCl-rich inclusions.
Sample 73518, Type 3, 1( inclusions; see Appendix II.
CaCl^-rich inclusions and probably earlier or
14
through -80 to -60 deg C. Invariably they form from an appreciable fraction of visible melt near -60 to -50 deg C, i.e.
near or even below the ternary eutectic in the system CaCl^ - NaCl - HO at -52 deg C (Crawford, 1981). Microprobe analyses confirmed that they are essentially CaCl^-NaCl fluids with a molar ratio of Ca:Na near 2:3. In some inclusions, a weakly birefringent granular salt hydrate, probably NaC1.2H,,o, persists on warming beyond the melting of the last ice, while in others it can melt as low as -53 deg C as the last solid phase. Inclusions containing a cubic salt crystal sometimes do not freeze at all.
The NaCl daughter crystal, which typically has about the same size as the small gas bubble, dissolves on heating to be- tween 100 and 140 deg C, just below or a little above the tempe- rature of homogenization of the bubble into the liquid phase.
An experimental phase diagram for the system CaCl.,_NaCl-I is given by Fuzikawa (1982,Fig.10). It gives isothermal contours of 2-phase surfaces as a function of vt% CaCl vs. vt% NaCl. The contours for the final dissolution of NaC1.2H^O and NaCl have a slope close to -1 for most compositions except very CaCl^ -rich ones. Therefore the total salinity in equivalent vt.% NaCl, determined from the solubility curves of the binary NaCl-H^Q system (which was applied to plot Fig.1), closely approximates the true total salinity in vt% NaCl + CaCl .
Low-density inclusions
All doubly polished thin sections were searched very carefully for any inclusions of low density (i.e inclusions with a very large bubble, or 1-phase gas inclusion). Such inclusions could be indicative of a stage of separation of a vapour phase during the hydrothermal history of the silica-dolomite, and are
15
commonly observed, for example, in porphyry-copper deposits.
They are strikingly absent from all samples from the Mount Isa Mine area studied so far, and so there is no evidence suggesting boiling.
One sample from the mine area was found containing secondary 1-phase gas inclusions, which probably contain CH, + y (in predominance over CO^) of moderate density. (73519, see Appendix II). Little weight is placed on this single observation because the low-density gas inclusions occur as secondary trails In a late vugh crystal in association with CaCl,,-rich inclusions, which are themselves late and probably of local importance only
(see next chapter).
^
16
Figure 1 (opposite page). Plot of temperature of final homogenization (in deg C) vs. total salinity (in equivalent weight percent NaCl) for all fluid inclusions.
Legend:
Rock type
dolomitic
mixed silicic- dolomitic
silicic
faults etc.
CO^-rich
(frame) BP13
(frame) 73542
NaCl-rich
4-
n
A
0
BP13
73542 73510 73540 (frame) 67672
0
D
• -^
73518 73519,20
73603 67666
CaClg-rich
(frame) 73542
(frame) 73518
• 73519
25 »a
73518
73542
NaCl solubllity curve
67672
20
15
a-0)
&<
10
u
(Uz
>t +J
•r-1
c.
ro
Ulhomogenization temperature
100 150 200 250
17
Figure 2 .: Histograms of homogenization temperatures (in deg C), jsubdivided according to different fluid inclusion and rock types
18
101 faults
I . _L
67666, 73603
10
10
10
COg-rich inclusions 73542, BP13
NaCl-rich aqueous inclusions in dolomitic breccia 73542, BP13
73510
NaCl-rich aqueous inclusions in siliceous breccia
CaClg-rich aqueous inclusions 73518-19, 73542
10
100 150 200 250
homogenization temperature
19
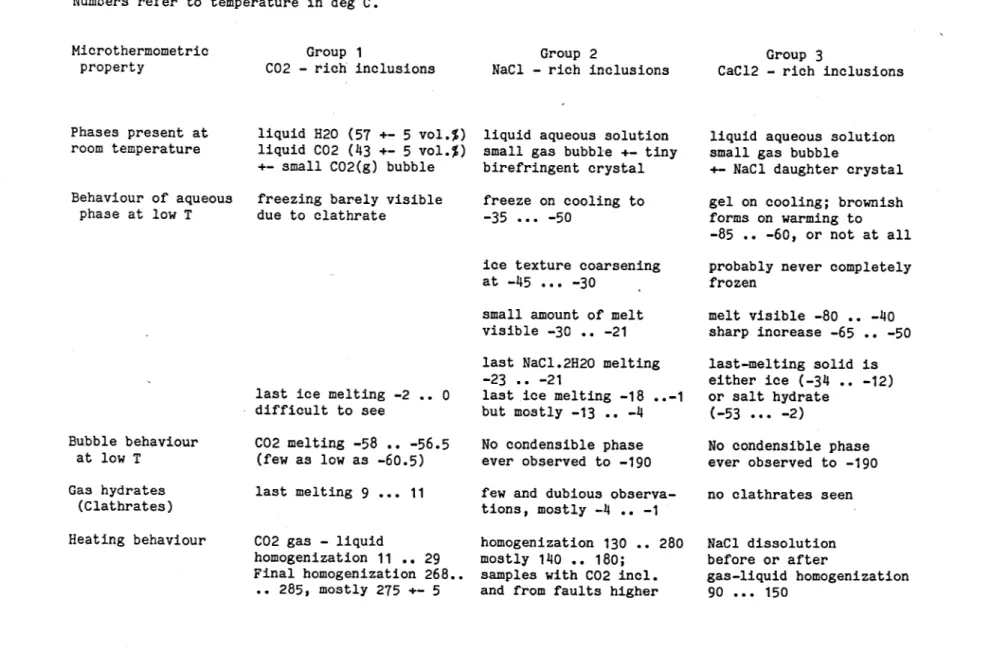
Table 1. Summary of microthermometric observations on the three main groups of fluid inclusions.
Numbers refer to temperature in deg C.
Microthermometric property
Group 1
C02 - rich inclusions Group 2
NaCl - rich inclusions Group 3
CaC12 - rich inclusions
M 0
Phases present at room temperature
Behaviour of aqueous phase at low T
Bubble behaviour at low T
Gas hydrates (Clathrates) Heating behaviour
liquid H20 (57 +- 5 vol.%}
liquid C02 (43 +- 5 vol.?) +- small C02(g) bubble freezing barely visible due to clathrate
last ice melting -2 .. 0 difficult to see
C02 melting -58 .. -56.5 (few as low as -60.5) last melting 9 ... 11
C02 gas - liquid
homogenization 11 .. 29 Final homogenization 268.
.. 285, mostly 275 +- 5
liquid aqueous solution small gas bubble +- tiny birefringent crystal freeze on cooling to -35 ... -50
ice texture coarsening at -45 ... -30
small amount of melt visible -30 .. -21 last NaC1.2H20 melting
-23 .. -21
last ice melting -18 ..-1 but mostly -13 .. -^
No condensible phase ever observed to -190 few and dubious observa- tions, mostly -it .. -1 homogenization 130 .. 280 mostly 110 .. 180;
samples with C02 incl.
and from faults higher
liquid aqueous solution small gas bubble
+- NaCl daughter crystal gel on cooling; brownish forms on warming to -85 .. -60, or not at all probably never completely frozen
melt visible -80 .. -40 sharp increase -65 .. -50 last-melting solid is either ice (-34 .. -12) or salt hydrate
(-53 ... -2)
No condensible phase ever observed to -190 no clathrates seen
NaCl dissolution before or after
gas-liquid homogenization 90 ... 150
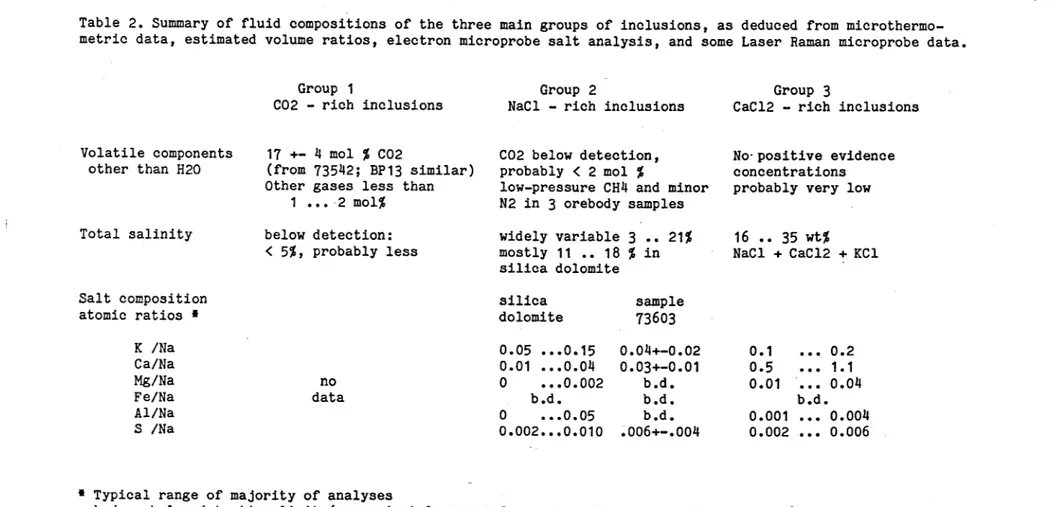
Table 2. Summary of fluid compositions of the three main groups of inclusions, as deduced from microthermo- metric data, estimated volume ratios, electron microprobe salt analysis, and some Laser Raman microprobe data.
Group 1
C02 - rich inclusions Group 2
NaCl - rich inclusions Group 3
CaC12 - rich inclusions
M
Volatile components other than H20
Total salinity
Salt composition atomic ratios •
K /Na Ca/Na Mg/Na Fe/Na Al/Na S /Na
17 +- 4 mol ;( C02
(from 7351t2; BP13 similar)
Other gases less than 1 ... 2 mol%
below detection:
< 5%, probably less
no data
C02 below detection, probably < 2 mol %
low-pressure CH4 and minor N2 in 3 orebody samples
No-positive evidence concentrations probably very low
widely mostly silica silica
variable 11 .. 18 dolomite
dolomite
0.05 .., 0.01 ..,
0
0 b.d.0.002..
..0.15 ,.0.04 ,.0.002 1.
..0.05 ,.0.010
3 .. 21K i in
sample
73603
0.0t+-0.02 0.03+-0.01
b.d.
b.d.
b.d.
.006+-.004
16 .. 35 wt%
NaCl + CaC12
0.1 ...
0.5 0.01 ...
b.d.
0.001 ...
0.002 ...
+ KC1
0.2 1.1 0.04 0.004 0.006
• Typical range of majority of analyses
b.d. = below detection limit (approximately 0.005 for Fe/Na, Al/Na and 0.002 for Mg/Na)
RELATIVE CHRONOLOGY OF FLUIDS AND ROCK ELEMENTS
General criteriaA comprehensive relative chronology of the fluid inclusions in rocks such as the copper ores from Mt.Isa and their host rocks may be established by determining
(a) the relative age of the rock "elements" in critical samples, (b) the distribution of fluid inclusions among these "elements", and
(c) the relationship between the rock "elements" and the deformation and mineralization events in the history of the area.
Any rock may be considered to consist of a number of distinct entities or "elements", each of which has originated in response to some geological event. Thus a group of veins which were emplaced at about the same time in response to a particular set of principal stress conditions would form a single "element"
in the rock. This "element" may be characterized by any or all of a particular orientation, mlneralogy or texture.
The relative age of the various rock "elements" is determined from intersection relationships, the relative degree of deformation of the mineral grains in the different "elements", and other textural evidence such as replacement in critical samples. Two principles determine the relative chronology of the fluid inclusions. Firstly, cracks (from which secondary inclu- sions form by healing) develop periodically during the geological history of a rock. Secondly, a fluid pervading a rock may only be sampled as fluid Inclusions in those rock elements which are either already in existence at that time (secondary Inclusions), or in process of formation (primary inclusions).
22
For the purpose of this report only the relative chronology of the rock "elements" and the fluid inclusions is considered.
The relationship of these to mineralization and deformation events is not considered at this stage, or only noted in passing. Probably most of the vein features discussed are D3 in the nomenclature of Perking (1984).
Four samples will be discussed in detail to describe the sequence of fluids which have been trapped in them. Three are from the silica-dolomite (BP13, 73509 and 73565) and were selected because they contain COg-pich inclusions in addition to the NaCl-rich aqueous inclusions which are ubiquitous in the host rocks to the orebody. The fourth sample (73518) is from the siliceous zone and was selected because it provides some evidence on the relative chronology of aqueous fluids of different salinity. Fluid inclusion data on BP13, 73518 and additional samples is given in Appendix II.
Sample 73565
This sample consists of dolomite and quartz veins cutting recrystallized dolomite near the 1100 orebody (Fig. 3). Three generations of veins, which can be placed in chronological order on intersection criteria, comprise important "elements" in this rock. The earlier quartz-dolomite vein, which contains no chalcopyrite, may well have been the result of open space filling. Stumpy dolomite crystals on both sides of this vein contain the distinctive large-bubbled CO^-rich inclusions, in addition to small-bubbled aqueous inclusions. The quartz crystals in the center of the vein, on the other hand, contain only aqueous inclusions.
23
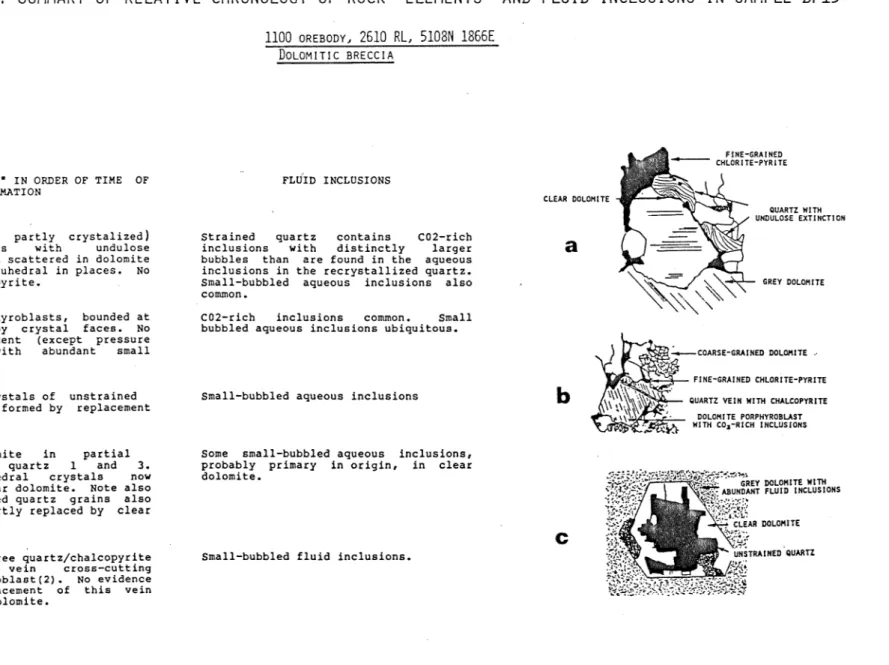
FIGURE 3; SUMMARY OF RELATIVE CHRONOLOGY OF ROCK "ELEMENTS" AND FLUID INCLUSIONS IN SAMPLE 73565
1100 OREBODY, 19E LEVEL, T138 MUCKPILE
COARSE DOLOMITE AND QUARTZ VEINS IN RECRYSTALLIZED DOLOMITE
ROCK "ELEMENTS" IN ORDER OF TIME OF
FORMATION FLUID INCLUSIONS
M
4^1. Quactz-dolomite vein, no chalcopyrite, parallel to what may be bedding. Stumpy quartz and dolomite crystals growing from both sides of the vein, apparently into an open cavity.
2. Synkinematic fibre veins with both quartz and dolomite growing in parallel.
No chalcopyrite. Vein 2 cuts vein 1.
3. Fibre veins, quartz-dolomite-chalco- pyrite. These may be variants of vein 2.
4. Vein with large (3 cm) white dolomite crystals with an undulose extinction in section which is probably related to growth rather khan to deformation. Some small clear quartz crystals also in the vein. Vein 4 cuts vein 1.
C02-rich inclusions found in dolomite crystals on both sides of the vein.
Small-bubbled aqueous inclusions- relatively large and clean.
Small bubbled aqueous inclusions
Small bubbled aqueous inclusions
BQtSfffJS. VEIN WITH LARGE UNDEFORMED CRYSTALS
QUARTZ-DOLOHITE VEIN WITHOUT CHALCOPYRITE CO^-RICH INCLUSIONS
'IN DOLOMITE,
SYNKINEHATIC CUARTZ AND DOLOMITE FIBRE VEINS WITH CHALCO- PYRITE. -.
This vein is cut by synkinematic quartz and dolomite fibre veins accompanied by minor chalcopyrite. Although the intersection relationship is not clear in the plane of the thin section, the hand specimen contains another thicker vein of the same sort with sigmoidally-curved fibres, which cuts the earlier dolomite vein.
The early quartz-dolomite vein is also cut by a 3 cm thick vein containing large undeformed white dolomite crystals. The relationship of this vein to the synkinematic fibre veins is not clear either in thin section or hand specimen, but the lack of deformation of the large dolomite crystals strongly suggests that this vein is the latest of the three types. No C0^_rich inclu- sions are found in the synkinematic fibre veins or the late vein with the large undeformed dolomite crystals.
Sample 73509
This sample is a banded pyritic shale cut by chalcopyrite- rich veins (Fig.4). It contains three important rock "elements", bedded pyritic and dolomitic layers which are cut by two types of discordant veins. The first type is a coarse-grained white dolomite in veins of irregular thickness. These are cut in turn by quartz-dolomite-chalcopyrite veins: both the quartz and dolomite accompanying the sulphide are clear with few inclusions.
The C0^_pich inclusions are in grey inclusion-rich dolomite crystals which are situated at the margin of one of the late quartz-dolomite-chalcopyrite veins. The crystals containing the CO^-rich inclusions appear to be part of the earlier coarse- grained white dolomite veining, though the distinctive large- bubbled CO^-rich inclusions are not observed elsewhere in these
25
FIGURE ^; SUMMARY OF RELATIVE CHRONOLOGY OF ROCK "ELEMENTS" AND FLUID INCLUSIONS IN SAMPLE 73509
1100 OREBODY, 15 LEVEL, 5032N 1300E
BANDED PYRITE-1 RICH SHALE CUT BY CHALCOPYRITE-RICH VEIN
no<T>
ROCK "ELEMENTS" IN ORDER OF TIME FORMATION OF
1. Bedded pyritic and dolomitic layers.
Dolomite is medium grained and distinctly grey with dispersed small sulphide grains.
2. Coarse-grained white dolomite In veins of irregular thickness, discordant to bedding.
3. Quartz-dolomite-chalcopyrite veins.
These crosscut both bedded pyrite and dolomite layers (1) and coarse-9rained white dolomite veins (2).
BEDDEP.PYRITIC AND DOLOMITIC LAYERS' FLUID INCLUSIONS
Small bubbled aqueous inclusions
Small bubbled aqueous inclusions most common, but some qrains contain large bubbled C02-rich inclusions as well.
Small bubbled aqueous inclusions
QUARTZ-DOLOMITE - CHALCOPYRITE VEINS
COARSE-GRAINED WHITE DOLOMITE
1 Cfl
veins, nor are they evident in the bedded dolomite. Small-bubbled aqueous inclusions are ubiquitous all through the rock as usual.
The chronological relations in sample 7351t2 described in Appendix II are very similar to the ones in 73509 and 73565.
r.
Sample BP13
With this dolomitic breccia from the 1100 orebody, new arguments beside intersection criteria must be brought into consideration in order to establish a relative chronology of the fluids (Fig.5). This rock contains at least five distinguishable rock "elements" which can be broadly ordered chronologically by the relative degree of deformation of their mineral components, and by the replacement relationships between them.
The oldest appears to be patches of deformed quartz with undulose extinction which is scattered in the dolomite matrix (Fig.5a). The matrix dolomite contains small-bubbled aqueous inclusions but its position in the time sequence relative to the undulose quartz and the porphyroblastic dolomite is not clear.
C02-rich inclusions are found both in this quartz and the next
"element" in chronological order: dolomite porphyroblasts (Fig.5b), which lack evidence of deformation and on this basis are younger than the early quartz with undulose extinction. The CO^-rich inclusion in the porphyroblastic dolomite are large and isolated and could be primary. Either simultaneously with dolomite porphyroblast formation or subsequently, euhedral crystals of quartz formed by replacement of porphyroblastic dolomite. All subsequent "elements" only contain the small- bubbled aqueous inclusions, which are also found as secondary inclusions in the porphyroblastic dolomite. The next "element"
27
FIGURE 5: SUMMARY OF RELATIVE CHRONOLOGY OF ROCK "ELEMENTS" AND FLUID INCLUSIONS IN SAMPLE BP13
1100 OREBODY. 2610 RL, 5108N 1866EDOLOMITIC BRECCIA
F1NE-SRAINED CHLORITE-PYRITE
no00
ROCK "ELEMENTS" IN ORDER OF TIME OF FORMATION
1. Deformed (and partly crystalized) quartz; patches with undulose extinction. Quartz scattered in dolomite matrix. Vaguely euhedral in places. No associated chalcopyrite.
2. Dolomite porphyroblasts, bounded at least in part by crystal faces. No deformation evident (except pressure twins). Grey with abundant small inclusions.
3. Euhedral crystals of unstrained quartz apparently formed by replacement of grey dolomite.
4. Clear dolomite in partial replacement of quartz 1 and 3.
Originally euhedral crystals now margined with clear dolomite. Note also that some deformed quartz grains also have mar9ins partly replaced by clear dolomite.
5. Clear strain-free quartz/chalcopyrite deposition in vein cross-cutting dolomite porphyroblaet (2). No evidence of partial replacement of this vein quartz by clear dolomite.
FLUID INCLUSIONS
Strained quartz contains C02-rich inclusions with distinctly larger bubbles than are found in the aqueous inclusions in the recrystallized quartz.
Small-bubbled aqueous inclusions also common.
C02-rich inclusions common. Small bubbled aqueous inclusions ubiquitous.
Small-bubbled aqueous inclusions
Some small-bubbled aqueous inclusions, probably primary in origin, in clear dolomite.
Small-bubbled fluid inclusions.
CLEAR OOLOHITE
OUARTZ WITH UNDULOSE EXTINCTION
6HEY DOLOHITE
COARSE-SRAINED DOLOMITE
PINE-6RAINED CHLOR1TE-PYRIT6 QUARTZ VEIN WITH CHALCOPYRITE
DOLOMITE PORPHYROBUST
•'"t&S'i,}, WITH COi-RlCH INCLUSIONS
^SS^^^^^ GHEY OOLOHITE_wrm, '^^Ssf» \ 1^^'ABUNDANT ?LuTb'iNCLUS10NS
'•\''L'
CLEAR DOLOHITE VNSTRAINEB OUARTZ
ff^^tes^
^w:^K-'^':w^s':yswi:ff./^consists of clear dolomite in partial replacement of deformed quartz and the undeformed euhedral quartz crystals (Fig.5c). The partial pseudomorphlng of the euhedral quartz crystals is a conspicuous feature of the rock in thin section. The final
"element" is a clear strain-free quartz-chalcopyrite vein (Fig.5b) which cuts a dolomite porphyroblast containing CO^-rich inclusions but which itself contains only the ubiquitous small- bubbled aqueous inclusions. There is no replacement of the quartz in this vein by dolomite.
Sample 73518
This is an example of the siliceous ore from the 1100 orebody , in which the chronological relationship between aqueous fluids of different salinity can be demonstrated (Fig.6). Fluid inclusion data and an overview photograph of this sample are given in Appendix II. Three types of veins are present in this rock, the earliest on intersection criteria presenting some
/
evidence of originally fibrous nature, but they are now largely recrystallized (veins of E-W orientation in photograph, Appendix
r
II). The aqueous fluid inclusions in these veins are partly in the grain interiors but mainly in the grain boundaries. The second set of veins contains undeformed quartz fibres with a little dolomite (N-S orientation in photograph. Appendix II). The fluid inclusions in these fibres appear to be of primary origin because adjacent fibres contain a distinctly different abundance of fluid inclusions and there are few healed fractures which cut several fibres. These fluids are of the high-salinity NaCl-rich type.
29
FIGURE 6; SUMMARY OF RELATIVE CHRONOLOGY OF ROCK "ELEMENTS" AND FLUID INCLUSIONS IN SAMPLE 73518
1100 OR^EBODY, 17D LEVEL. 5031N 1811E SlLICEOUS ORE CUT BY FIBROUS VEINS
CHALCOPYRITE OJ
0
ROCK "ELEMENTS" IN ORDER OF TIMEFORMATION OF
1. Originally fibcous quartz veins, but now partly reccyskallized.
2. Veins with parallel fibres of quartz and some dolomite, each fibre undeformed with uniform extinction. Veins 2 cut veins 1.
3. Patchily developed quarkz-dolomite- chalcopyrite veins which are discordant to all earlier veins. Clear quartz associated with chalcopyrite is in optical continuity with invaded quartz.
FLUID INCLUSIONS
Small-bubbled aqueous inclusions in grain boundaries, but also in grain interiors.
Small-bubbled aqueous inclusions mainly primary in origin because each fibre contains a distinctly different abundance of inclusions, and fibre boundaries often have fewer inclusions than fibre cores. Healed fractures which cut several fibres are relatively rare.
If the clear quartz Is interpreted as an overgrowth on the invaded quartz 1 and 2, during grain boundary adjustment between the chalcopyrite and quartz, the care inclusions could be primary lineage-boundary inclusions, c.i's'o-ii -
IL-u2 £<^L., Cf-i A? :... -'•-/^.^')'-"-t^
,'y.^:y CLEAR QUARTZ '.•;.J-'.S.";;'
? OVERGROWN ON ••'.."'.' INCLUSION-R1CH ';?.',.'' QUARTZ •:•,?-;
? PRIMARY LINEAGE ^.•'\;
BOUNDARY INCLUSIONS ' .'•'.^:;.:.-
•'"y-^:
'•<.'-''s
FIBROUS QUARTZ ^•'•••"•••'A WITH ABUNDANT '.i-,;.<
SMALL FLUID ';';'•.'
INCLUSIONS
100pm
The fibre veins in turn are cut by patchily developed quartz-dolomite-chalcopyrite veins. The clear quartz associated with the introduction of the chalcopyrite is in optical continuity with the invaded quartz and typically occupies embayments in the chalcopyrite patches. Wilkins (1982) suggested an interpretation of this texture which involved the clearing of fluid inclusions along a front which preceeded the replacing chalcopyrite. The more extensive set of samples now available suggests an alternative explanation as more likely. In this interpretation the clear quartz represents overgrowths on the invaded quartz formed during grain boundary adjustment between the chalcopyrite and quartz. Trains of fluid inclusions which finger out from the inclusion-rich invaded quartz into the areas of clear quartz (Fig.6) are sometimes associated with slight contrasts in extinction. This is a very unusual feature to be associated with healed fractures. In addition the trains of fluid inclusions commonly fade out before they reach the quartz- chalcopyrite boundary. The best explanation of the origin of these inclusion trains seems to be that they represent primary inclusions trapped along lineage boundaries. These and clearly secondary inclusions on cracks extending from the chalcopyrite grain boundary into clear quartz have a similar, and distinctly lower salinity than the inclusions in the fibrous quartz (Appendix II), and they indicate that a fall in sallnity has occurred in this time interval. These two NaCl-rich aqueous fluids bracket the introduction of the chalcopyrite and provide the best indication at present of the composition of the ore- forming fluid. Two additional types of fluid inclusions present in quartz crystals in a local vugh, were probably trapped even later. One is a dilute NaCl-dominant fluid and the other is a CaCl^-rich brine (see Appendix II).
31
Summary
A local CO^-r.ich fluid appears to have existed relatively early in the sequence of fluids now preserved in the host rocks of the Mt Isa copper orebodies. It may have existed at the same time as the ubiquitous early saline aqueous fluid, though not in equilibrium with it. It is possible that the CO^-rich fluid was displaced by the influx of the NaCl-rich saline fluids which eventually emplaced the chalcopyrite ore. There Is some chronological evidence of a fall in salinity of the aqueous NaCl- rich fluids with time. A CaCl^.rich fluid of unknown genetic relationship to the NaCl-rich fluids seems to have been trapped latest in the sequence of fluids which pervaded the host rocks of the orebody.
32
GEOTHERMOMETRY AND BAROMETRY
The homogenization temperature data on the various types of inclusions presented in Figs. 1 and 2 only provide minimum temperatures for their trapping. If they have been trapped at pressures exceeding that of the 2-phase or boiling curve, a pressure correction has to be added to the homogenization tempe- rature. It is generally assumed that fluid inclusions have origi- nally been trapped as a homogeneous fluid, and that they have not appreciably changed their total volume subsequently. Under these conditions the true P-T conditions of entrapment are constrained to lie on isochores, or curves of constant total density. Iso- chores of fluids approximating those of the Mount Isa fluid inclusions can be constructed from published experimental data.
Additional brackets on the possible true entrapment conditions can be placed on the basis of the stability of mineral assem- blages, and by some geological assumptions which are presented here for the purpose of future discussion.
Isochores for chloride-rich aqueous fluids
Experimental PVT data for the system NaCl - H^Q are available throughout the P - T - salinity range of most aqueous inclusions from the orebodies. They have been collated and least- squares fitted by Potter and Brown (1977). Their data for the binary system can be applied directly to the inclusions of Group 2, and errors due to the presence of some KC1 and low amounts of volatiles other than H^Q are small compared to the spread in homogenization temperature observed in each sample. Below 300 deg C, the slopes dP/dT of the isochores in the NaCl - RyQ system decrease with increasing salinity, but the dependence on salinity is weak in the range of 10 to 25 wt% NaCl (e.g. Crawford, 1981,
33
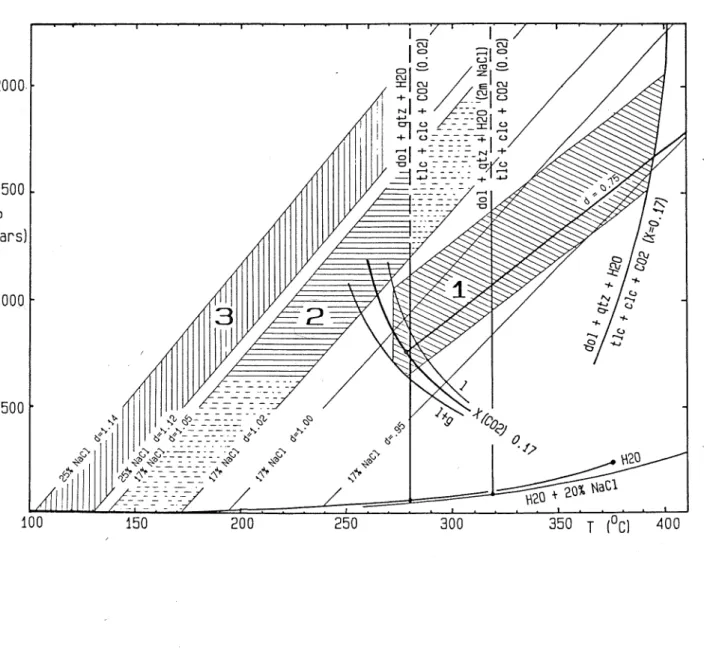
Figure 7: P-T diagram showing estimated fields of formation of the three main groups of fluid Inclusions. Group 1 = CO^.rich inclusions; Group 2 = NaCl-rich aqueous inclusions, mostly from siliceous alteration; Group 3 = late CaCl^rich inclusions. See text for discussion and sources of experimental data used to define the fields.
2000.1-
500
100 150 200 250 300 350 T (°C) 400
34
Fig. 4.12). Fig.7 shows isochores for the densities d=1.05, 1.02, 1.00, and 0.95 for aqueous solutions with 17 wk.% NaCl, and for d=1.l4 and 1.12 for solutions with 25 vt.% NaCl, interpolatd from
the tables given by Potter and Brown (1977). 'iro '— 'o l.r'!l.,_
Stability and isochores of CO^-pich fluids
The fluid inclusions containing liquid CO^ at room temperature (Group 1) are of particular importance in this study, because their estimated composition and density provides the best indication of the minimum fluid pressure, and by interpretation, the minimum depth required for their homogeneous entrapment. Low-temperature microthermometric data shows that the C02-rich inclusions in 73542 and BP13 are essentially binary mixtures of CO^ and H^O. The mole fraction X(CO^) = 0.17 +- 0.04 was derived for 73542 from the estimated volume ratio at 40 deg C, V(CO^liquid) / VCH^O,liquid) and the gas-to-liquid homogenization temperature of CO^, which defines the internal pressure and thus the the density of the liquid CO,, phase. The largest error in this estimate stems from the uncertainty in the measurement of the volume ratio. The approximate graphical method of Burruss (1981, p.61) applied in the derivation of the mole fraction is therefore adequate. The CO rich fluid in BP13 has closely similar properties (Fig.1).
The two-phase curve separating the P-T fields of a single homogeneous fluid from the field of a coexisting H^o_rich liquid + supercritical CO -rich gas has been measured by Takenouchi and Kennedy (1964) and by Toedheide and Frank (1963). The data by Toedheide and Frank (1963) were used to construct the two-phase curve (1/1+g) for constant X(CO^) ag 5 function of P and T shown in Fig.7. In combination with the measured temperatures of final
35
homogenization (273 +- 5 deg C, see Appendix II, 7351t2), these curves indicate a minimum pressure of 750 +- 100 bars for the formation of these inclusions.
The true pressure (and temperature) of entrapment may be considerably higher, but the position of the isochores for CO^ » K^O fluids are not well known in the temperature - composition range of interest. Experimental PVT measurements are available mostly for supercritical mixtures of COy and HoO (i.e. at temperatures above 400 deg C) , which have been fitted to a Redlich-Kwong equation by Holloway (1981; program ISOCHOE, corrected for printing errors by G.Hladky, pers. comm.). The extrapolation of the isochore fit to lower temperature used in Fig.7 (e.g. for a fluid with X(CO ) = 0.17 and a density of d = 0.75 g/ccm) to delineate the area 1 shown by diagonal ruling is therefore somewhat uncertain. The important feature that the isochores for CO rich fluids are less steep than those for aqueous fluids, is correct.
The stability of dolomite + quartz + fluid
The assemblage dolomite + quartz + fluid has an upper stability limit set by the decarbonation reaction
+ 4 SiO., + H,0 = Mg^Si^O^(OH)^ + 3 CaCO^ + 3 CO,
del " ' qtz'- c- ~^ lal'c c~ clc:
(D
/ Dolomite + quartz are ubiquitous and have at least locally been precipitated together in some veins (e.g. 73510, 735it0; see Appendix II). In contrast, the assemblage tale + calcite has never been observed in the Mount Isa silica-dolomite alteration system so far (HIM Staff, pers. comm.). This suggests that equi- libriura (1) has not been overstepped during the alteration
36
process.
Equilibrium curves for reaction (1) have a positive slope in T - X(CO^) space, with dol + qtz on the low-T / high-X(CO^) side. They therefore place an upper limit on the temperature during the formation of the assemblage dolomite + quartz + fluid, provided that an upper limit for X(CO^) in the coexisting fluid can be defined independently, for example from fluid inclusion data.
Reaction (1) has been studied experimentally in detail (Skippen, 1971; 197i<» with earlier references), but exclusively at P(fluid) - T conditions in the supercritical range of the CO,
~ H20 system. The thermodynamic evaluation of the experimental results by Skippen (197-4» eq. 10) and their extrapolation to lower temperatures and pressures are based on the assumption of ideal mixing of non-ideal gaseous H Q and CO^. This is probably valid down to about 350 deg C and 500 bars and has been used to calculate the curves at X(CO ) > o.1 in Fig.8, and the contour at constant X(CO^) = 0.17 in the P-T diagram Fig.7.
However the same assumption is certainly not adequate to describe dilute solutions of CO in subcritical liquid water at temperatures below 300 deg C, where unmixing shows thafc the CO^, -
U^O system is highly non-ideal. Fortunately the solution behaviour of dilute CO^ ^ liquid water is well known over the T- X range of interest from measurements of Henry's constants (Ellis and Golding, 1963; Naumov et al. 1972t> P. 246). Henry's law was found to be valid up to at least X(CO ) = Q.02 and T = 300 deg C by Ellis and Golding (1963). The low-temperature portion of the equilibrium curve (1) (Fig.8) has therefore been calculated using thermodynamic data for aqueous CO given by Naumov et al. (1974)
37
which are based on measured Henry's constants. Data for dolomite, quartz, calcite and liquid H^Q at saturation (neglecting K 0 compressibility at moderate P > P(sat)) were taken from Turnbull (1981; CPDMRLDATA), and for tale from Robie et al. (1979). Fig.8 shows that within a realistic uncertainty limit caused by +- 1000 cal/mol in the free energy of reaction (indicated by the vertical error bar), the low-temperature equilibrium curve smoothly links up with the curves extrapolated downward from the data given by Skippen (1974) at 500-2000 bars.
400
0
2m NaCl P (sat)
taic^it^^-
?; ^"';^°' 1000
500
1000
100
0.0 0.1 0.2 0.3
X (CO )
Figure 8: Diagram of temperature vs. mole fraction of CO 2>
showing the upper thermal stability limit of dolomite + quartz + fluid (heavy lines) and two contours of the two-phase surface of the binary CO^ - H^O system (fine lines). All contours are for constant pressure, labelled in bars. See text for discussion.
38
The solubility of gases in aqueous solution generally dec- reases with increasing electrolyte concentrations. This "salting- out effect" has been measured for CO^ m HpO - NaCl solutions at high temperatures by Ellis and Golding (1963), for salinities up to m(Nad) = 2 mol/kg H Q. This effect will also shift mineral - fluid equilibria involving aqueous CQ (or HpCO^). The decrease in CO^ solubility can be expressed as a positive deviation from ideal solution behaviour of aqueous CO., in a saline solution relative to that in pure water. The ratio between the activity coefficients Y° (CO^) and y111 <CO^), respectively, in pure H^O and in a solution of salinity m(NaCl) can be calculated from
,m
log —- = k m(NaCl)
0
where the positive constant k is called the Setschenow- coefficient, as given by Ellis and Golding (1963, Tab.9) and Naumov et al. (1974, p.249). Fig.8 shows the calculated effect of this non-ideality for m(NaCl) = 2 (11 wt.% approx.) on the position of eq. (1), which is shifted to markedly higher temperature, thus extending the stability field of dolomite + quartz + fluid. Similar to the salting-out effect which increases with increasing temperature, the T-shift of the decarbonation reaction (1) caused by high salinity also becomes more important at progressively higher temperature.
Two contours for constant low X(CO^) = 0.02, and m(Nad) = 0 and 2 mol/kg, are shown in Fig.7, at temperatures calculated for a low pressure near the H Q boiling curve. The curves are shown as vertical lines, because the pressure-dependence of these curves will be weak compared with that of the high-temperature
39
contour for X(CO^) = Q.17. Unfortunately the true, probably steeply positive, slope cannot be calculated because the partial molar volume of CO^ in subcritical aqueous liquid is not known.
Interpretation and discussion
With the presently available data, reliable constraints on the P-T conditions of the silica dolomite alteration system are not very tight, but nevertheless significantly different P-T fields seem to emerge for different types of mineral and fluid inclusion assemblages. Their interpretation in terms of a P-T- time evolution of \the alteration system relies on the interpretation of the relative chronology of fluid inclusions in relation to mineral textures (see previous chapter), which needs
^ , ^ -i^-Y /.,,^... ^..//1 c-^-/ j:/:.j~^" <-=
to be more firmly established by future work. " ^ ^ , • ,, .^,^
Quartz - dolomite assemblages with CO^-pich inclusions have been found only in samples of predominantly dolomitic breccia, and in these samples the fluid inclusions containing liquid CO, are relatively early and possibly in part primary. This and the general structural relation of dolomitic breccia being later overprinted by silicic and chalcopyrite-rich alteration suggests that the P-T condition estimated for the association of quartz + dolomite + CO^-pich fluid represent a relatively early stage in the silica dolomite alteration history. These P-T conditions probably lie within the diagonally shaded area of Fig.7> at temperatures between 275 and 400 deg C, and pressures between 750 and 2000 bars. Taking a rock density of 2.6 g/ccm, assuming lithostatic conditions, and neglecting rock strength, this minimum pressure of 750 bars corresponds to a minimum depth of 3 kilometres below earth surface.
40
Both samples with CO^.rich inclusions studied so far also contain saline, smaller-bubbled aqueous inclusions without visible condensible gas. These homogenize over a large temperature range, with a weak maximum at 190-250 deg C, i. e.
higher than the saline aqueous inclusions associated with siliceous alteration (Fig.1 and 2) . The isochores for 17? NaCl and densities d = 1.00 and d = 0.95 (fine lines in Fig.7) show that these fluids could have been trapped at the same range of P- T conditions as the CO^-rich fluids. The possibility exists that the two chemically distinct fluids have been present in the rocks
('
at one set of P and T, and possibly even essentially at the same time. This interpretation .is unproven so far, but it is compatible with the textural interpretation reached in the previous chapter, that the CO nch inclusions are invariably associated with aqueous inclusions which seem to both pre- and postdate the entrapment of the CO^.nch inclusions. Of course, the two fluids could not have been coexisting in chemical equilibrium bebause they would be miscible.
Overall, the CO^-rich fluids are rare, even in dolomitic breccia where they ave been exclusively found so far. While they are important for geobarometry, they may be a rather local feature. The P-T box marked "1" in Fig.7 should definitely not be equated with the formation of the dolomitic alteration as a whole, where good fluid inclusion information is still sparse.
Faults and shear zones: Homogenization temperatures and total salinities of aqueous inclusions found in the M52 fault cutting the 1100 orebody (67666), and in quartz veining in the mylonitic quartzite underlying the orebodies (73603, considered a possible feeder zone for hydrothermal fluids) largely overlap with the properties of the saline aqueous fluids in 7351t2 and
41
BP13. It is not known wether this is coincidental.
Siliceous alteration and quartz-chalcopyrite veining is in- variably associated with abundant aqueous saline, NaCl-rich inclusions (Group 2), which in all samples homogenize in a narrow temperature range, mostly between 140 and 180 deg C. It is very likely that Group 2 fluids include the main agent of silicic alteration, and probably copper introduction as well.
The isochores defining the horizontally ruled field "2" in Fig.7, show that these fluids must have been trapped at slightly but significantly different P-T conditions than the CO^-r.ich inclusions afield "1").
Independent constraints for their entrapment pressure and true formation temperature are tentative so far. Since the mineral textures clearly suggest that dolomite is dissolved and replaced during siliceous alteration, it cannot be tacitly assumed that the fluid was in chemical equilibrium with both dolomite and quartz. However, newly grown dolomite is present in many quartz-sulfide veins and fibrous quartz-dolomite veins, with both minerals containing these fluids as inclusions. This and the absence of tale + calcite suggests that dolomite saturation was probably closely attained, and that equilibrium (1) was not generally overstepped by any of the aqueous fluids. On the basis of this argument, an upper limit on the P-T conditions of the siliceous alteration is estimated to be 320 deg C and 2000 bars (Fig.7). This estimate may be tightened up when some more Raman probe results confirm the probably very low CO -contents of the aqueous saline inclusions.
42
So far we have no direct and independent information which would allow the determination of a lower limit on the true temperature of the silicic alteration, other than the homogenization temperatures themselves. Any progress here will largely depend on indirect geological arguments.
For example, unless any positive evidence contradicts this, it may be a realistic assumption that temperature varied faster than load pressure during the formation history of a mineral deposit which does not involve any boiling (for which there has not been found any fluid inclusion evidence at Mount Isa) . Under this assumption, the same minimum pressure as required for the formation of the CO^.nch inclusions has also persisted during siliceous,, alteration. Only under this assumption can the lower
't
homogenlzation temperatures of the aqueous saline inclusions be interpreted to represent truly lower temperatures than prevailing during the trapping of the CO^r.ich inclusions. The P-T conditions of silicic alteration and chalcopyrite mineralization would then have to lie within the field of solid horizontal ruling ("2") in Fig.7.
The assumption of relatively minor pressure variation during the evolution of the silica dolomite system should be assesed in the context of sedimentological-paleogeographical and structural- geological observations: Are there any indications for fast up- lift and erosion during mineralization, or for any phase of large-scale deformatioh or thrusting intervening between the dolomitic alteration and its silicic overprinting ?
PVT-data for CaCl^.pich fluids have not been experimentally measured but the error introduced by applying NaCl - H,,Q isochores is probably not severe. The representative isochores
1<3
for 25 wb.% NaCl used to define field "3" in Fig.7 shows that the late CaClg.pich brine inclusions were formed at significantly different conditions than the NaCl-rich inclusions, probably at lower temperature.
3~
^
PART 2 SULFUR ISOTOPE STUDIES
SAMPLES SELECTION AND ANALYTICAL METHODS
Many of the samples analysed for this study had been previously collected and prepared by Brian Gulson for lead isotope studies (Gulson et al, 1983). The samples analysed were those whose sulfides had been separated by froth flotation and magnetic techniques.
Samples of bedded pyrites from the vicinity of the 1100 ore body were taken from polished blocks by a small diamond drill.
Impurities were predominantly sulfur-free material. These blocks were then available for studies of pyrite textures.
Tifee problem of finely crystalline and intergrown sulfides cannot be ignored. It was considered that the problems of chemical separation (Smith and Croxford, 1973) were more significant than the problem of small inclusions in physically separated material. Because of the imperfections in mineral separation of this material, the results presented here are not generally of the quality necessary for sulfur isotope geothermometry. Sulfur isotopes are particularly sensitive to this problem because of the small fractionation between sulfides.
We rely on fluid inclusion studies for temperature data. However we consider gross variations and reversals in the expected order of isotope fractionation to be real.
The prepared sulfide separates were converted quantitatively to sulfur dioxide by combustion at 1100°c with cuprous oxide in an evacuated quartz tube (Kaplan et al., 1970). Isotopic analysis of the SO^ ga3 were made in a Micromass 602B mass spectrometer dedicated to sulfur isotope analysis. Analyses are made relative
45
to a laboratory standard (834s=o^g permil) with a second standard (634S=20.2 permil) used to calibrate the machine.
Sulfur isotope values are reported as 6 values or permil (O/oo) deviations from the sulfur isotope value of troilite from the Canyon Diablo (CDT) meteorite, where
634s permil = 34S/32S( sampler- 1 * 1000 TS/;IZS(CDT)
Routine analytical precision is ±0.1 permll but within the limitations of the separation techniques and inhomogeneities in the sample, the precision should be considered .±0.2 permil for the results presented here.
RESULTS
The main aim of the sulfur isotope aspect of this project was to consider possible sulfur sources. To do this it has been necessary to first establish the sulfur isotope oomposition of the orebodies and any spatial patterns that may emerge from these results. Secondly it is necessary to establish the isotope signature of possible sulfur sources. In the mine area by analysis of appropriate material, especially the host stratigraphy, and remote from the mine by analysis where possible but largely by analogy. A thorough 'first pass' at these aims has been completed and is described below. Further sampling and analysis should be restricted to specific problem areas.
The isotope data are given in Table 3 and plotted on Figs.
9. Samples were analysed from the main orebodies :- 1100, 3000- 3500, 1900, 650, 500 and 200 as well as the smaller 400 and 700 orebodies. Other rock types analysed include carbonaceous mylonite, the Buck Quartz, greenschists, Eastern Creek Volcanics, a zone of intensely altered Eastern Creek Volcanics
46
TABLE 3: Sulfur isotope values for Cu orebodies. Values in permil CDT.
Orebody Level Location Sample Mineral
200 200 200 200 200 400 400 400 400 400 400 400 400
400-700 400-700 400-700 400-700 400-700 400-700 400-700 400-700500 500 500 500 500 500 500 500 500 500 500 500 500 500 650 650 650 650 650 650 650 650 650 650 650 650 650 650 650 650 1100 1100
17 5L 5L 6L 6L 9L 9L 9L 9L 9L 9L 9L 9L 9L 9L 9L 9L 9L 9L 9L 9L 10L 10L 10L 10L 13L 13L 13L 13L 13L 13L 14L 14L 14L 10L 10L 10L 10L 10L 10L 10L 12L 12L 12L 12L 12L 12L 12L 12L 13L 13L 15D 16B
l5-~
S632 Whor 41.' S632 Whor 86.!
Q626 Ehor 30.:
Q632 Whor 44.1
5388N 1714E 5388N 1714E 5388N 1714E 5382N 1693E 5415N 1619E 5415N 1619E 5415N 1738E 5415N 1738E 5415N 1770E 5415N 1770E 5415N 1774E 5415N 1774E 5413N 1798E 5413N 1798E 5415N 1871E 5415N 1871E 6503N 1512E 6516N 1507E 6510N 1505E 6510N 1505E
H613 E 1 136.;H613 E 1 141.'
7200N 1600E
J632 Wine 50. (.9m .8m ,5m ,8m
,3m ,7m
,0m
J645 W h 42.5m J645 W h 53.2m
6503N 1512E 6935N 1375E 6935N 1361E 7062N 1387E 7062N 1391E 7062N 1396E 7062N 1396E 6955N 1376E 6955N 1376E 6955N 1376E 6962N 1380E 6954N 1383E 6954N 1383E
H678 E d 66.9m H678 E d 74.1m 5180.5N 1707E
4515N 1898E
K194 20 K195 K196 K197 K607 K607 K607 K608 K609 K609 K610 K610 K611 K611 K612 K612 K613 K613 K614 K614 K604 K605 K606 K606 K198 K199 K616 K616 K616 K574 K201 K192 K193 K604A 38 39 K597 K598 K599 K599 K600 K600 K600 K601 K602 K602 K603 K603 K190 K191 41 12
PO CPY CPY CPY PO CPY py CPY CPY CPY PY CPY PY CPY PY PY PO CPY PY CPY PY py PY CPY PY CPY CPY CPY PY PO CPY CPY CPY CPY PY CPY PY CPY PY CPY PO
CPY aCPY b
CPY cCPY CPY PY CPY PY CPY CPY PY CPY
8.0 9.9 18.8 11.3 14.0 14.3 14.3 17.2 19.0 21.1 23.9 13.8 18.1 15.6 16.7 12.0 12.3 12.8 11.5 13.0 14.0 15.6 11.4 18.7 18.9 10.0 15.5 13.1 13.7 13.4 12.2 13.0 14.1 16.3 15.8 10.9 14.6 15.4 11.6 14.6 11.7 16.2 15.8 16.0 15.2 14.0 17.1 15.8 13.6 8.8 13.4 17.9 13.1