Mozambique's Economic Transformation
Frank Vollmer
Are efforts to streamline the fragmented
aid landscape undermined for good?
Are efforts to streamline the fragmented aid landscape undermined for good?
Frank Vollmer
Bonn 2013
Die deutsche Nationalbibliothek verzeichnet diese Publikation in der Deutschen Nationalbibliografie;
detaillierte bibliografische Daten sind im Internet über http://dnb.d-nb.de abrufbar.
The Deutsche Nationalbibliothek lists this publication in the Deutsche Nationalbibliografie; detailed bibliographic data is available in the Internet at http://dnb.d-nb.de.
ISBN 978-3-88985-615-9
Frank Vollmer, German Development Institute / Deutsches Institut für Entwicklungspolitik (DIE), Researcher, Department "Bi- and Multilateral Development Cooperation" / Project: "Development Policy:
Questions for the Future. Visibility and Division of Labour in the Context of More Effective Development Cooperation"
E-mail: frank.vollmer@die-gdi.de
© Deutsches Institut für Entwicklungspolitik gGmbH Tulpenfeld 6, 53113 Bonn
+49 (0)228 94927-0
+49 (0)228 94927-130 E-mail: die@die-gdi.de http://www.die-gdi.de
Mozambique is undergoing a strong transformation in its economic structure. This – mostly resource-led – transformation has not only attracted “new donors” such as China and Brazil; it has also impacted on efforts to make development assistance in Mozambique more effective by better harmonising Mozambique’s aid system. For instance, the anticipated resource boom acts as a disincentive for the government to lead efforts to better streamline Mozambique’s aid architecture, because it anticipates that its aid dependency will decline in the coming years. On the other hand, traditional donors with stagnating or declining aid shares do not want to exit this (potentially) emerging economy, despite the argument that their transaction costs offset the potential development outcomes from their aid provision (e.g. transaction costs for reporting that burden the administrative capacity of the government). Thus, opportunities aside, the economic transformation also bears challenges for development cooperation between Mozambique and its development partners. Efficiency gains through greater rationalisation are untapped as commercial and geo-strategic interests of the current 36+ donors present in Mozambique supplant development objectives. Based on a desk review and field research, the paper assesses how the economic transformation affects attempts of the traditional donor community, the emerging donors and the government of Mozambique to overcome donor proliferation and aid fragmentation in Mozambique.
Keywords: Donor Proliferation, Aid Fragmentation, Division of Labour, Mozambique, Political Economy, Collective Action
Abbrevations
Introduction 1
1 Mozambique’s economic transformation: aid less important but still
crucial 5
2 Fragmentation of aid 7
2.1 What is fragmentation, how is it measured and what methodology is used to
define a “significant” aid relation? 7
2.2 What causes fragmentation and why is it problematic? 9 2.3 What is known about the fragmentation of aid and the proliferation of donors
in Mozambique? 12
2.4 What are the tools available to address fragmentation? 16 2.5 Tackling fragmentation of aid in Mozambique: What are the institutional
mechanisms of coordination? 19
2.6 Overcoming fragmentation of aid in Mozambique: assessment against DoL
principles and implementing strategies 23
3 Efforts to reduce aid fragmentation since PARP III: What impact does the looming resource boom have on efforts to overcome aid
fragmentation? 27
3.1 “Pockets of effectiveness” 28
3.2 Challenges of aid coordination 32
4 Political economy of aid and collective-action problems: What are the
biggest hurdles to harmonise aid better? 35
5 Conclusion 38
Bibliography 41
Appendices 47
Appendix 1: List of interviews 49
Appendix 2: Aid fragmentation: the partner-country perspective (2005–2009) 50 Appendix 3: New WG structure under the objectives of PARP III 57 Appendix 4: Fragmentation on the basis of sectoral allocable CPA data: disburse-
ments in 2010 (Mozambique) 58
Appendix 5: Fragmentation on the basis of sectoral allocable CPA data: disburse-
ments in 2011 (Mozambique) 59
Fig. 1: Aid to Mozambique at a glance 3 Fig. 2: Official development assistance and FDI (US$bn) 5 Fig. 3: Stages and elements for drawing up and implementing DoL agreements 17 Tables
Tab. 1: Number of donors in Mozambique vs. global and African averages 2 Tab. 2: Non-significant aid relations (based on data from 2009) 13 Tab. 3: Donors on display for rationalisation and efficiency gains 15
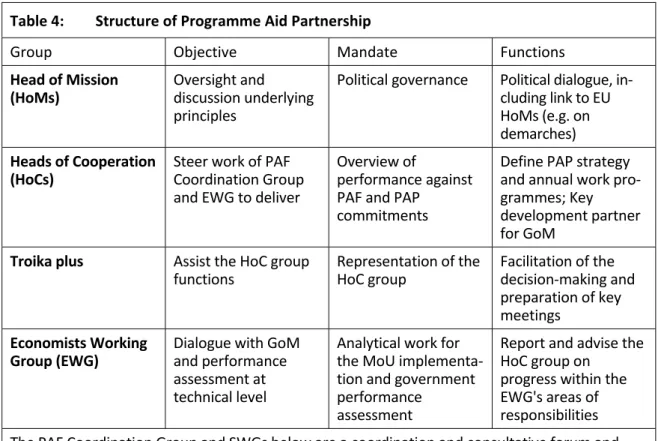
Tab. 4: Structure of Programme Aid Partnership 20
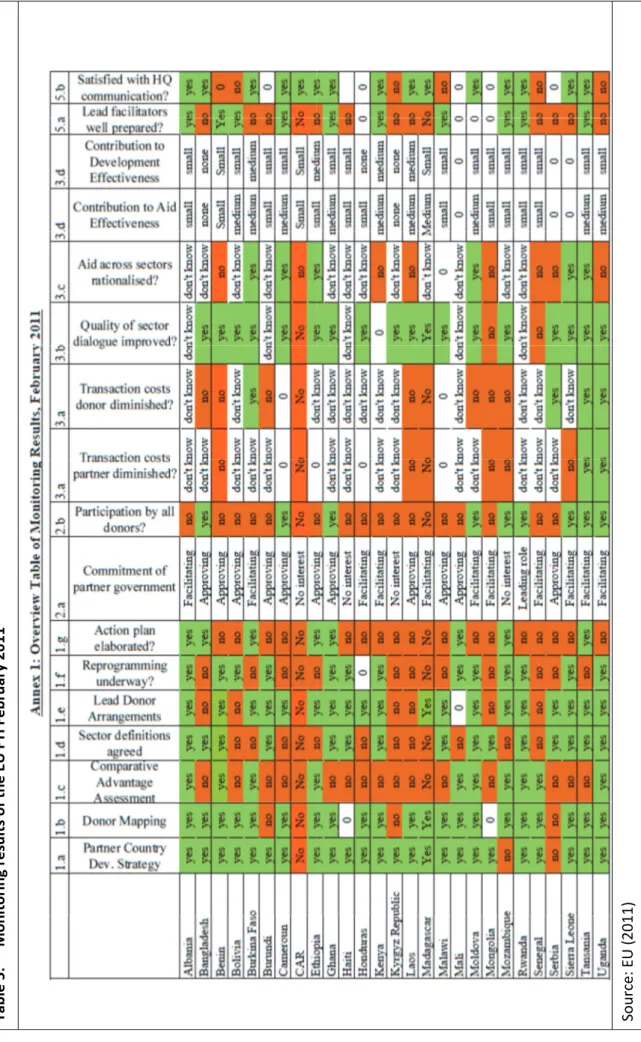
Tab. 5: Monitoring results of the EU FTI February 2011 26 Boxes
Box 1: Joint Action Plan 21
AfDB African Development Bank BPA Busan Partnership Agreement
BS Budget Support
CoC Code of Conduct
CPA Country Programmable Aid CRS Creditor Reporting System
DAC Development Assistance Committee (OECD)
DaO Delivering as One
DIE Deutsches Institut für Entwicklungspolitik / German Development Institute
DoL Division of Labour
DPG Development Partners Group
ECDPM European Centre for Development Policy Management
EU European Union
EWG Economists Working Group FTI Fast Track Initiative
FDI Foreign Direct Investment
FRELIMO Frente de Libertação de Moçambique (Front for the Liberation of Mozambique)
G19 see PAP
GAVI Global Alliance for Vaccines and Immunisation GBS General Budget Support
GDP Gross Domestic Product GEF Global Environment Facility
GFATM Global Fund to Fight AIDS, Tuberculosis and Malaria
GNI Gross National Income
GoM / GdM Government of Mozambique / Governo da República de Moçambique
HQ Headquarters
HoC Head of Cooperation HoM Head of Mission
IAEA International Atomic Energy Agency
IFAD International Fund for Agricultural Development IMF International Monetary Fund
JP Joint Multi-Annual Programming MINEC Ministry of Foreign Affairs MinFin Ministry of Finance
MoU Memorandum of Understanding MPD Ministry of Planning and Development MT / MZN Metical (unit of Mozambique’s currency) ODA Official Development Assistance
OECD Organisation for Economic Co-operation and Development PAP Programme Aid Partnership (also known as G19)
PAF Performance Assessment Framework
PES Balanço do Plano Econòmico e Social (Economic and Social Plans) PD Paris Declaration on Aid Effectiveness
PRSP see PARP(A)
SWG Sector Working Group
TF Task Force
TFWGDL Task Force on Working Groups and Division of Labour ToR Terms of Reference
UN United Nations
UNDP United Nations Development Programme UNFPA United Nations Population Fund
UNICEF United Nations Children’s Fund UNTA United Nations Transitional Authority
USAID United States Agency for International Development
WG Working Group
WP-EFF Working Party on Aid Effectiveness (OECD-DAC)
Introduction
Interviewer: Mozambique has traditionally been quite reliant on development assistance from donors. Now that you are discovering new wealth and new resources, how do you think your relationship with development partners should evolve, notably with the EU?
Guebuza: I believe the relationship has to continue. But the relationship will probably change in the sense that as time goes on, and as we have more resources in our budget, we are going to need more business and commercially oriented relations with those countries that have traditionally provided development funding. It will shift as time passes; in about 10 years time we will not be relying on donations like we are today. We can expect a gradual shift in the focus of the relationship. – President Armando Emílio Guebuza of Mozambique in an interview with the European Centre for Development Policy Management (ECDPM 2012, 2)
What constitutes ineffective aid? Since the first High Level Forum on Harmonisation of the Development Assistance Committee (DAC) of the Organisation for Economic Co- operation and Development (OECD) in Rome in 2003, it is a key understanding that the continuous proliferation of providers of development assistance and the fragmentation of aid in the partner countries is harmful, creates efficiency losses and undermines the potential of official development assistance (ODA) to be applied in its most effective way.
Therefore, managing aid effectively requires curbing the proliferation of its providers and streamlining its delivery on the ground. To this end, the Busan Partnership Agreement (BPA) – whilst welcoming the “diversity of development co-operation actors” under §25 – calls on developing countries to “lead consultation and co-ordination efforts to manage the diversity at the country level”, while “providers of development assistance have a responsibility to reduce fragmentation and curb the proliferation of aid channels.” In the good tradition of the Paris Declaration on Aid Effectiveness (2005) and Accra Agenda for Action (2008), the Partnership Agreement warns that efforts to reduce fragmentation shall
“not lead to a reduction in the volume and quality of resources available to support development.” It calls the signatories to “make [by 2013] greater use of country-led co- ordination arrangements, including division of labour, as well as programme-based approaches, joint programming and delegated co-operation.” Additionally, “[p]roviders of development co-operation will deepen and accelerate efforts to address the problem of insufficient delegation of authority to their field staff” (OECD 2011a).
At the policy level, this is a clear directive. Though how is this operationalised at the country level? What challenges appear that can explain the perceived gap between normative reasoning and practical implementation? After all, the challenge to harmonise aid – although at the core of the aid-effectiveness agenda since its began – is still apparent and probably even greater today than it was in 2003.
To this end, the paper analyses an acknowledged case of a convoluted aid system, namely Mozambique. Mozambique is a low-income country with a population of 23.9 million and had a gross domestic product (GDP) in 2011 of US$ 12.8 billion, which translates to gross national income (GNI) per capita of US$ 470 (World Bank 2012). In terms of development cooperation, Mozambique is characterised by three features that are important for an analysis of its aid system:
1. Mozambique is an aid-dependent country. ODA to Mozambique amounted to US$
2.05 billion in 2011 – roughly the same amount as over the last three years – of which 82 per cent was delivered in the form of bilateral aid, according to the Creditor Reporting System (CRS) of the OECD (see Figure 1). The five biggest development partners are the United States, Portugal, the European Institutions, the United Kingdom and the World Bank.1 Since 2005, ODA has averaged 22 per cent of GNI, according to the OECD (OECD / Government of the Republic of Korea / UNDP 2012), yet decreased to 16 per cent in 2011. Aid dependency – measured as the ODA share (grants and loans) of the state budget (Orçamento do Estado), which in 2011 consisted of US$ 3.7 billion in revenues, versus expenditures of US$ 4.44 billion, amounting to a deficit of 5.4 per cent of the 2011 GDP (CIA World Factbook 2012) – decreased from 51.4 per cent in 2010 to 39.6 per cent in 2012 and is predicted to decrease further to 31 per cent in 2014 (AfDB et al. 2012; OECD / Government of the Republic of Korea / UNDP 2012).2/3 Thus, although in absolute terms it is stable, aid is losing its relative importance as a source for financing the state budget (yet, aid dependency still exists).
2. Mozambique’s aid landscape is fragmented: according to a report of the OECD on cross-country fragmentation of aid based on data from 2009 (2011b), Mozambique received US$ 1.8 billion in country programmable aid (CPA) and is characterised by a) an above-average presence of donors overall (36: 20 DAC countries and 16 multilateral agencies) versus the global average (21: 11 DAC countries and 10 multilateral agencies) and 24 per country in Africa; and b) by an above-average presence of DAC donors (20 vs. the African average of 12).
Table 1: Number of donors in Mozambique vs. global and African averages
Mozambique Average Global Average Africa per country
36 21 24
Source: Author’s own compilation based on OECD (2011b)
This proliferation of actors explains partly the high amount of at least 12 “non- significant aid relations” in the country (to be explained in Section 2.1), which ranks Mozambique among the 44 countries with the “greatest opportunities for rationalisation and efficiency gains” (2011b, 7).
1 The Programme Aid Partnership donors were by far the largest aid providers, in the realm of US$ 1.7 billion in 2011 (Bruschi 2012, 9). In terms of aid modalities, project-type interventions constituted the greatest share with US$ 1.26 billion in 2011, whereas General Budget Support amounted to US$ 435 million (according to the CRS). With more than 50 per cent of total bilateral aid flows, social-sector support constituted the largest share, followed by programme assistance and economic- and productive- sector support (please see Figure 1).
2 Please note that the decrease is also due to the appreciation of the Metical (the national currency) over the last two years (Bruschi 2012, 10).
3 The OECD measures aid dependency in another way, which is country programmable aid (CPA) as a share of gross national income (GNI). For Africa, it calculated that “CPA represented on average 2.4%
of GNI in 2010, but [that] in six African countries it was more than 20% [namely Burundi, Cape Verde, Liberia, Malawi, Rwanda, and Sao Tome and Principe].” The report classifies Mozambique into the highest class of aid-dependent countries, those whose share is above 10 per cent – in 2010 it had a 17.3 per cent share, which is expected to decline to 14 per cent in 2013 (OECD 2011c).
3. M (B av un the Ec be po sig This c archite played questio Mozam
4 See Afr
Mozambique Babb / Freem
veraged 8 pe ntil 2017 (in e 18th fast conomist In e substantia ositive trend
gnificantly f combination ecture in lig d by develo
on as to wh mbique (Go
e Klingebiel ( rica.
is undergo mantle 201 er cent annu n 2012, Mo
test-growin ntelligence U ally larger
d is reflecte from US$ 4 n of factors – ght of a loom
opment coo hether, and oM) should
(2012) for in
oing a “dra 2, 1). In th ually and ar
zambique’s g economy Unit actuall than donor ed in the ne 43 million in – declining,
ming resour operation in to what de remain eng
stance, who a
amatic tran he 10 years re predicted s GDP real y in the w ly predicts r support to
et private f n 2009 to U though still rce boom – n this econo
egree, devel gaged and d
asks how mu
nsformation s prior to 2 d to be susta growth rate world) (Bab
that revenu otals by 20 flows to M US$ 568 mil l high, aid d impacts on omic transfo lopment par dedicated to
uch developm
n in its eco 2011, GDP ained at a ra e was 7.4 pe
b / Freema ues of the m 017 (Brusch ozambique, lion in 2011 dependency f the discuss formation4 a rtners and th o the bulky
ment has happ
onomic stru real growth ate of 7.5 p
er cent, ma mantle 2012 mining secto
hi 2012, 9 , which inc 1.
from a bloa sion about th as well as the governm
aid-harmon
pened through
ucture”
h rates er cent aking it ). The or will ). The creased ated aid he role on the ment of nisation
h aid to
agenda in light of the declining importance of ODA for the state budget. Bruschi, for instance, asks what effect the reduced aid dependency – coupled with the geopolitical changes associated with Mozambique’s economic transformation – will have on the relationship between the government and Mozambique’s development partners (Bruschi 2012, 9).
In this paper I will analyse a particular element of the relationship between the GoM and the donor community, their mutual effort to harmonise aid to turn it into a more efficient and effective source for the state budget and, ultimately, for institution-building and for the government structure to improve public-service delivery. The paper departs from the research question whether Mozambique’s economic transformation undermines efforts to streamline the fragmented aid landscape for good.
It comprises two steps of analysis: a desk review that looked at the fragmentation of aid in Mozambique based on quantitative data provided by the OECD, triangulated with relevant secondary literature and 16 interviews conducted between 4–27 September 2012 in Maputo, Mozambique (please see list of interviewees in Annex 1). The interviews were semi-structured and were conducted with various bilateral donors of the Programme Aid Partnership (PAP), the multilaterals the European Union (EU), United Nations Development Programme (UNDP), the World Bank and the International Monetary Fund (IMF), the emerging donor Brazil, civil society and academic representatives, as well as the US Agency for International Development (USAID). The interviews took the quantitative fragmentation analysis of Mozambique as the point for departure and centred on questions regarding attempts in Mozambique to tackle the proliferation of donors and fragmentation of development assistance in 2012 by each actor individually and the Mozambican aid system as such. Thus, the aim was also to offer a political economy analysis for the reasons of the (limited) implementation of in-country division of labour process in Mozambique to streamline the aid system.5
The paper is structured in the following way: in Chapter 1, specifics about Mozambique’s economic transformation and the role of ODA are illuminated. In Chapter 2 “frag- mentation” is “presented”: What is fragmentation? How is it measured? What metho- dology is used to define a “significant” aid relation? This is followed by an “explanation”
for fragmentation: What are the causes for fragmentation and why is it considered a problem? What are the effects of aid concentration on the effectiveness of aid and what are the challenges with the working term “fragmentation”? And finally, what are the tools for greater donor harmonisation? This will help in understanding the analysis of frag- mentation of development cooperation in Mozambique (Section 2.3). Following this, actions are presented for tackling fragmentation in Mozambique (Sections 2.5 and 2.6). In Chapter 3 the most recent efforts on defragmentation are presented and assessed, which were taken following the presentation of the latest Poverty Reduction Strategy Paper (PARPA – Plano de Acção para a Redução da Pobreza Absoluta) in April 2011. Chapter 4 looks into the political economy of aid and collective-action problems in Mozambique that explain successes and failures of attempts to overcome fragmentation. The paper ends with a conclusion that answers the paper’s research question and its implications for Mozambique’s national process to implement the BPA.
5 A call put forward by the Task Team Division of Labour and Complementarity and EU Fast Track Initiative on Division of Labour (FTI) during a regional workshop from 28–29 September 2010 in Uganda on “Country-Led Division of Labour, Progress and Challenges on the Road to HLF 4” (Weingärtner 2010, 26).
1 Mozam GDP r of 7.5 makin
“activ structu revenu (Babb Rovum the fou by 20 in 201 Mozam Mozam (Tradi import to 12 flows per an budge from b Metica that in payme
6 It is tonn estim met
Mozamb crucial mbique is u real growth per cent un ng it the 18 vities in the ural improv ues, while b / Freemant
ma Basin of urth greates 18 – and the 11 with its
mbique’s ec mbique had ingeconomic ts for infras per cent of – which is e nnum by 20 et and conce budget gran ais (MZN) ( n 2011 FDI ents (see Fig Fig
So
s predicted tha nes – will fac mated that t tallurgical coa
bique’s eco undergoing a
rates avera ntil 2017 (in 8th fastest-g e natural re vement in M
attracting tle 2012, 1) ff the coast st reserve in e coal secto first overse conomic out d a trade cs 2012), wh structure and
GDP in 20 estimated at 018 – and su
essional loan nts will fall (approx. US I eclipsed, f gure 2) (Bab gure 2: O
ource: Babb
at South Africa e serious com the Mozambi l, which is of h
onomic tra a strong eco
ged 8 per ce n 2012, Mo growing eco esource sect Mozambique considerab . Particularl of Mozamb n the world or, which tur eas coal exp tlook6 (Babb deficit of U hich was du d mining inv
12. The bal t US$ 2.5 bi upport from ns. Howeve
l by 43 per
$ 0.66 bn) in for the first bb / Freeman Official devel
b / Freemant
a – Africa’s la mpetition from
can reserves higher value th
ansformat onomic trans ent annually ozambique’s
onomy in th tor (coal a e’s external ble amounts ly, newly di bique – esti and which rned Mozam ports, are c b / Freeman US$ 276 m ue to low alu
vestments. T lance of pay illion in 201 m developm er, it is expe r cent year n 2013 (the t time, ODA ntle 2012, 3–
lopment ass
tle (2012, 3)
argest coal exp m Mozambique are 23 billi han South Afr
tion: aid le sformation.
y and are pr s GDP real he world).
nd gas in p sector, gro s of FDI [ iscovered re imated at 70
estimates p mbique into considered t ntle 2012; A million in uminium and This amplifi yments is fin 12 and is pre ent partners ected that su over year same level a A as the ma
–4).
istance and
porter with rec e in the comin ion tonnes), rica’s thermal
ess import In the 10 ye redicted to b growth rate This is mai particular) owing and d
[foreign dir ecoverable g 0 trillion cu predict will a world ex to be real g fDB et al. 2 the fourth d coal prices
ied the curre nanced thro edicted to re s in the form upport for th
to 19.8 bil as around 20 ain source f
FDI (US$bn
coverable coal ng decade, not but quality coal) (Babb / F
tant but st ears prior to be sustain at e was 7.4 pe ainly accred
[that] unde diversifying rect investm gas reserves ubic feet, w allow gas e xporter of m
game-chang 2012).
quarter of s and capital ent account ough a mix
each US$ 4 m of grants he current a llion Mozam 005), which for the bala
n)
l reserves of 55 t due to quant
(Mozambique Freemantle 20
ill o 2011,
t a rate er cent, dited to erpin a export ment]”
s in the which is exports minerals ers for f 2011 l goods
deficit of FDI billion to the account
mbican means ance of
5 billion tity (it is e offers 012, 12).
Mozambique’s budget in 2011 had a deficit of 5.4 per cent of GDP that was expected to increase to 7.6 per cent in 2012 and is expected to increase to 8.3 per cent in 2013 – total expenditure is set to reach approximately US$ 5.8 billion in 2013 (35 per cent of GDP), which constitutes a 7.6 per cent increase relative to the 2012 budget (Babb / Freemantle 2012, 4; CIA World Factbook 2012). Financing the deficit is planned through external financing from development partners (mostly concessional loans and grants), yet the GoM also aims to diversify funding sources for its fiscal policies, which include domestic resource mobilisation – which is growing by approximately 20 per cent year over year and has reached MZN 114 billion (approx. US$ 3.8 bn, which was 23 per cent of GDP in 2012) – and financing on non-to-semi-concessional loans, mostly sought from the IMF under its Policy Support Instrument programme. This means that public debt will grow to approximately 45 per cent of GDP by 2015 – up from 40 per cent in 2012, which already resulted in a 5.6 per cent increase from 33.4 per cent in 2011 (Babb / Freemantle 2012, 1, 3; CIA World Factbook 2012).7
With regards to ODA, it is expected that grants will fall from 8 per cent of GDP in 2012 (constituting 21.3 per cent of the total budget) to 4 per cent in GDP in 2013 (11 per cent of the total budget) (Babb / Freemantle 2012, 4).8 Thus, although aid dependency is declining – particularly by the share of grants – it remains an important element, firstly, to finance the fiscal policies of the GoM, and secondly, to support the social sectors such as education, population and health (please see Figure 1).
This can result in two interpretations on the discussion regarding the fragmentation of aid and efforts to increase the efficiency and effectiveness of development cooperation. Either development partners and the government await and actively pursue a declining aid dependency to a level of insignificance for the state budget that allows them to disengage from the bulky aid-effectiveness agenda; or it can be interpreted to advocate for an even greater imperative to increase efficiency of a declining force that nevertheless remains an important funding source, particularly for financing and sustaining public-sector services.9/10
7 Muianga et al. (2012) correctly highlight the danger of the “current dynamics and patterns of accumulation in Mozambique”, namely that FDI – important as it is – is currently “driven by capital intensive megaprojects and large export markets [with a] focus on primary (unprocessed) products”
and that investments in Mozambique are mainly financed externally, through foreign-aid finances, FDIs and external and internal debt-making (US$ 900 million for 2010–2013). According to the AfDB et al., “[e]xternal debt is expected to double over three years, from the USD 2 billion in 2010, to USD 4.2 billion in 2013” (AfDB et al. 2012, 9). In light of these developments, Hanlon (2013) actually predicts that aid dependence will be supplanted by mineral-resource dependence that possibly carries in its wake social and political conflicts.
8 See also the aforementioned results of the 2011 Survey of the OECD on Donor’s Forward Spending Plans 2011–2013, which predicts a declining programmable aid share to the GNI of 14 per cent in 2013 (OECD 2011c, 35).
9 Although it is loosing its relative importance, ODA remains crucial for the GoM. This is exemplified in the government bill submitted to the parliament in May 2011 to amend the state budget of 2011. The government intended to increase public expenditure by US$ 306.7 million to a total of US$ 4.72 billion, which resulted in a deficit of US$ 2 billion, which has had to be covered by pledged grants (US$ 1.17bn) and loans (US$ 0.82bn) of Mozambique’s development partners (AllAfrica 2011).
10 Mozambique’s economic transformation is certainly a chance to reduce dependency on external financing by the state budget. On the other hand, it remains an open question whether FDI will be successfully turned into a pro-poor instrument. Ramdoo, for instance, asks whether investors will be “a better trigger for Government to improve the delivery of public goods and services or [whether]
If the second view is adopted, it is worth reminding about the possible gains of better harmonisation. By a 2009 estimation, if Europe alone were to have gone ahead and implement commitments of the aid-effectiveness agenda with the harmonisation agenda at its core, some €5 billion in savings and gains could have been made (in 2009 alone). The
“hypothetical gains from a full coordination of country allocation” is actually estimated at €7.8 billion (Bigsten / Platteau / Tengstam2011). To understand why such “efficiency gains” are so easily passed by, it is crucial to get a better understanding of the working term “fragmentation”, which will be dealt with in Chapter 2.11
2 Fragmentation of aid
2.1 What is fragmentation, how is it measured and what methodology is used to
define a “significant” aid relation?
The OECD defines fragmentation of aid at two levels: across and within countries. Across countries, the problem is identified as being “too little aid from too many donors” and within partner countries it is defined as being the “donor spread across many sectors at country level and small project size” (OECD 2011b, 3). The fragmentation of aid is thus closely related to donor proliferation, which is the number of actors that are actively involved in a country.12 The OECD measures fragmentation by the number of aid rela- tions, which is defined as “the sum of all aid activities by a donor or a multilateral agency in a country [measured] by country programmable aid” (OECD 2011b, 4).13 Whereas the OECD applies no financial threshold on multilateral aid relations, a coun- try-level threshold for bilateral donors has been set at US$ 250,000 in order to concen- trate the analysis and exclude the “noise” generated by very small aid relations (“micro-aid relations”).14/15 By applying this threshold the analysis sets forth that, globally,
withering aid [carries] in its wake weathering support to institutional building and better governance structures?” (Ramdoo 2012, 7).
11 Please note that Chapter 2 deals with the literature on aid fragmentation from a purely theoretical perspective. The impact of Mozambique’s economic transformation on efforts to overcome aid fragmentation will be discussed in greater detail in Chapters 3 and 4.
12 In this paper, I follow the distinction put forward by the OECD for aid fragmentation (“the problem at the receiving end”) and donor proliferation (“problem at the donor end of the relationship”) (OECD 2010a, 3). Please note that in the academic literature, definitions vary, for example Knack / Rahman (2007) and Knack / Smets (2012) use the term “donor fragmentation”.
13 CPA is the “subset of total ODA susceptible to programming at country level and for which donors generally prepare multi-year forward expenditure plans. CPA is defined through exclusion, by subtracting from total gross ODA aid activities that are (i) are unpredictable by nature (humanitarian aid and debt relief); (ii) entail no cross-border flows (administrative costs, imputed student costs, promotion of development awareness, and research and refugees in donor countries); (iii) do not form part of co-operation agreements between governments (food aid and aid from local governments); or (iv) are not country programmable by the donor (core funding of NGOs)” (OECD 2011b, 21). Total DAC countries’ CPA was US$ 57 billion in 2010, “representing 55% of DAC countries’ gross bilateral ODA” (OECD 2012b, 16).
14 As the OECD delineates: “Without applying a threshold, there were 3860 aid relations between 46 donors and 152 partner countries in 2009. Of this total, 603 were micro-aid relations, resulting in 3257 aid relations being examined in [the OECD] analysis applying the threshold” (OECD 2011b, 4).
slightly fewer than 4,000 pairs of donor/country aid relations in the landscape including all DAC members and major multilateral agencies [exist]. This is just the tip of the iceberg, and excludes the aid relations of the remaining 200-plus multilateral organisations, emerging donors and other non-DAC donors.
Furthermore, many donors have more than one agency providing aid, which is not taken into consideration in this overall analysis, and which adds to the complexity of the aid architecture [...]. In 2009, the average donor was present in 71 out of 152 ODA-eligible countries (73 for DAC countries and 69 for multilateral agencies).
From the partner country perspective, the average number of donors present in each country was 21 (11 DAC countries and 10 multilateral agencies). (OECD 2011b, 4–5) Based on this analysis, the OECD applies a methodology to define significant from non- significant aid relations in financial terms. An aid relationship is considered significant in financial terms if “the donor provides more than its global share of CPA and/or is among the top donors that cumulatively provide 90% of the CPA to that partner country” (OECD 2011b, Annex B). The first part of the assessment attempts to assess whether the relationship is concentrated from the donor’s point of view; the second part whether the relationship is considered important from the partner countries’ points of view (OECD 2011b, 5–6).16
To help with the analysis, a concentration and fragmentation ratio is constructed based on the donor’s and partner’s point of view whether the donor’s portfolio of aid programmes is fragmented. The “concentration ratio measures the number of donors’ significant aid relations compared to all of its aid relations. The higher the concentration ratio, the less a donor’s portfolio is fragmented”, whereas the “fragmentation ratio measures the number of non-significant donors compared to the overall number of donors. The lower the fragmentation ratio, the less fragmented are the donors’ aid programmes in that country”
(OECD 2011b, 5–6). With this methodology applied, the OECD assesses that the global fragmentation ratio in 2011 – based on 2009 data from the OECD/DAC – was 40 per cent,
“meaning that two out of every five donor-partner country relations are non- significant”,17 whereas the average concentration ratio of DAC countries was 55 per cent in 2009 and 60 per cent of all donors (OECD 2011b, 7, 9). Opportunities for concentration have been identified in 44 countries that have had “12 or more non-significant aid
15 “These micro-aid relations often take the form of non-project technical co-operation, which includes activities such as scholarships, volunteers and trainees and minor grants channelled through NGOs or multilateral organisations, and usually does not bring about any significant transaction costs [note that multilateral donors are not engaged in these types of activities, wherefore “the threshold of excluding aid relations below the level of USD 250,000 is only applied to bilateral donors”]. Nevertheless, micro-aid relations represent 16% of all aid relations (per partner country on average 4 aid relations), but correspond to only USD 50 million or 0.1% of all global CPA” (OECD 2011b, 4–5).
16 Note that this is – as always – a crude indicator on fragmentation. As acknowledged by the OECD, whether a donor provides more than its global share of CPA to the partner country will put a “bias towards smaller donors based on the fact that they are usually involved in fewer partner countries, which makes it less difficult for them at country level to exceed their global share of aid”, whereas the latter part of the assessment “includes a bias towards larger donors, for which it is less difficult to be among the top donors that cumulatively provide 90% of aid volume at the partner country level.” The OECD believes that merging both assessments will equalise these biases (OECD 2011b, 6).
17 Stemming “mostly from bilateral sources, since nearly half (45%) of bilateral aid relations are non- significant compared to one-third (34%) of multilateral aid relations respectively” (OECD 2011b, 7).
relations and an average fragmentation ratio of 55%, meaning over half of all donor relationships in that country are non-significant” (OECD 2011b, 7). Mozambique is one of these countries and thus presents – according to the OECD – “the greatest opportunities for rationalisation and efficiency gains, and therefore merit particular attention” (OECD 2011b, 7).18
2.2 What causes fragmentation and why is it problematic?
As outlined above, the OECD asserts that “aid fragmentation is still increasing, especially in low-income countries and fragile states [and that it] stems to a large extent from bilateral sources” (2011b, 19). Causes for fragmentation can be found in collective-action theory that “seeks to understand how groups of individuals are able to cooperate to overcome social dilemmas, assuming that being a self-interested, short-term maximise is the default position” (Bray 2008). Applied to development cooperation, Kanck and Rahman asserts that
aid entails a set of collective action problems when there are multiple donors, each concerned with development in the recipient country, but with their own national goals as well, that sometimes conflict with development objectives. Donor countries all have their own commercial and security objectives, and their aid agencies additionally have the objective of maximising aid budgets, requiring them to cater to key domestic constituencies in parliament and among aid contractors and advocacy groups. This latter objective often requires making the results of aid programs visible, quantifiable, and directly attributable to the donor's activities – even when doing so reduces the developmental impact of aid. From the perspective of a recipient country's welfare, incentives for any one donor to shirk on activities that maximise overall development in favor of activities that contribute to donor-specific goals strengthen as the number of donors increases. (Kanck / Rahman 2007, 177).
As “the market for aid is not like other markets”, delineated as such by Djankov et al., it is observable that “many new organisations enter every year, but no significant organisation has even exited.19 Regardless of how inefficient donors may be, they stay in the aid business. This often results in overwhelmed government officials, who spent their time meeting donor delegations” (Djankov / Montalvo / Reynal-Querol 2009, 217). This is one of the reasons why fragmentation of aid has to be regarded, in general, as problematic for the development process in the partner country.20 Such transaction costs –
18 Certainly, any indicator or indicator set on aid fragmentation that also comprises donor aid shares, as used by Knack / Smets (2012), for instance, will give only part of the picture. Neither the OECD measure of fragmentation nor the donor aid share addresses “fragmentation at the sectoral level, delegation of implementation of aid by one donor to another, or coordinating donor missions or country analytical work” (Knack / Smets 2012, 17). This problem will be picked up again in Section 2.2 where the complications of the working term “fragmentation” are discussed.
19 “Klein and Harford (2005). See Chapter 2: A century of entry but no exit” (in Djankov / Montalvo / Reynal-Querol 2009).
20 Knack / Rahman (2007) and Knack / Smets (2012) assert that an increase in aid fragmentation among donors diminishes the quality of government bureaucracy in the recipient country because donors with a small share of the aid market tend to hire the most talented public managers in order to deliver successful projects. In addition, Anderson argues – based on econometric analysis – that “the fragmentation of bilateral donors’ aid across many recipients tends to raise their administration costs”
classified by Acharya et al. as direct and indirect21 – are the result of a lack of “concerted and co-ordinated aid allocation practices” (OECD 2011b, 3) and accrue to donors and partner countries alike:
For donors, aid relations incur some fixed transaction costs, irrespective of programme or project size. These include costs associated with maintaining a minimum in-country professional presence and with different phases of the project or programme cycle, including identification and planning, negotiations and consultations with relevant stakeholders as well as monitoring, reporting and evaluation of interventions. At the country level, a large number of donors with different and often uncoordinated management practices (i.e. in the absence of lead donor arrangements) places a heavy burden on the administrative capacity of partner governments. The assumption is that this administrative burden can be reduced and donors can achieve efficiency gains when rationalising their overall donor-partner country aid relations. (OECD 2011b, 3)
Thus, not only do empirical results hint towards the verification of the hypothesis that
“aid proliferation involves a negative effect on economic growth of the recipient countries” (Kimura / Sawada / Mori 2007),22 the accrued transaction costs for donors due to the fragmentation of bilateral donors’ aid across recipient countries is a financial burden and could be reduced “by US$2.5 billion per year through greater recipient country specialisation, […] without affecting the total amount of aid received by any one recipient” (Anderson 2012, 799). Yet, a precondition for such efficiency gains is that greater country specialisation is pursued in a coordinated manner: “if uncoordinated […], greater country specialisation could mean a reduction in the total amount of aid”
(Anderson 2012, 800).
Based on the critical fragmentation literature, Knack and Smets argue23 that the benefits from concentrating aid among fewer donors in a partner country outweigh the risks associated with the accommodating power concentration; namely, that the concentration leads to a less diffused responsibility for development outcomes, which means that donors
“are less likely to indulge in practices that undermine aid’s effectiveness. A donor with a larger share of the aid market in a country has a stronger incentive to maximise the
(Anderson 2011, 5). Finally, Djankov / Montalvo / Reynal-Querol assert that donor proliferation reduces economic growth in part through “the resulting increased corruption in the recipient country’s government” (Djankov / Montalvo / Reynal-Querol 2009, 218).
21 The direct transaction costs are in line with the explications of Knack / Rahman (2007). The indirect costs are twofold: “Where there are many aid donors, they are frequently in clear, and sometimes visible, competition with one another—for attractive projects, for the time and attention of senior policymakers, for the assistance of good public servants, or for influence over the policies of the recipient government. This competition can spill over into their relationship with one another, and lead, for example, to the ‘hoarding’
of information, and for less than wholehearted engagement in the processes normally labeled ‘donor coordination’. [Moreover] a multiplicity of donors in one recipient country can contribute to a lack of a sense of responsibility for the outcomes of aid. The more donors there are, the easier it is to assume or assert that the lack of development progress is someone else’s fault; and the greater are the temptations for individual donor agencies to focus efforts on obtaining good results from their own projects, even if this impinges adversely on overall aid performance” (Acharya / Fuzzo de Lima / Moore 2004, 8).
22 Please note that this observation is context-specific and may not apply to Mozambique. Mozambique is experiencing stable growth rates despite an above-average presence of donors.
23 Their analysis used a model of donor behaviour adopted from Knack / Rahman (2007) and is based on collective-action theory (Knack / Smets 2012, 17).
development impact of its aid instead of pursuing commercial or other non-development objectives” (Knack / Smets 2012, 2). In particular, the analysis of Knack and Smets of the effects of aid fragmentation on aid tying reveals that “lower fragmentation is associated with less aid tying” (Knack / Smets 2012, 2). The authors explain this with the reputational pressure that donors with a high aid share in the partner country are exposed to in order to produce development outcomes.
Certainly, while a monopolistic reliance on one donor, or a small group of donors, should be avoided24 – keeping in mind that a market for aid25 has the advantage of providing healthy competition among aid providers, which offers recipients the option to choose between varying funding sources and areas of donors’ expertise – it is clear that aid concentration with a handful of donors that have a greater market share is to be favoured over a patchwork of aid relationships with little market share that operates in an uncoordinated fashion. Collective-action theory and the observation that the “more donors there are, the easier it is to assume or assert that the lack of development progress is someone else’s fault” (Acharya / Fuzzo de Lima / Moore 2004, 8) offer abundant reasons to verify this assumption. Additionally, as donors tend to have multiple objectives beyond poverty reduction (commercial, security or other strategic interests), inevitable trade-offs may be less harmful if such trade-offs appear for a smaller number of aid providers.26 Thus, the challenging task in using the working term “fragmentation” is – aside from its narrow definition and way of measurement – to distinguish harmful fragmentation from a) unavoidable, b) possibly useful and c) non-financial-related fragmentation and its possible added value for the effectiveness of aid. Regarding a), it may well be that fragmentation of aid in the programme implementation phase is unavoidable due to a lack of capacity of implementing agencies to absorb large amounts of funds (an argument frequently put forward by my interview partners in Mozambique). It may also be that an increasing fragmentation trend is a normal consequence of higher aid flows. Regarding b), fragmentation of aid can be useful if the benefits of demand-driven aid – with its associated healthy competition and diversity of ideas among aid providers – outweigh the higher transaction costs of the fragmentation (Rogerson 2005). Regarding c), it may well be that non-significant aid relations in financial terms are “well-targeted and have significant impact at the country level” and/or have a non-financial value, for instance in knowledge-transfers and diplomatic relations (OECD 2011b, 6). Yet, as the OECD argues,
“these aid relations necessarily come with important transaction costs, and therefore
24 Rowlands / Ketcheson (2002) and the OECD (2011b) actually warn of the dangers of relying on solely one single large donor, because in cases of such “monopoly power”, the donor may exercise its leverage to influence domestic policy-making in the partner country. Additionally, the partner country may be vulnerable to a more volatile ODA environment due to such dependency.
25 A “market for aid” attempts to alter traditional power relations established between supplying donors and receiving partners. Faust and Messner, in analogy to Klein / Harford (2006), discuss the possible introduction of a “voucher scheme”, a financing instrument based on recipient demand in which developing countries can use a supplied voucher to “purchase development services in an international market made up of donor agencies.” Although it would strengthen “partner-country ‘ownership, […]
lower transaction costs [and emphasises] customer-oriented competition between suppliers”, it also challenges partner countries in terms of administrative capacity, transparency and the insurance to establish a participatory tendering process (Faust / Messner 2007, 19).
26 Certainly, the presence of these non-poverty-related interests complicates any effort to convince “non- significant” aid providers to exit a country.
some rationalisation may be worthwhile to reduce transaction costs on both ends of the delivery chain” (OECD 2011b, 6). Additionally, an unintended effect of acknowledging the non-financial value of aid relations (in the sense that aid is a tool in the box of diplomatic relations between donor and recipient countries) is the implicit endorsement and blessing to justifiably politicise international development assistance even further.27 In all these cases, assessing fragmentation is not an easy and straightforward task. To achieve development impacts, trade-offs between the goals of the aid-harmonisation agenda may even be inevitable. Budget support to five sectors is certainly a more fragmented approach than project aid delivered to three sectors. Yet, it may as well be more effective, as government systems are strengthened and parallel project-implemen- tation units are reduced.
The problem of only partially being able to measure fragmentation certainly diminishes the strength of recommendations for aid rationalisation in partner countries based on such quantitative findings. Complications with the measurement will be picked up during the fragmentation analysis of Mozambique in Chapter 3.
2.3 What is known about the fragmentation of aid and the proliferation of donors in Mozambique?28
According to the aforementioned OECD 2011 report on the division of labour that was based on data from 2009 (OECD 2011b), Mozambique received US$ 1.8 billion in CPA and is characterised by a) an above-average presence of donors overall (36: 20 DAC countries and 16 multilateral agencies) versus the global average (21: 11 DAC countries and 10 multilateral agencies) and 24 per country in Africa; and b) by an above-average presence of DAC donors (20 vs. African average of 12).
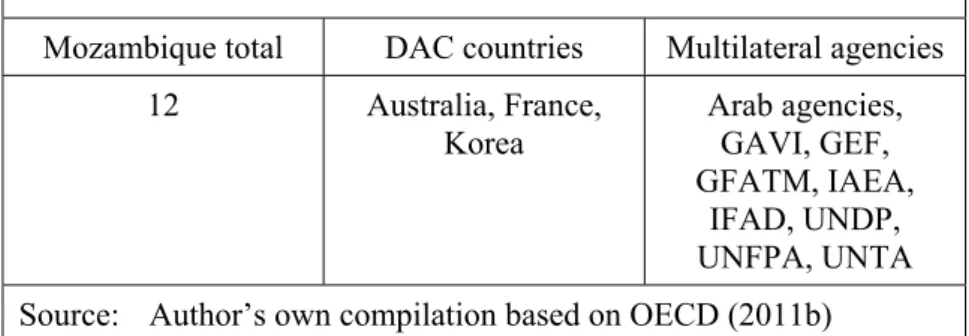
This explains partly the high amount of at least 12 non-significant aid relations in the country, ranking Mozambique among the 44 countries with the “greatest opportunities for rationalisation and efficiency gains” (OECD 2011b, 7). Yet, only three of these non- significant aid relations were DAC donors: Australia; France and Korea. This compares to the nine multilaterals that have had aid relations in Mozambique and that were, strictly financially speaking, non-significant: Arab Agencies, GAVI, GEF, GFATM, IAEA, IFAD, UNDP, UNFPA and UNTA (OECD 2011b).29 Thus, multilateral agencies have
27 This can then act as a valid excuse to not exit a country / sector, which is identified as one of the main problems of the aid market and one of the main inhibiters of the implementation of the DoL agenda.
28 The following section is based on the OECD (2010b; 2011b; d; e). Please see also Annexes 2 and 4.
The author acknowledges that despite the general confidence levels in the data work provided by the OECD, measurement errors remain a possibility and that the quality of reporting varies from donor to donor and from year to year. Please also note that the sectors are based on CRS sector classifications.
29 Global Alliance for Vaccines and Immunisation; Global Environment Facility; Global Fund to Fight AIDS, Tuberculosis and Malaria; International Atomic Energy Agency; International Fund for Agricultural Development; United Nations Development Programme; United Nations Population Fund;
United Nations Transitional Authority.
more “non-significant” aid relations in Mozambique (9) than bilateral agencies (3), which is an interesting observation, because globally, this is the other way around (2011b, 7).30 Another interesting observation is that, despite the high proliferation of donors in Mozambique (36), the fragmentation ratio for Mozambique is, at 33 per cent, lower than in comparison to other countries that have 12 or more non-significant aid relations (55 per cent) – 33 per cent is even slightly below the African average of 36 per cent (OECD 2011b).
Table 2: Non-significant aid relations (based on data from 2009) Mozambique total DAC countries Multilateral agencies
12 Australia, France,
Korea
Arab agencies, GAVI, GEF, GFATM, IAEA,
IFAD, UNDP, UNFPA, UNTA Source: Author’s own compilation based on OECD (2011b)
The picture becomes even more nuanced if the figures for 2009 are compared to data from 2010 (see Annex 4). Here it can be seen that the presumed multilateral “fragmenters”
actually show – with the exception of UNDP – an above-average concentration ratio for Mozambique (so above 53 per cent).31 In contrast, the “non-fragmenter” Germany, which is considered to have “significant” aid relations in Mozambique, continues to have “non- significant” relations in 6 out of the 11 sectors it is engaged in.32 This also means that Germany has, with 45 per cent, a lower concentration ratio in Mozambique than with its average globally (81 per cent – data from 2009), and in comparison to the total of 53 per cent for Mozambique.
Further complications in interpreting the picture emerge if one looks at the aid fragmentation / donor proliferation table for Mozambique in Annex 2, which “shows the changes in the number of donors and the volume of aid disbursements from 2005 to 2009 for each sector (11 sectors + budget support)” (OECD 2010b). By looking at the “aid fragmentation by sector” table, it can be seen that, in total, the CPA trend points upwards, which can certainly be interpreted as a positive trend. At the same time, the fragmentation trend points upwards too, which should be interpreted as a negative trend. So the question is whether an increase in the CPA trend warrants an increase in the fragmentation trend. In a perfect scenario, an increased CPA trend is coupled with a decreased fragmentation trend. Unfortunately, there is no such case by sector for this time period. Further, the CPA trend points upwards for all sectors except economic infrastructure and government and civil society. Yet, fragmentation did not decrease in any one sector between 2005 and 2009. On a positive note, there is not a single case in which the CPA trend points downwards at the same time that the fragmentation trend points upwards. Yet, neither is
30 Please note that the 2011 OECD report focusses on cross-country comparisons. Hence, for 2009, the OECD counted the IAEA and UNTA as “non-significant” aid providers. It can be assumed that neither of the agencies was active in Mozambique.
31 This is in line with the global trend, meaning that on average, multilateral agencies – with 66 per cent – a higher concentration ratio than DAC countries (55 per cent).
32 This is the same total amount of “non-significant” sectors such as the “non-significant” DAC donor Australia (also six, yet only out of eight sectors they are engaged in).
there a single case of an increase of CPA and a reduction in the fragmentation trend (which would have been the most straightforward positive interpretation).
Regarding the proliferation of bilateral donors, it can be seen that on average, both the CPA and proliferation trends point upwards. So the same question emerges as with the fragmentation trend: Does an increase in the CPA trend warrant an increase in the proliferation trend? Of all bilateral donors, only Belgium showed the desired CPA increase while at the same time showing a decreased proliferation trend – yet, at the same time, their concentration ratio, at 25 per cent, was as low as Australia’s, which was one of the three non-significant aid providers in 2010 (OECD 2011e). At the same time, a handful of donors show a downward proliferation trend, which is certainly a commendable trend, notably Luxembourg, Norway and the United Kingdom. Their problem is that they all show simultaneously a decreased CPA trend (Luxembourg phased out actually). Of particular interest is Italy – although its CPA level decreased over the period from 2005 to 2009 whilst its proliferation trend increased, with 64 per cent it showed a relatively high concentration ratio in 2010 (OECD 2011e). It is engaged in 11 sectors (high proliferation in total); yet of these sector engagements, seven are classified as very significant, and only four as non-significant.
Finally, regarding donor proliferation of multilateral agencies, the total CPA trend as well as the proliferation trend point downwards. Hence, gains in concentration may be offset by the decreasing CPA flow. Only the United Nations Children’s Fund (UNICEF) shows the desirable increase in the CPA trend while simultaneously showing a decreasing proliferation trend, whereas GEF and UNDP show the worst-case scenario of a downward CPA and an upward proliferation trend.
Without question, it will require some strong leadership and thorough debate in Mozambique about how to best use these findings in order to develop meaningful recommendations to effectively concentrate the aid system better without jeopardising total CPA flows.
Presumably the best way forward is for every agency to thoroughly engage in a self-critical analysis to see where efficiency gains are possible. A central task will be to scrutinise how the aid delivery is organised and to identify entry points for better aid concentration. For instance, non-significant aid relations could be redirected, where possible, into pooled funds. Another way forward is offered by the OECD, which proposes to set
relative targets, where for example donors below DAC average could commit to reach the current DAC average concentration ratio, and those already above the average could commit to improving their existing levels without a fixed target. Such a commitment could have the target date of 2015, by which at least some significant progress should be demonstrated. As a minimum, the donor community should stop further aid fragmentation and progressively strive to reduce fragmentation in line with mutually agreed targets. (OECD 2011b, 19).
This is a reasonable request, particularly for the DAC donors of the European Union.
Despite the fact that Mozambique is a partner country of the EU’s Fast Track Initiative (FTI) on Division of Labour (EU 2008), which calls on EU donors to minimise their active involvement in a partner country to a maximum of three sectors (and max. 3–5 EU donors per sector), all bilateral EU donors were active in more than three sectors in 2010,
and all of them had, in fact, non-significant relations in at least three or more sectors (OECD 2011e).33
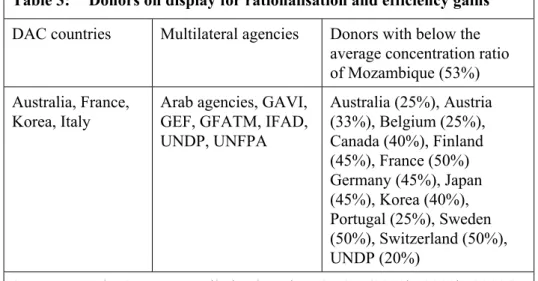
Thus, based on the data described above (OECD 2010b; 2011b; 2011e) and the recommendation given by the OECD, the following agents in particular are on display for rationalisations to achieve efficiency gains:
• DAC countries: Australia, France and Korea for their non-significant aid relations, and Italy for having an increased proliferation trend whilst simultaneously having a decreased CPA trend. For Australia and Korea, the trend over 2005–2009 is complicated: it shows an increasing CPA trend, accompanied by an increased proliferation trend. For France, the trend of proliferation is not clear (it shows an increased CPA trend though).
Table 3: Donors on display for rationalisation and efficiency gains DAC countries Multilateral agencies Donors with below the
average concentration ratio of Mozambique (53%) Australia, France,
Korea, Italy
Arab agencies, GAVI, GEF, GFATM, IFAD, UNDP, UNFPA
Australia (25%), Austria (33%), Belgium (25%), Canada (40%), Finland (45%), France (50%) Germany (45%), Japan (45%), Korea (40%), Portugal (25%), Sweden (50%), Switzerland (50%), UNDP (20%)
Source: Author’s own compilation based on OECD (2010b; 2011b; 2011e)
• Multilateral agencies: Arab agencies, GAVI, GEF, GFATM, IFAD, UNDP and UNFPA for their non-significant aid relations in Mozambique. GEF and UNDP are on display in particular, for having in addition a downward CPA trend accompanied by an upward proliferation trend over the timeframe of 2005 to 2009. UNDP’s concentration ratio in 2010 was only 20 per cent, which is due to the fact that of its involvement in five sectors, four were non-significant in financial terms (OECD 2011e).
• By concentration ratio: Any country with a below-average share of concentration ratio for Mozambique, which is 53 per cent (which is even below the global average of 60 per cent), should rethink their portfolio, even though the number is inflated through several multilaterals (GAVI, GEF, GFATM, IMF, Nordic Development Fund, Joint United Nations Programme on HIV/AIDS, UNFPA), who all have a 100 per cent concentration ratio stemming from the fact that they are only engaged in one or two (max. three) sectors where they are considered to be significant donors. Nevertheless, these countries and organisations are: Australia (25 per cent), Austria (33 per cent), Belgium (25 per cent), Canada (40 per cent), Finland (45 per cent), France (50 per cent) Germany (45 per cent), Japan (45 per cent), Korea (40 per cent), Portugal (25 per cent), Sweden (50 per cent), Switzerland (50 per cent) and UNDP (20 per cent) (see Annexes 2 and 4).
33 Tools to address the fragmentation of aid will be discussed in more detail in the forthcoming Sections 2.4, 2.5 and 2.6.
Certainly, the question is: Where does Mozambique stand in relation to the results for 2012 and 2013? This is a complicated question, as results of any rationalisation taken now
“will only be visible in aid statistics reported in the next few years” (OECD 2011b, 19).
Judging from my interviews and the 2011 OECD Survey on Donors’ Forward Spending Plans, however, which collected information on planned donor exits from 2011 to 2015, some donor exits do take place. Although not aggregated by donor or country, the 12 participating DAC EU countries of the survey are planning 67 exits in Africa in total, 45 of which are considered to affect non-significant aid relations (quoted in OECD 2011b, 11). Additionally, data from 2011 will allow for an early assessment as to whether donors have increased their concentration ratio in comparison to 2010 (please see Chapter 3).
Yet, it remains to be seen to what extent Mozambique is affected. It also remains to be seen whether a) sector exits take place in a coordinated fashion or reflect an uncoordinated – and thus possibly harmful – “inward-looking” process only; and whether b) possible benefits from sector exits are offset by sector entries elsewhere. According to the 2012 EU Accountability Report on Financing for Development, EU Member States exited 90 sectors in the reporting period, yet also entered 71 new sectors (EC 2012, 76).
Discussing these trends was the focus during my interviews, which are outlined in Chapter 3. To be able to understand the analysis, some background information on the international tools to address aid fragmentation and on the institutional mechanisms on aid coordination in Mozambique is essential (to be discussed in Sections 2.4 and 2.5).
2.4 What are the tools available to address fragmentation?
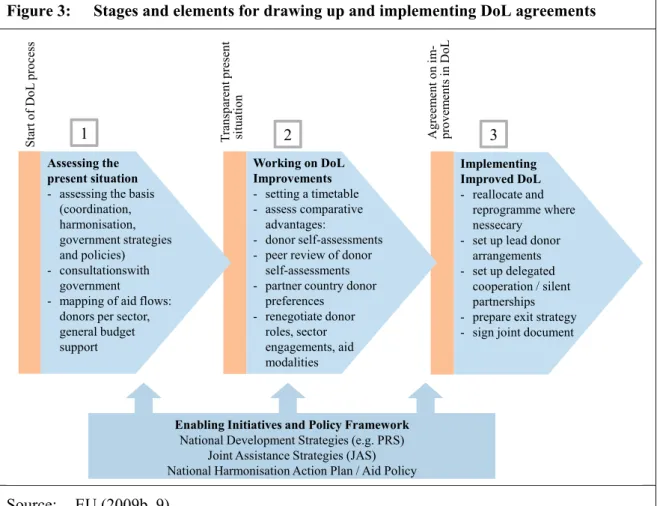
Several political tools have been developed to tackle fragmentation. The most well-known initiative is the EU Code of Conduct on Complementarity and Division of Labour (CoC- DoL), which was adopted by the EU Council of Ministers in May 2007 (EU 2007). The CoC operates on three levels: in-country, cross-country and cross-sector. The code’s implementation at the partner-country level has been supported since 2008 by the EU’s FTI, which facilitated the implementation of in-country DoL in about 30 partner countries (including Mozambique) (EU 2008). Fourteen EU Member States and EU Delegations were involved in the initiative, which ended in mid-2011 and which has been complemented since 2009 by an Operational Framework on Aid Effectiveness that aims to coordinate the code’s implementation at the policy level (EU 2009a). The code is
“voluntary and flexible and should be implemented by means of country-based approaches” that require two indispensable prerequisites: “a keen interest of the partner government in Division of Labour [and a] solid political will and resolute engagement of the highest decision-making levels in donor headquarters” (OECD 2011 f.). In order to better implement the DoL process – roughly divided into the three stages “Assessing the present situation”, “Working on DoL Improvements” and “Implementing Improved DoL”
(please see Figure 3 for an overview of the in-country DoL process) – the EU and Members States divided roles and responsibilities in a number of partner countries. A
“lead facilitator” is supported by various “supporting facilitators” that are equipped by the EU with a “Toolkit for In-Country DoL” (EU 2009b). For the case of Mozambique, the