• Keine Ergebnisse gefunden

Capturing the Value Premium – Global Evidence from a Fair Value-Based Investment Strategy

N/A
N/A
Protected

Academic year: 2021

Aktie "Capturing the Value Premium – Global Evidence from a Fair Value-Based Investment Strategy"

Copied!
57
0
0

Wird geladen.... (Jetzt Volltext ansehen)

Volltext

(1)

Capturing the Value Premium – Global Evidence from a Fair Value-Based Investment Strategy

Ren´ e-Ojas Woltering 1

University of Regensburg

Christian Weis

University of Regensburg

Steffen Sebastian

University of Regensburg

Felix Schindler

Steinbeis University Berlin

Abstract

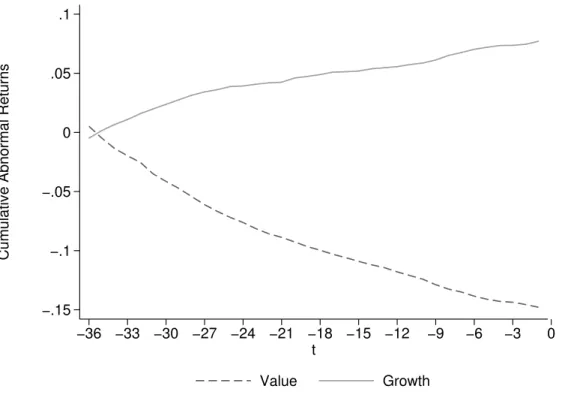
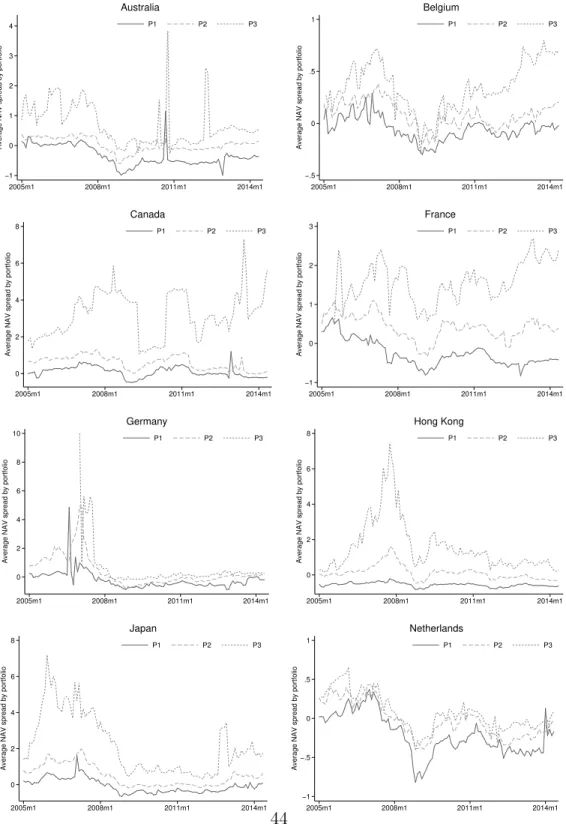
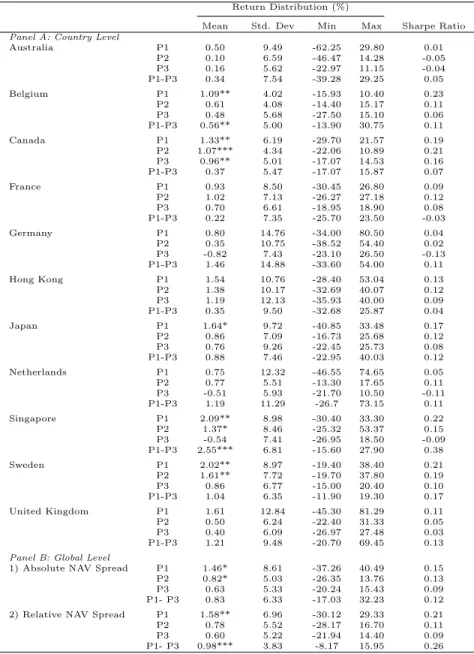
This paper examines the risk premium of value stocks within a global investment strategy frame- work. We test whether absolute or relative mispricing is better suited to capture the global value premium by using fair value-based net asset values (NAVs) as our proxies for fundamental value.

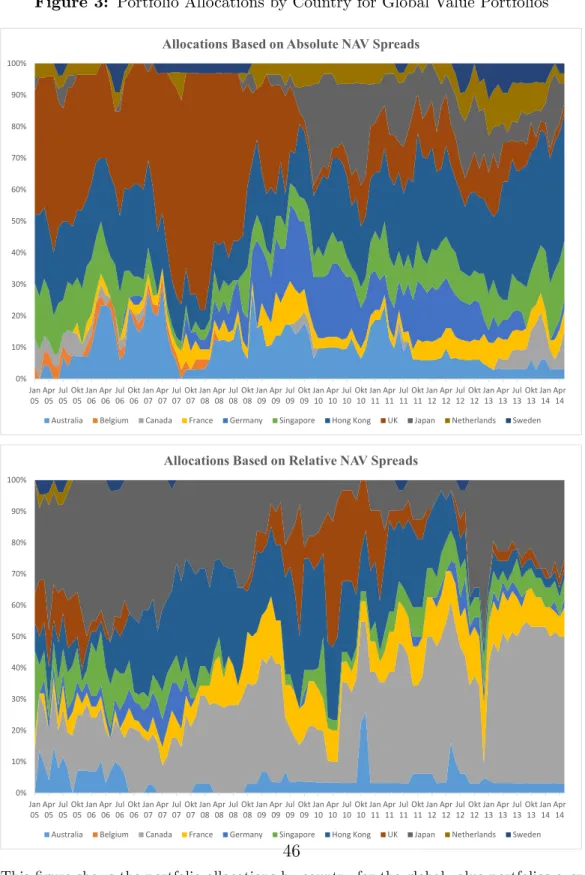
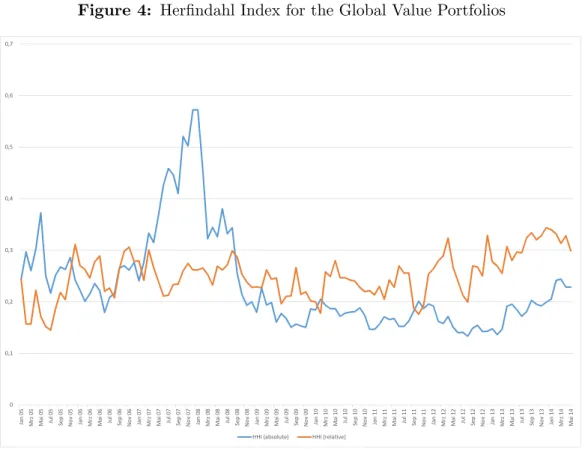
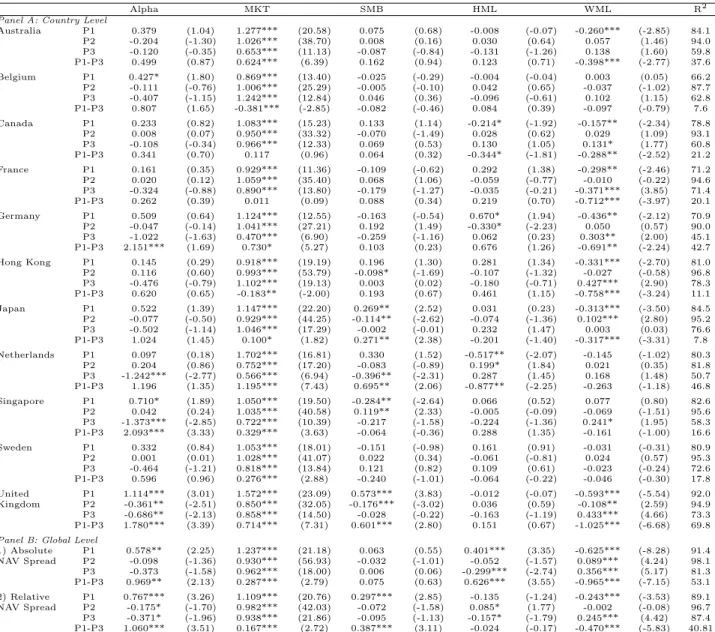
We find that investing in the most underpriced stocks relative to the average ratio of price to fun- damental value in a country is the key to achieving superior risk-adjusted returns. The annualized excess return of the global value portfolio sorted according to relative mispricing is 10.0%, and remains significant after controlling for common risk factors.

JEL classification: G11; G12; G14; G15

Keywords: Global Diversification, Net Asset Value, Investment Strategy

1

Corresponding author. University of Regensburg, Chair of Real Estate Finance, D-93040 Regensburg, Germany,

Tel.: +49 941 943 5085, Fax: +49 941 943 815080.

(2)

Capturing the Value Premium – Global Evidence from a Fair Value-Based Investment Strategy

Abstract

This paper examines the risk premium of value stocks within a global invest- ment strategy framework. We test whether absolute or relative mispricing is better suited to capturing the global value premium by using fair value- based net asset values (NAVs) as our proxies for fundamental value. We find that investing in the most underpriced stocks relative to the average ratio of price to fundamental value in a country is the key to achieving superior risk-adjusted returns. The annualized excess return of the global value port- folio sorted according to relative mispricing is 10.0%, and remains significant after controlling for common risk factors.

Keywords: Value Premium, Global Diversification, Net Asset Value, Investment Strategy

JEL: G11, G12, G14, G15

1. Introduction

Numerous studies show that value stocks (those with a low ratio of price to fundamental value) on average outperform growth stocks, both for the U.S.

(Rosenberg et al., 1985; Fama and French, 1992) and international stock mar-

kets (Fama and French, 2012; Asness et al., 2013). The literature exhibits

(3)

some discrepancies regarding how to interpret the value premium. Propo- nents of the efficient market hypothesis argue it is compensation for higher risk (e.g. Davis et al., 2000), while others attribute the return anomaly to suboptimal investor behavior (e.g. Lakonishok et al., 1994; De Bondt and Thaler, 1985). However, the commonality among these studies is that they separate value and growth stocks according to their book-to-market ratios of equity. Thus, whether explicitly or implicitly, the book value of equity is used as the proxy for a firm’s fundamental or intrinsic value.

Most academics agree that a firm’s intrinsic value is determined primarily by the present value of its future cash flows, which is not necessarily reflected by balance sheet data. Therefore, if viewed as a rather poor proxy for mis- pricing, the robust outperformance of stocks with high book-to-market ratios of equity appears somewhat surprising. It also raises the question of how re- turns are distributed when a more reliable proxy for intrinsic value is used.

For example, Lee et al. (1999) use a residual income valuation approach to determine the intrinsic value of the Dow Jones Industrial Average, and find it has much higher explanatory power than the aggregate book-to-market ratio. This study focuses on a sample of stocks for which we believe the book value of equity is actually a good proxy for intrinsic value: property-holding companies in countries with fair value-based accounting regimes.

The introduction of the International Financial Reporting Standards (IFRS) led to a paradigm change in many countries. In general, IFRS increased the comparability of accounting data across countries, thus reducing investors’

information costs (Ball, 2006). In contrast to historical cost-based account-

ing regimes, IFRS accounting emphasizes reporting assets at their fair value.

(4)

In the case of property-holding companies, whose cash flows are heavily de- pendent on rental income, the assets consist primarily of regularly appraised property values. Presuming that other assets and liabilities are also reported close to market value, the book value of equity (or the net asset value (NAV)) of property-holding companies can be seen as a “sum of the parts” valua- tion of the company, where each property is appraised using property-specific risk-adjusted discount rates. This provides a unique setting to study discrep- ancies between market prices and estimates of intrinsic value across countries.

Overall, our sample consists of 255 listed property holding companies in 11 countries over the 2005-2014 period.

Our objectives are 1) to examine the relationship between price and value at an individual country level using NAV as the proxy for intrinsic value, and, more importantly, 2) to explore whether mispricings across countries can be exploited to generate risk-adjusted excess returns by investing in a globally diversified value portfolio. The underlying rationale is that NAV deviations are temporary, and mean reversion will ultimately cause prices to return to their intrinsic values. Another potential source of diversification may arise from less than perfect cross-country correlations of the risk factors that can cause NAV discrepancies across countries.

Our empirical approach is based on a monthly trading strategy. At the

end of each month, we rank all stocks according to their deviations from in-

trinsic value, as measured by the NAV spread. We then form three portfolios

whose returns are observed over the following month, with the focus being on

the value portfolio, which is defined as the quintile of stocks with the highest

discount to NAV.

(5)

We examine value investment strategies at both an individual country level and a global level. At the global level, we compare two approaches.

First, we follow the country-level approach and form portfolios according to their absolute discounts to NAV. However, one drawback with this approach is that the global value portfolio may be overly exposed to country risk.

Thus, if an entire country is trading at depressed levels relative to other countries, the global value portfolio may even include growth stocks of the discount country, which would nullify any potential diversification gains from within-country mean reversion.

Second, we control for such country effects by sorting stocks according to their relative NAV discounts (e.g., with respect to a country’s average NAV discount in a given month). A comparison of both approaches enables us to determine whether absolute or relative deviations from NAV are better suited to exploit security mispricings across countries. To this end, after portfolio formation, we compare the risk-return characteristics based on ab- solute returns before using time series regressions to evaluate risk-adjusted performance.

We find that value portfolios strongly outperform their benchmarks in

most countries, but they are also more risky, as indicated by higher return

volatility, higher loadings with respect to systematic risk factors, and signif-

icant risk-adjusted returns in only two out of eleven countries. The results

improve considerably at a global level, especially when country-specific ef-

fects are taken into account (i.e., when the portfolios are sorted according to

relative NAV spreads). The annualized excess return of the global value port-

folio is 10.0%, based on country-adjusted NAV discounts, and it is 7.4% based

(6)

on absolute NAV discounts. At the same time, the value portfolio, which is based on country-adjusted NAVs, is also less risky by all measures, and it produces significant risk-adjusted returns. Overall, our findings suggest that relative mispricing is better suited to capture the global value premium, at least in the short term.

The remainder of this paper is organized as follows. Section 2 reviews the related literature, and introduces our hypotheses. The methodology, data, and descriptive statistics are described in section 3. Section 4 provides the empirical results, and section 5 concludes.

2. Related Literature and Hypotheses

2.1. Value Stocks and Risk

The literature has long been dominated by the view that financial markets are efficient, or, in other words, that price equals intrinsic value at all times.

Early academic opponents of this view include Shiller (1981), who finds that

stock price volatility appears to be too high to reflect changes in fundamental

information; Shiller et al. (1984), who argue that stock prices are subject to

fads and fashions that can result in overreactions to new financial informa-

tion; De Bondt and Thaler (1985), who provide empirical evidence for the

overreaction hypothesis by documenting how portfolios of past losers outper-

form past winners; and Rosenberg et al. (1985), who find that stocks with

high book-to-market ratios of equity have higher returns than those with

low ratios. Because these return patterns cannot be described by the capital

asset pricing model (CAPM) of Sharpe (1964) and Lintner (1965), they are

(7)

referred to as return anomalies.

Fama and French (1992) address these shortcomings by extending the CAPM by two further factors: size and book-to-market. They find that the three-factor model is better at explaining stock returns. Assuming that assets are priced rationally, the authors argue that the book-to-market factor is a proxy for undiversifiable risk. However, this view has been criticized by Daniel and Titman (2006), for example, who argue that the Fama-French model “is designed to explain the book-to-market effect.” Ferson et al. (1999) make a similar argument, and caution that empirical regularities will appear to be useful risk factors even when their attributes are “completely unrelated to risk.”

Proponents of behavioral finance argue that value strategies produce higher returns not because they are fundamentally riskier, but because they exploit suboptimal investor behavior. For example, the extrapolation theory, which goes back to Lakonishok et al. (1994). The authors posit that some investors naively extrapolate past trends into the future, thereby bidding up (down) prices to irrationally high (low) levels, which provides an opportunity for contrarian investors to earn excess returns.

On the other hand, a number of studies provide evidence in favor of the theory that the value premium is a compensation for higher fundamental risk. For example, Fama and French (1995) find that firms with a high book- to-market ratio have higher leverage ratios and tend to be distressed relative to growth stocks.

Another strand of the literature tries to explain the value premium by

the conditional CAPM, which uses time-varying betas. Petkova and Zhang

(8)

(2005) find that time-varying risk is indeed better suited to explain the value premium. But the authors concede that the value premium is still too large to be fully explained by the conditional CAPM.

Choi (2013) also uses a time-varying beta approach, and finds further evidence for the risk-based explanation of the value premium. He documents that the asset risk and financial leverage of value stocks are particularly likely to increase during economic downturns. However, his model leaves approximately 60% of the unconditional value premium unexplained.

Overall, the literature tends to agree that value stocks are somewhat fundamentally riskier than growth stocks. But the value premium appears too large to be explained solely as compensation for additional risk, which gives some credence to mispricing theories.

The aforementioned studies are generally based on common stocks, and,

in many cases, property holding companies or REITs were deliberately ex-

cluded (e.g. Fama and French, 1992). Ooi et al. (2007) examine the value

premium by using U.S. REIT data, and find that the quintile of value REITs

outperforms the quintile of growth REITs by 8.5% p.a. The authors also find

support for the extrapolation theory of Lakonishok et al. (1994), because

value REITs exhibit poorer returns prior to portfolio formation, but their

subsequent performance tends to be better than anticipated. This results in

positive earnings surprises and higher returns. We exclude U.S. REITs here,

however, because their book values are based on historical costs and not on

fair values, due to U.S. GAAP accounting regulations. To the best of our

knowledge, our study is the first to address the value premium in the context

of fair value accounting.

(9)

The interpretation of the value premium in the context of fair value ac- counting is somewhat ambivalent. On the one hand, it seems straightforward to interpret price deviations from NAV as mispricings, because the NAV is supposed to be a relatively reliable proxy for intrinsic value. On the other hand, if reliable information about intrinsic value is easily available to all investors, then it seems counterintuitive that prices would depart from NAV, unless the discount is related to some risk factor.

For example, investors may not trust reported appraisal values, or they may anticipate devaluations. This could hence lead to a lower NAV when the next financial report is published. Moreover, the fact that property holding companies tend to be highly leveraged would amplify the impact of property devaluations on NAVs, potentially justifying large discounts before publication of the next report. Brounen and Laak (2005) find empirical support for such risk-based explanations of NAV discounts. In their sample of European property holding companies from 2002, a large discount to NAV is positively related to firm-specific risk factors such as high leverage or a lack of transparency.

In summary, if the book-to-market ratio is seen as a proxy for mispric-

ing, there are good reasons to anticipate that value investment strategies will

work even better when the proxy for intrinsic value is more reliable (as with

the NAV of property holding companies under fair value-based accounting

regimes). However, precisely because the NAV is supposed to be a relatively

reliable proxy for intrinsic value which is also publicly available to all in-

vestors, deviations from intrinsic value may be explained only by risk factors

that do not appear on a firm’s balance sheet, such as anticipated financial

(10)

distress. For example, the market may use higher discount rates on the firm’s expected cash flows than property appraisers – a scenario that seems particu- larly likely during periods of market distress, when the price of risk is higher, as suggested by Zhang (2005). Reflecting these risk-based explanations for the NAV discounts, we formulate our first hypothesis as follows:

Hypothesis 1: Discounts to NAV are at least partially attributable to risk factors that are not fully reflected on a firm’s balance sheet; hence, value stocks do not produce superior returns on a risk-adjusted basis.

2.2. The Value Premium and International Diversifica- tion

Is it possible to capture the value premium with little risk by holding a

diversified value portfolio? Fama and French (1993) negate this question by

arguing that value stocks are subject to undiversifiable factor risk. More

precisely, Fama and French (1995) argue that the book-to-market factor is a

proxy for default risk or financial distress, an explanation that is particularly

relevant during recessions. In line with this business cycle view, Liew and

Vassalou (2000) find that the size (SMB) and book-to market (HML) risk

factors are significantly related to future GDP growth, while Vassalou (2003)

finds that SMB and HML lose much of their predictive power if a factor

is added that contains information related to future GDP growth. Zhang

(2005) provides a technological explanation for the underperformance of value

stocks during recessions. He argues that, during bad times, value stocks

are burdened with unproductive capital because of costly reversibility, while

growth stocks can more easily scale down their expansions temporarily.

(11)

But what about the risk-return profile of value stocks beyond individual economies? Numerous studies document that the value premium is not a U.S.

phenomenon, but rather a worldwide one (e.g. Fama and French, 1998; Asness et al., 2013). In case not all economies fall into recession simultaneously, the factor risk of value stocks is country-specific and hence (at least to some extent) diversifiable at a global level. However, the results of Fama and French (1998) suggest this may not be the case. Using a global two-factor model, they find that the global value premium is captured by a global factor for relative distress, which is basically an international HML factor.

In contrast, Griffin (2002) finds that country-specific versions of the three- factor model offer much better explanatory power for international stock returns than a global factor model. This result suggests that the factor risk of value stocks exhibits a country-specific component that could provide an opportunity for diversification gains at the global level. This leads us to our second hypothesis:

Hypothesis 2: The factor risk of value stocks has a country-specific com- ponent. Thus, superior risk-adjusted returns can be achieved by diversifying the risk of value stocks across countries.

2.3. Absolute versus Relative Mispricing

When a global value investment strategy is implemented, the question arises

of how to take advantage of potential mispricings across the international

sample of value stocks. In that regard, one advantage of the real estate stock

context is that the value premium can also be seen from a mean reversion

perspective. If the book value of equity is a good proxy for intrinsic value,

(12)

stocks should trade for a book-to-market ratio of around 1, which is equiva- lent to a NAV discount of 0. The most underpriced stocks, or, alternatively, those with the highest NAV discounts, are then defined as value stocks. If the NAV discount closes through share price appreciation, the value pre- mium could be explained by the mean-reverting relationship between price and NAV. 1 Both the real estate literature (e.g. Patel et al., 2009) and the closed-end fund literature (e.g. Pontiff, 1995) provide strong evidence in favor of a mean-reverting relationship between prices and NAV.

The implications of mean reversion for the global value investment strat- egy are twofold. To reflect this, we empirically test two different versions of the strategy. First, assuming that all stocks trade around their intrinsic value as measured by the book value (or NAV), it seems straightforward to sort the global stock sample according to the book-to-market ratio (or dis- count to NAV), and invest in the most underpriced stocks according to this measure. We refer to this as the absolute mispricing strategy, because it is based on a stock’s absolute discount to NAV.

However, value stocks may also “catch up” relative to growth stocks within the same country, rather than relative to their own intrinsic value.

Thus, if mean reversion occurs primarily at a country level, the absolute mispricing strategy may be suboptimal. Furthermore, it is possible that all the stocks of one country may trade at a deep discount, while the stocks of other countries are trading at a large premium. In this case, the global value

1 Alternatively, the discount may also close because the market correctly anticipated de-

creases in NAV, which would be consistent with risk-based explanations for the value

premium.

(13)

portfolio would comprise all the stocks of the discount country, but none of the premium countries. While this reflects the idea of absolute mispricing, it also implies that, from a country-level perspective, the global value portfo- lio may be composed of all the growth stocks of the discount country while excluding all the value stocks of the premium countries.

To avoid this scenario, and to account for the possibility that mean re- version occurs primarily at the country level, our second test examines an alternative global value investment strategy where all stocks are sorted ac- cording to their relative NAV discounts (i.e., their relative average NAV discounts in a country). This strategy ensures that the global value portfolio only consists of stocks that are actually considered value stocks on a within- country basis. This global value portfolio subsequently invests in the most underpriced securities relative to the average level of price to fundamental value in a country.

We refer to this as the relative mispricing strategy. Reflecting its advan- tages, we formulate our third hypothesis, as follows:

Hypothesis 3: The global value portfolio sorted according to relative

mispricing outperforms the global value portfolio sorted according to absolute

mispricing.

(14)

3. Data, Methodology, and Sample Descrip- tion

3.1. Sample Description and Data Sources

Our sample is based on the 2005:01 to 2014:05 period, which features a yet unparalleled degree of accounting information comparability across countries due to the introduction of IFRS in the EU and many other countries. To ensure the book value of equity is a good proxy for a firm’s fundamental value, we base our sample on the FTSE EPRA/NAREIT Global Real Estate Index, which is comprised of listed equities with “relevant real estate activities.”

The index provider defines relevant real estate activities as “the ownership, trading and development of income-producing real estate.”

Accordingly, these firms mainly derive their cash flows from income- producing assets that are shown on their balance sheets. If the accounting regime requires fair value reporting, the book value of equity can be under- stood as a sum of the parts valuation of the company, assuming that cash and other assets, and liabilities are also reported at their market values. 2

To ensure this is the case, we only include FTSE EPRA/NAREIT Global Real Estate Index constituents of countries that either adopted the IFRS, or whose national standards converged to or can be seen as equivalent to

2 Of particular relevance in this study is IAS 40, which requires investment properties to be

reported at fair value. IAS 40 also allows companies to report properties at historical costs,

and to disclose fair values only in footnotes. However, this option is rarely implemented in

actual practice. Using U.K. data, Liang and Riedl (2013) document unanimous recognition

of fair values on the balance sheet, while the EY (2011) international survey shows that

only three out of thirty-eight property holding companies opted for the cost model.

(15)

IFRS according to information provided on IAS Plus. 3 Our sample is based on historic index constituents, which are updated on a monthly basis, and hence unlikely to suffer from survivorship bias.

In their study of the global value premium, Fama and French (1998) only include countries for which they obtain a minimum of ten observations over the sample period. Our study focuses on only one sector, however, so we lower that minimum to more than five in order to avoid losing too many observations. Of those countries fulfilling this condition, we only exclude the U.S., because, according to U.S. GAAP, assets are generally reported at historical costs as opposed to fair value.

Our final sample consists of 255 stocks from 11 countries with fair value- based accounting regimes. Panel A of Table 1 reports the number of stocks by country, and the total number of country-month observations.

3.2. Monthly Trading Strategy

The majority of asset pricing studies separates value and growth stocks only once per year based on end of June data for the book-to-market ratio of equity (e.g. Fama and French, 1993). The rationale behind this procedure is to ensure that financial reporting data for the previous year are actually published and available to all investors.

However, there are two primary problems with this approach. First, any mispricing of value stocks may already be reversed before the value portfolio is formed. For example, Bernard and Thomas (1989) find that stock returns

3 http://www.iasplus.com.

(16)

tend to drift in the direction of the earnings surprise following the earnings announcement. This is all the more a concern as earnings surprises are systematically more positive for value than growth stocks (see Porta et al., 1997). Second, it is possible that some stocks’ share prices increase so much within the twelve months prior to the new portfolios being formed that they would no longer be classified as value stocks.

We avoid these shortcomings by using a monthly sorting procedure, based on Datastream’s “earnings per share report date (EPS).” We can thus en- sure that financial reporting data are actually published as new portfolios are formed. For example, if the annual report for calendar year 2014 is pub- lished in April 2015, Datastream will report a new book value of equity from December 2014 onward, but we can shift this information by four months by using the “earnings per share report date.” Financial reporting frequency is generally semiannual and may even be quarterly. Thus, NAVs may only change semiannually, but we observe monthly changes in the book-to-market ratios due to share price fluctuations.

To take advantage of potential security mispricings across countries, we use a monthly trading strategy that invests in those stocks with the highest departures from intrinsic value as measured by their NAV discounts. 4 Sort- ing stocks based on NAV discounts is equivalent to sorting stocks according to their book-to-market ratios. Nevertheless, we adjust our terminology be- cause, in our setting, stocks would be expected to trade closer to a book-to-

4 In additional robustness tests we use a yearly sorting procedure as in Fama and French

(1993). Overall, our results are similar, but slightly weaker, using the annual sorting

procedure. The comparison highlights the virtues of the monthly sorting procedure. The

additional results are presented in the Appendix in Tables AII.

(17)

market ratio of around 1 since the NAV is supposed to be a more reliable proxy for intrinsic value.

In terms of NAV, discounts should theoretically fluctuate around 0, where the stocks that trade at the highest discounts are referred to as value stocks.

We calculate the NAV per share (or the book value of equity) by dividing Datastream’s “common equity” by “number of shares.” The discount to NAV is calculated with respect to the “unadjusted share price” as reported by Datastream. Because stocks may also trade at a premium to NAV, we term our sorting criteria NAV spread: 5

NAV Spread i,t = Price i,t

NAV i,t − 1 (1)

To test whether absolute or relative mispricing is better suited to capture the value premium (Hypothesis 3), we also form portfolios based on the NAV discount of stock i in country j relative to the average NAV discount in country j, as follows:

Relative NAV Spread i,j,t = NAV Spread i,j,t

− Average Country NAV Spread j,t

(2)

After sorting the sample based on month-end data for both measures, we form three portfolios and observe their total returns as reported by Datas- tream over the following month. The value portfolio (P1) is defined as the quintile of stocks with the highest discount to NAV; the middle three quin-

5 Note that, due to our research design, a sorting procedure based on price-to-book ratios

would result in exactly the same rankings.

(18)

tiles are defined as the middle portfolio (P2); and the growth portfolio (P3) is defined as the quintile of stocks with the highest NAV premiums. Further- more, we form a long-short portfolio (P1-P3), which represents an investment strategy of buying stocks that trade at the highest discounts to NAV and (short-)selling stocks with the highest NAV premiums. 6

All portfolios are constructed using equal weights. We do not consider value-weighted returns because our sample size is rather small, and value- weighting would place undue emphasis on individual stock performance.

Note also that all returns are in local currencies to ensure our results are not driven by exchange rate fluctuations.

Our approach of sorting global portfolios based on absolute or relative NAV spreads differs from that of Fama and French (1998), who use MSCI weights to construct portfolios from country-level value and growth portfo- lios. Our proxy for fundamental value enables us to be more granular. The comparability of NAVs across countries means we are able to form the global value portfolio according to absolute attractiveness – an approach that would hardly make sense in a setting with a poor proxy for fundamental value, het- erogeneous industries, or divergent accounting standards.

On the other hand, the approach of Fama and French (1998) avoids the problem of having a global value portfolio that excludes other countries’ value stocks, while relying too heavily on one country’s growth stocks. However, their approach is not well suited to capture relative mispricing as a poten-

6 In principle, short selling is allowed in each of the eleven countries in our sample, although

temporary bans on it are not unknown. However, our major empirical conclusions remain

unaffected, because they are predicated on the risk-adjusted performance of long positions

in the global value portfolios.

(19)

tial source of global diversification gains. It is again the comparability of accounting measures that enables us to identify stocks with the highest po- tential to catch up relative to their peers in the same country. The approach of Fama and French (1998) can be understood as a compromise between our two extremes.

3.3. Portfolio Characteristics

This subsection provides some insights into the pre-portfolio formation per- formance of value and growth stocks, average NAV spreads by country, and the country-level diversification of the two global value portfolios. Figure 1 shows the cumulative abnormal performance of value and growth stocks for the thirty-six months leading up to portfolio formation. The dotted line shows that value stocks on average underperform their country-specific benchmark by -14.8%; the solid line shows that growth stocks on average gain 7.7%. This suggests that NAV spreads are an effective measure for delineating between value and growth stocks.

Figure 2 shows the average NAV spreads by country, differentiating among the value, mid, and growth portfolios. The graphs reveal a substantial de- gree of variation of average NAV spreads across time and across countries.

Note that, particularly in the months prior to the financial crisis, there are

pronounced differences between the average NAV spreads for the value and

growth portfolios of Canada, Hong Kong, Japan, and Singapore. Hence,

these countries should be relatively highly weighted within the global value

portfolio based on relative mispricing, even though value stocks from other

countries may have larger NAV discounts on an absolute basis. Interestingly,

(20)

the differences between the spreads in most countries tended to shrink during the financial crisis. This suggests that growth stocks experience a relatively stronger loss from repricing than value stocks, which fall from a much lower price level. Another argument in favor of the relative mispricing strategy stems from the observation that there are periods when growth stocks ac- tually trade at a discount to NAV. This is the case in Australia, Belgium, the Netherlands, Singapore, Sweden, and the U.K. during the financial cri- sis. Hence, these stocks may be part of the global value portfolio based on absolute NAV spreads, although they are not cheap on a within-country basis.

Figure 3 gives the portfolio allocations by country for the two global value portfolios. It is immediately evident that the holdings of both portfolios differ substantially from each other. During the first half of the sample period, the global value portfolio based on absolute NAV spreads was dominated by U.K.

stocks, with up to 75% in January 2008. As Figure 2 shows, this is because U.K. value stocks obtain the steepest discount to NAV compared to all other countries.

However, the average NAV spreads for U.K. stocks from the three mid quintiles are also lower than those of most value portfolios from other coun- tries. Thus, large parts of the global value portfolio based on absolute NAV spreads consist of U.K. stocks, which are not cheap relative to other U.K.

stocks. This contradicts the classical idea behind value investing. In contrast,

during the same time period, the global value portfolio based on relative NAV

spreads is dominated by stocks from Japan and Hong Kong – countries with

a particularly strong dispersion of NAV spreads.

(21)

We use the Herfindahl-Hirschman Index (HHI) to measure the degree of portfolio concentration by country for both global value portfolios. The HHI is defined as the sum of the squared portfolio shares in a given period, and can range from 0 to 1, with 1 representing perfect concentration. Figure 4 shows that the degree of portfolio concentration of both global value portfolios is generally comparable. However, the concentration of the global value portfolio based on absolute mispricing exhibits a strong spike between 2007 and 2008, reflecting the high exposure to U.K. stocks during that period.

Essentially, the relative mispricing strategy ensures that the global value portfolio does not become overly concentrated in one country. This is because at least 50% of each country’s stocks obtain positive relative NAV spreads.

In contrast, when all stocks of a country trade at NAV discounts, they could theoretically all become part of the global value portfolio based on absolute NAV spreads, leading to significant country risk.

3.4. Risk-adjusted Returns

To evaluate the risk-adjusted performance of our monthly trading strategy, we follow the mutual fund literature and use the Carhart four-factor model to obtain risk-adjusted returns (Carhart, 1997). We regress the excess returns of portfolio i on the excess return of the benchmark portfolio, as well as the size (SMB), book-to-market (HML), and momentum (WML) factors:

Excess return i,t = α i + β 1,i benchmark excess return t + β 2,i SMB t + β 3,i HML t + β 4,i WML t

(3)

(22)

The excess return of portfolio i is calculated as the equally weighted return of all portfolio constituents in excess of their respective local currency’s one- month risk-free rate. 7 We define the benchmark portfolio as the equally weighted portfolio of all stocks in our sample. Alternatively, we could use a broad stock market index that covers all sectors. However, this could result in all positive or all negative alphas for the three portfolios if the entire real estate sector over- or underperforms relative to the broad market. 8 We are interested only in the relative performance of the value portfolio within this particular sector, so we believe an equally weighted sector benchmark is most appropriate. It ensures that the average alpha of the three portfolios is 0. The excess return of the benchmark portfolio is also calculated as the equally weighted excess return of all stocks in our sample relative to their local currency risk-free rates.

In contrast to the benchmark portfolio, we do not restrict SMB, HML, and WML to the subsector of real estate stocks. This is done to reflect the orig- inal idea of the Carhart four-factor model, according to which SMB, HML, and WML are marketwide, and not industry-specific proxies for undiversifi- able factor risk. In our international context, it may seem straightforward to use global SMB, HML and WML factors. However, Griffin (2002) finds that domestic factor models explain time series portfolio variations much better than a world factor model. Thus, our SMB, HML, and WML factors are con-

7 The risk free rate is the local currency one-month deposit rate for each country, as reported by Datastream.

8 As a robustness check, we use the common broad market factor as opposed to the real

estate-specific benchmark factor. As Tables AI in the Appendix shows, the alphas remain

statistically significant.

(23)

structed according to the (time-varying) country weights of the benchmark portfolio.

The monthly SMB, HML, and WML factors are obtained from Kenneth French’s website. 9 French’s data library provides regional factors in USD for

“Asia Pacific ex Japan,” “Europe,” “Japan,” and “North America,” so we convert the regional USD returns into local currency returns for the respective countries.

3.5. Summary statistics

Table I contains the descriptive statistics of total returns and NAV spreads for individual countries and for the global sample over the 2005:01 to 2014:05 period. Panel A shows the data at the individual stock level; panel B shows the same metrics at the aggregate index level, which are also used as bench- mark portfolios. Panel A also reports the number of stocks per country and the total number of country-month observations; panel B reports the number of monthly portfolio observations for the indices.

The first column of panel A in Table I shows that the average monthly re- turn of all real estate stocks over our sample period is 0.86%. Average returns are the highest in Sweden (1.56%) and the lowest in Germany (0.03%). Panel B shows similar returns when aggregated at the index level, but, of course, return volatility is substantially reduced, especially for the global index and for countries with a large number of stocks. For example, the monthly return volatility of the global sample of stocks is 10.62%, but it is only 5.51% at the

9 http://mba.tuck.dartmouth.edu/pages/faculty/ken.french/datalibrary.html.

(24)

diversified index level.

Columns 3 and 4 of Table I show the mean and standard deviation of the NAV spreads. On average, the entire sample of real estate stocks trades at a 32.53% premium to NAV over the sample period. The average premium is highest in Canada with 94.45%, and lowest in the Netherlands, with an average discount to NAV of -3.83%. The standard deviations of the NAV spreads are in panel A. They reveal a substantial degree of cross-sectional variation in the relative pricing of stocks within countries. The index-level NAV spreads are in panel B, and indicate that there is also substantial vari- ation in the aggregate pricing levels over time and across countries. This suggests that the relative mispricing strategy that accounts for these country effects may be well suited to exploit cross-country potential mispricings.

Table II contains the correlation coefficients for the time series of returns and NAV spreads at the aggregate index level. The correlation of country- level return indices (or benchmark portfolios) is shown in Panel A. Panel B shows the same metrics for the subsector of value stocks for the respective countries. Interestingly, the correlations for the value portfolios tend to be lower than those for the benchmark portfolios. The average correlation across countries (i.e., excluding the correlation with the global portfolio) is 54% for the benchmark portfolios and 47% for the value portfolios. This suggests that the benefits of international diversification across the value stock sub- sector are higher than those that can be obtained from general cross-country diversification.

Panel C of Table II shows the correlations of the time series of average

country-level NAV spreads. Although the average correlation coefficient is

(25)

rather high at 60%, it is still far from perfect. Thus, international diversifi- cation benefits may also accrue from relative pricing levels across countries moving in different directions over time.

4. Empirical Results

4.1. Raw Returns

Table III shows the performance and portfolio characteristics of value (P1), middle (P2), growth (P3), and long-short (P1-P3) portfolios over the January 2005 to May 2014 period. While our primary objective is to examine the performance of globally diversified value portfolios, we also report results at an individual country level to provide a fuller sense of how country-level data tie to global data.

Columns 1-5 of Table III show the mean, standard deviation, minimum, and maximum of the portfolio returns, as well as the Sharpe ratio. Panel A reports results at an individual country level, and panel B reports results at the global level, where the portfolios are sorted according to either the absolute or relative NAV spread as described in section 3.2.

The country-level results in panel A reveal a consistent pattern regarding

the relative performance of the value portfolios. For example, the value port-

folio (P1) outperforms the growth portfolio (P3) in each country. Moreover,

except for France and the Netherlands, the value portfolio also outperforms

the middle portfolio (P2) in most cases. At the same time, the value portfo-

lios appear more risky, as indicated by the fact that the highest volatility for

the three portfolios is found in nine of the eleven cases. This outperformance

(26)

of the value portfolio is most pronounced in Germany, Japan, Singapore, and the U.K., where the average excess return of the long-short portfolio (P1-P3) is greater than 0.5% per month.

Overall, the country-level results are in line with the literature. And they lead us to the question whether the risk associated with the strong relative performance of the value portfolios at the individual country level can be diversified at the global level. However, we caution against overinterpreting the country-level results, because the number of portfolio constituents is very low in many cases. In contrast, the number of stocks in the value portfolio at the global level ranges from 21 to 38, which is sufficiently high from which to draw empirical conclusions.

Panel B shows the return distribution of the global portfolios that are constructed according to either absolute or relative NAV spreads. In gen- eral, the global-level results are consistent with the findings for individual countries. According to both sorting procedures, the value portfolio provides the highest returns, but it is also the most risky as measured by monthly return volatility. Overall, the results in Table III are in line with Hypothesis 1, which is tested in the following section where we examine risk-adjusted returns.

Interestingly, the value portfolio that is sorted according to relative mis-

pricing has both higher average returns (1.58% versus 1.46%) and lower risk

(6.96% versus 8.61%) than the value portfolio sorted according to absolute

NAV spreads. This result is in line with Hypothesis 3. On an annualized

basis, the global value portfolio based on relative mispricing outperforms its

global growth equivalent by 12.4%. The annualized value premium, defined

(27)

as the return of the value portfolio over the benchmark portfolio, is 10.4%.

Figure 5 illustrates the empirical evidence by plotting the cumulative log returns to the value, middle, and growth portfolios over the sample period.

The results are consistent with Table III: The cumulative returns to the value portfolio are highest in eight of the eleven countries. The outperformance of the two global value strategies is evident in the last two subfigures, where the graph for the relative mispricing strategy shows the most pronounced outperformance.

Over the entire sample period, the relative mispricing strategy produces cumulative log returns of 150.4%. This results in a cumulative outperfor- mance of 27.6%, compared to the absolute mispricing strategy with cumula- tive log returns of 122.8%. Figure 5 reveals that most of the outperformance occurs in the first half of the sample period. Until the first peak in May 2007, the relative strategy outperforms the absolute strategy by 16.7%. In the subsequent subperiod until the financial crisis peak in February 2009, the outperformance increases to 39.61%.

Figure 2 suggests that the outperformance is attributable to the country

allocations. The global value portfolio based on absolute mispricing is domi-

nated by U.K. stocks, with cumulative log returns of -135.3% until February

2009. Over the same period, the global value portfolio based on relative mis-

pricing is dominated by value stocks from Japan and Hong Kong, with much

higher cumulative log returns of -8.2% and 26.6%. This subperiod analysis

suggests that the relative mispricing strategy does particularly well in falling

markets.

(28)

4.2. Risk-adjusted Returns

Table IV contains the regression results for the Carhart four-factor model regressions, which are based on the same portfolios as in Table III. To test Hypotheses 1-3, our focus is on the intercepts of the regressions that can be interpreted as alphas or risk-adjusted returns, where the t-statistics indicate their statistical significance.

Panel A of Table IV contains the country-level results for the Carhart four-factor model regressions (Equation (3)). In general, alphas tend to be highest for the value portfolios (P1), and lowest for the growth portfolios (P3). However, only the alphas for the value portfolios of Belgium, Singapore, and the UK are significantly different from 0. The alphas for the long-short portfolio (P1-P3) are statistically significant for Germany, Singapore, and the UK.

The coefficients on the benchmark portfolios, or “betas,” can be inter- preted as measures of the respective portfolios’ exposures to systematic risk.

The betas of the value portfolios tend to be the highest, and the betas of the growth portfolios tend to be the lowest. This indicates that the growth portfolios carry lower systematic risk. As in Table II, Belgium and Hong Kong are the exceptions, with riskier growth than value portfolios. The R- squareds are generally relatively high, which is due to the narrow definition of the benchmark portfolio. This is particularly true for the middle portfolio (P2), where the overlap with the benchmark portfolio is 60% (three out of five quintiles). Again, the country-level results should be interpreted with caution because of the low number of portfolio constituents in many cases.

The resulting vulnerability to outliers may explain the lack of statistical sig-

(29)

nificance of most of the alphas, although the economic differences between them are generally substantial. Overall, and in conjunction with the country- level raw returns of Table III, the results are in line with Hypothesis 1: At the individual country level, value portfolios tend to produce higher returns in absolute terms, but not on a risk-adjusted basis.

However, our primary focus is on the global-level results, which are shown in panel B of Table IV. The alphas of both global value portfolios are positive and statistically significant. Furthermore, using both methods, the long-short strategy (P1-P3) produces even higher statistically significant risk-adjusted returns. These results are consistent with hypothesis 2 and suggest that the country-specific component of the factor risk of value stocks can be diversified at a global level. Comparing the alpha coefficients for methods 1 and 2 reveals that the relative mispricing strategy (method 2) produces better risk- adjusted returns than the absolute mispricing strategy (0.77% per month vs. 0.58% per month). This result supports Hypothesis 3: The relative mispricing strategy is better suited to capture the global value premium.

Comparing the beta coefficients provides a potential explanation for the differences in the risk-adjusted performance of both global portfolios. The beta of the method 1 strategy is 1.24, while the beta of method 2 is only 1.11, which suggests the latter value portfolio is less exposed to systematic risk.

The analysis of the portfolio sensitivities with respect to the other system- atic risk factors SMB, HML, and WML reveals further important insights.

Although we may expect that the value portfolios will load heavily on the

book-to-market factor (HML), this is actually only true in Germany and for

(30)

the global value portfolio sorted according to absolute NAV spreads. In- terestingly, the global value portfolio sorted by relative NAV spreads is not sensitive to the book-to-market factor. This suggests that sorting the global value portfolio according to relative mispricing reduces its risk exposure with respect to the global book-to-market factor. However, the global value port- folio of method 2 is sensitive with respect to the SMB factor, although this is not true for method 1. Nevertheless, even after controlling for the small stock risk factor, the risk-adjusted performance of method 2 remains highly significant.

Consistent with the anti-cyclical nature of value investing strategies, both global value portfolios load negatively on the WML factor. The portfolio sorted according to absolute mispricing is even less exposed to the momentum risk factor than that sorted according to relative mispricing. 10

In summary, NAV spreads are a good indicator of future performance. 11 The country-level results show that value stocks have higher returns, but

10 To test whether the risk exposures of the global value portfolios change over time, we examine thirty-six-month rolling windows for the time variation in the risk loadings. In untabulated results, we find that the risk loadings on MKT are relatively constant for both strategies, while those on SMB, HML, and WML tend to vary somewhat over the sample period. However, a comparison of the R-squareds in Table IV suggests that SMB, HML, and WML do not contribute much explanatory power to our model. Hence, time variation in the risk loadings does not appear to be critical to our major empirical findings.

11 Potentially, other measures of price-to-fundamental value may lead to the same relative sort, even if the absolute sort is different. As suggested by an anonymous referee, we use alternative measures of price-to-fundamental value to test this theory. The results of additional robustness checks show substantial differences when we use the price-to-earnings ratio or the ratio of price to funds from operations (FFO) as alternative ranking criteria.

Only in the case of the global value portfolio sorted according to the P/E ratio do we find

weak evidence of outperformance. These alternative results strengthen our arguments in

favor of NAV spreads as reliable indicators of discrepancies between price and fundamental

value. These results are available from the authors upon request.

(31)

are also more risky. The relatively high risk of value stocks at a country level can be reduced significantly by a global diversification strategy. Based on the common four-factor Carhart model, both global value investment strate- gies provide superior risk-adjusted returns. However, both the single-factor model results, and a comparison of the economic and statistical significance of the alpha coefficients, suggest the strategy based on relative NAV spreads (method 2) continues to outperform the strategy based on absolute NAV spreads. 12

4.3. Return Dynamics

The outperformance of the relative mispricing strategy can be traced back to higher returns and less risk. The geographic allocations of both global value portfolios shown in Figure 3, however, suggest that the relative mispricing strategy is more effective at avoiding excessive risk exposure to individual countries. While international diversification certainly helps improve returns after adjusting for risk, it is less clear why the relative mispricing strategy would also produce higher absolute returns.

To answer this question, we believe the short-term nature of the monthly trading strategy needs to be considered . As shown in Figure 2, it is not uncommon for the value stocks of individual countries to trade at substan- tial discounts to NAV over extended periods. For this reason, a monthly

12 At the request of an anonymous referee, we also test the robustness of our results by

using a five-factor model, which includes the liquidity factors suggested in Pastor and

Stambaugh (2003). We use both the traded and the untraded liquidity factors provided

on Lubos Pastor’s homepage. In both cases, the results are robust and consistent with the

results in Table IV. These results are available from the authors upon request.

(32)

investment horizon may not be the most efficient way to exploit absolute mispricings. Of course, relative mispricings may also persist for extended pe- riods. However, as Figure 2 suggests, country-level dispersions between value and growth stocks can be extreme , but do not generally remain that way for long periods. In effect, both investment strategies invest in stocks with the strongest respective disequilibria in a given month. In the end, success depends on the strength and on the speed of reversion of the disequilibrium.

Figure 6 shows the cumulative abnormal returns (CARs) of the global value and growth portfolios for both strategies over the thirty-six months following portfolio formation. The gray dashed line shows the CARs for the global value portfolio based on relative mispricing; the black dashed line shows the performance based on absolute mispricing.

While the global value portfolio based on absolute mispricing produces higher returns over the complete thirty-six-month period (5.66% versus 0.81%), the relative mispricing wins over the short run. It exhibits higher returns (0.62% versus 0.45%) in the first month following portfolio formation, and leads the absolute strategy until the seventh month afterward. This suggests that relative mispricing disequilibria tend to be reversed more quickly and more intensively, while the absolute strategy produces better returns in the long run.

The results for the global growth portfolios are consistent. Initially, the

CARs for the relative mispricing portfolio are more negative than those for

the absolute mispricing portfolio. The return differential increases until the

eighteenth month after portfolio formation. However, after thirty-six months,

the CARs of the portfolio based on absolute mispricing are more negative

(33)

than those based on relative mispricing (-5.38% versus -4.00%). Together, these results suggest that the short-term dynamics of the relative mispricing strategy are better suited for a monthly trading strategy, while the absolute mispricing strategy appears to work better over longer investment horizons.

4.4. Discussion

Our empirical results are consistent with the literature on the value premium, which suggests that absolute mispricing is important in terms of predicting future returns. However, we also find that relative mispricing is even better at predicting future returns. What is the theory that predicts investors care about relative mispricing? 13

To the best of our knowledge, there is no extant literature on the concept of relative mispricing as introduced here. However, a related investment strategy known as “pairs trading” is widely applied by active investors such as hedge funds or investment banks. Gatev et al. (2006) describe pairs trading as a statistical arbitrage tool. The idea is to find two stocks whose prices have moved together historically. When the spread between them widens, the investor shorts the winner and buys the loser. Gatev et al. (2006) find that this trading rule on average yields up to 11% annualized excess returns.

Due to their homogeneity, real estate stocks from the same country are natural candidates for pairs with equilibrium relationships. Mori and Zio- browski (2011) examine a pairs trading strategy for U.S. REITs, which we exclude here, and document superior profits for this strategy over common

13 We thank an anonymous referee for drawing our attention to this issue.

(34)

stocks for the 1993-2000 period. Accordingly, the relative mispricing strat- egy introduced in this paper can also be thought of as a global-level pairs trading strategy, which invests in pairs with the strongest price dispersions.

The global investment spectrum increases the chances of finding pairs with substantial price dispersion. At the same time, cross-country diversification should reduce systematic country risk to some extent.

While both investment strategies are theoretically appealing, the question is whether real-world investors actually behave this way, in other words, whether they care about absolute or relative mispricing. Theoretically, any active investor trying to beat a passive benchmark index might consider trading signals based on absolute or relative mispricing.

Actively managed equity mutual funds with a focus on real estate stocks are an important group of investors. Worldwide, there are 1,173 of these funds, with total assets under management of $264.6 billion as of December 2016, according to Morningstar Direct. Among these, 251 invest globally, while 922 are focused on specific regions or countries.

The absolute mispricing strategy can be applied at either a global or an individual country level. Interestingly, there is some empirical evidence that real estate mutual funds are able to beat their benchmark, which is generally not the case for common equity mutual funds. For example, Gallo et al.

(2000) find that the U.S. REIT mutual funds in their sample outperform their benchmark as a group by more than 5% per year on a risk-adjusted basis. Cici et al. (2011) also document significant positive alphas for U.S.

REIT mutual funds. Consistent with a focus on absolute mispricing signals,

the authors find evidence that part of the outperformance is related to NAV-

(35)

to-price ratios.

In contrast, the relative mispricing strategy requires a global investment spectrum. To the best of our knowledge, we are not aware of any studies on the performance of REIT mutual funds at the global level.

There are also institutional reasons why the relative mispricing strategy yields better results than the absolute mispricing strategy. For example, it appears to better control for various types of systematic differences across countries, such as differences in accounting practices, which may justify sys- tematically different levels of NAV discounts. While Horton et al. (2013) note that the introduction of IFRS and associated fair value-based account- ing regimes in many countries has increased the information quality and accounting comparability across countries, Kvaal and Nobes (2010) reject the hypothesis that IFRS practices are the same across countries. Hence, the international comparability of accounting data remains inadequate.

A similar argument can be made for cross-country differences regarding tax regimes. Note that the REIT structure that is so prevalent in many companies in our sample is often associated with strong tax advantages.

Consequently, a higher premium to NAV would be warranted for REIT- dominated countries, or for countries with low corporate taxes. This may explain the high average premium to NAV for Canadian stocks, which are all classified as REITs, and are hence not subject to taxation at the corporate level.

Hence, a fair value-based NAV is clearly an imperfect measure of funda-

mental value, although it is certainly better than historical cost-based book

values of, e.g., tech companies. Therefore, large NAV discounts may simply

(36)

be justified, or at least uncertainty regarding the justification may warrant a risk premium.

We acknowledge some potential limitations of our study. To avoid the im- pact of exchange rate effects on our results, for example, we consistently use local currency returns, which assume fully hedged positions. And accounting for hedging costs would reduce absolute performance, but our major impli- cations regarding the relative performance of the global value portfolio over the global growth portfolio should be unaffected.

Furthermore, we do not account for transaction costs, which may be particularly high if portfolios are rebalanced on a monthly basis. Currency hedging costs should exhibit a symmetrical effect on all portfolios and on the benchmark. But transaction costs may be more detrimental to a global value portfolio if it invests predominantly in smaller, and hence potentially less liquid, stocks with higher transaction costs.

We attempt to minimize any issues caused by small and illiquid stocks by choosing an index with particularly strong minimum liquidity requirements.

For this reason, Serrano and Hoesli (2009) find that the FTSE/EPRA Global Real Estate Index is well suited to evaluate the performance of active trading strategies. 14 Nevertheless, the global value portfolio sorted according to rela- tive mispricing loads significantly on the SMB factor, which suggests relative transaction costs are higher. Assuming that transaction costs for stocks in

14 As suggested by a referee, we run two additional robustness tests to ensure the minimum

liquidity requirements of the FTSE/EPRA Global Real Estate Index are sufficient. First,

we exclude the decile of stocks with the lowest market capitalization by country. Next, we

exclude the decile of stocks with the highest bid-ask spreads. In both cases, our results

remain robust and consistent with the Table IV results. The results are available from the

authors upon request.

(37)

the global value portfolio are 0.5% higher per trade, and assuming an annual turnover rate of 100% for all portfolios and the benchmark, the annualized value premium would be reduced by 1%.

5. Conclusion

This paper examines a global value investment strategy in the context of fair value-based NAVs as proxies for fundamental value. We consider a special case of global diversification by focusing on value stocks whose risk-return profiles make potential diversification gains particularly desirable. We use a sample of 255 real estate stocks in 11 countries with fair value-based account- ing regimes over the 2005-2014 period. We find the value premium can be captured using a global investment strategy, but only when based on relative instead of absolute mispricing.

Investing in the most attractively priced stocks relative to their peers in the same country seems a particularly suitable way to benefit from short-term return dynamics. Our results suggest that the country-level “catching-up”

processes are driving our results. Because there are few theoretical reasons

why this type of mean reversion at a country level would be highly correlated

across countries, this opens the potential for strong diversification gains,

which may ultimately explain the superior risk-adjusted returns. Overall,

our results suggest that the value premium is diversifiable, at least at a

global level. This finding is in contrast to Fama and French (1993), who

argue that the excess returns of value stocks are subject to undiversifiable

factor risk.

(38)

While our empirical results are based on a sample of real estate stocks,

our findings have broader implications. In principle, we believe our empiri-

cal approach, which includes the methodological innovation of sorting stocks

based on relative NAV spreads, could be transferred to any international or

intersectoral dataset that provides relatively reliable estimates of fundamen-

tal value.

(39)

References

Asness, C. S., T. J. Moskowitz, and L. H. Pedersen (2013). Value and Mo- mentum Everywhere. Journal of Finance 68 (3), 929–985.

Ball, R. (2006). International Financial Reporting Standards (IFRS): pros and cons for investors. Accounting and Business Research 36, 5–27.

Bernard, V. L. and J. K. Thomas (1989). Post-earnings-announcement drift:

delayed price response or risk premium? Journal of Accounting Research, 1–36.

Brounen, D. and M. Laak (2005). Understanding the Discount: Evidence from European Property Shares. Journal of Real Estate Portfolio Man- agement 11 (3), 241–251.

Carhart, M. M. (1997). On persistence in mutual fund performance. Journal of Finance 42 (1), 57–82.

Choi, J. (2013). What Drives the Value Premium?: The Role of Asset Risk and Leverage. Review of Financial Studies 26 (11), 2845–2875.

Cici, G., J. Corgel, and S. Gibson (2011). Can Fund Managers Select Out- performing REITs? Examining Fund Holdings and Trades. Real Estate Economics 39 (3), 455–486.

Daniel, K. and S. Titman (2006). Market Reactions to Tangible and Intan-

gible Information. Journal of Finance 61 (4), 1605–1643.

(40)

Davis, J. L., E. F. Fama, and K. R. French (2000). Characteristics, Covari- ances, and Average Returns: 1929 to 1997. Journal of Finance 55 (1), 389–406.

De Bondt, W. F. M. and R. Thaler (1985). Does the Stock Market Overreact?

Journal of Finance 40 (3), 793–805.

EY (2011). Surveying IFRS for Real Estate - Current issues and financial statements survey 2010/2011.

Fama, E. F. and K. R. French (1992). The Cross-Section of Expected Stock Returns. Journal of Finance 47 (2), 427–465.

Fama, E. F. and K. R. French (1993). Common risk factors in the returns on stocks and bonds. Journal of Financial Economics 33 (1), 3–56.

Fama, E. F. and K. R. French (1995). Size and Book-to-Market Factors in Earnings and Returns. Journal of Finance 50 (1), 131–155.

Fama, E. F. and K. R. French (1998). Value versus Growth: The Interna- tional Evidence. Journal of Finance 53 (6), 1975–1999.

Fama, E. F. and K. R. French (2012). Size, value, and momentum in inter- national stock returns. Journal of Financial Economics 105 (3), 457–472.

Ferson, W. E., S. Sarkissian, and T. Simin (1999). The alpha factor asset pricing model: A parable. Journal of Financial Markets 2 (1), 49–68.

Gallo, J. G., L. J. Lockwood, and R. C. Rutherford (2000). Asset Allo-

cation and the Performance of Real Estate Mutual Funds. Real Estate

Economics 28 (1), 165–185.

(41)

Gatev, E., W. N. Goetzmann, and K. G. Rouwenhorst (2006). Pairs Trad- ing: Performance of a Relative-Value Arbitrage Rule. Review of Financial Studies 19 (3), 797–827.

Griffin, J. M. (2002). Are the Fama and French factors global or country specific? Review of Financial Studies 15 (3), 783–803.

Horton, J., G. Serafeim, and I. Serafeim (2013). Does Mandatory IFRS Adop- tion Improve the Information Environment? Contemporary Accounting Research 30 (1), 388–423.

Kvaal, E. and C. Nobes (2010). International differences in IFRS policy choice: A research note. Accounting and Business Research 40 (2), 173–

187.

Lakonishok, J., A. Shleifer, and R. W. Vishny (1994). Contrarian Investment, Extrapolation, and Risk. Journal of Finance 49 (5), 1541–1578.

Lee, C. M. C., J. Myers, and B. Swaminathan (1999). What is the Intrinsic Value of the Dow? Journal of Finance 54 (5), 1693–1741.

Liang, L. and E. J. Riedl (2013). The Effect of Fair Value versus Histori- cal Cost Reporting Model on Analyst Forecast Accuracy. Accounting Re- view 89 (3), 1151–1177.

Liew, J. and M. Vassalou (2000). Can book-to-market, size and momen-

tum be risk factors that predict economic growth? Journal of Financial

Economics 57 (2), 221–245.

(42)

Lintner, J. (1965). The Valuation of Risk Assets and the Selection of Risky Investments in Stock Portfolios and Capital Budgets. Review of Economics and Statistics 47 (1), 13–37.

Mori, M. and A. J. Ziobrowski (2011). Performance of Pairs Trading Strategy in the U.S. REIT Market. Real Estate Economics 39 (3), 409–428.

Ooi, J., J. R. Webb, and D. Zhou (2007). Extrapolation Theory and the Pricing of REIT Stocks. Journal of Real Estate Research 29 (1), 27–56.

Pastor, L. and R. F. Stambaugh (2003). Liquidity Risk and Expected Stock Returns. Journal of Political Economy 111 (3), 642–685.

Patel, K., R. A. M. G. Pereira, and K. V. Zavodov (2009). Mean-Reversion in REITs Discount to NAV & Risk Premium. Journal of Real Estate Finance and Economics 39 (3), 229–247.

Petkova, R. and L. Zhang (2005). Is value riskier than growth? Journal of Financial Economics 78 (1), 187–202.

Pontiff, J. (1995). Closed-end fund premia and returns implications for finan- cial market equilibrium. Journal of Financial Economics 37 (3), 341–370.

Porta, R. L., J. Lakonishok, A. Shleifer, and R. Vishny (1997). Good News for Value Stocks: Further Evidence on Market Efficiency. Journal of Fi- nance 52 (2), 859–874.

Rosenberg, B., K. Reid, and R. Lanstein (1985). Persuasive evidence of

market inefficiency. Journal of Portfolio Management 11 (3), 9–16.

(43)

Serrano, C. and M. Hoesli (2009). Global securitized real estate benchmarks and performance. Journal of Real Estate Portfolio Management 15 (1), 1–19.

Sharpe, W. F. (1964). Capital asset prices: A theory of market equilibrium under conditions of risk. Journal of Finance 19 (3), 425–442.

Shiller, R. J. (1981). Do Stock Prices Move Too Much to be Justified by Subsequent Changes in Dividends? American Economic Review 71 (3), 421–436.

Shiller, R. J., S. Fischer, and B. M. Friedman (1984). Stock Prices and Social Dynamics. Brookings Papers on Economic Activity 1984 (2), 457–510.

Vassalou, M. (2003). News related to future GDP growth as a risk factor in equity returns. Journal of Financial Economics 68 (1), 47–73.

Zhang, L. (2005). The Value Premium. Journal of Finance 60 (1), 67–103.

Abbildung

Figure 1: Performance of Value and Growth before Portfolio Formation −.15−.1−.050.05.1
Figure 2: Average NAV Spreads by Country and Portfolio −1 01234
Figure 3: Portfolio Allocations by Country for Global Value Portfolios 0%10%20%30%40%50%60%70%80%90%100% Jan 05 Apr05 Jul05 Okt05 Jan06 Apr06 Jul06 Okt06 Jan07 Apr07 Jul07 Okt07 Jan08 Apr08 Jul08 Okt08 Jan09 Apr09 Jul 09 Okt09 Jan10 Apr10 Jul 10 Okt10 Jan1
Figure 4: Herfindahl Index for the Global Value Portfolios 00,10,20,30,40,50,60,7
+7

Referenzen

ÄHNLICHE DOKUMENTE

We take the whole of this body of work as read, in what we present here, for the simple reason that we do not have the time to repeat it. We do not repeat it also because we have

The liquidation measures of formation causes of some optimal Measures to liquidate the formation causes of stocks over the optimal ones regard the preparation on time and in close

In particular, we found that the number “8” is associated with plates with significantly higher winning bids, and the number “4” is associated with plates with significantly

(ii) This theorem is related to the result in Santos and Woodford (1997, Theorem 3.3), that asserted that, under uniform impatience, assets in positive net supply are free of

Despite agents accumulate the wealth in time that is increasing due the returns of their portfolios, they make decisions upon the value of VaR of the four alternatives in time

Applying the bene fi t chain concept, we compare the costs of GEOSS-type data of some 12,000 USD to the incremental bene fi ts of more accurate information on current ecosystem

Maps were generated at the block level for the total primary energy consumption for space heating and domestic hot water in the current state, the total energy savings potential

Summarizing all in one, the main result that follows from current analysis is that the microstructure theories can be to a certain extent successfully tested and different