Report No. 15
South Asia Human Development Sector
Bangladesh
School choice and cognitive achievement in rural Bangladesh
June 2006
Discussion Paper Series
38012
Public Disclosure AuthorizedPublic Disclosure AuthorizedPublic Disclosure AuthorizedPublic Disclosure Authorized
School choice and cognitive achievement in rural Bangladesh∗
Mohammad Niaz Asadullah1*
Nazmul Chaudhury2*
Amit Dar2
June 2006
1: ESRC Centre on SKOPE, Oxford University 2: The World Bank
South Asia Human Development Unit
∗ This study does not necessarily represent the views of The World Bank or Governments they represent. Contact Authors: Mohammad Niaz Asadullah (mohammad.asadullah@economics.ox.ac.uk); Nazmul Chaudhury (nchaudhury@worldbank.org).
ACRONYMS AND ABBREVIATIONS
CFE Classroom Fixed Effects FSP Female Stipend Program
FSSAP Female Secondary School Assistance
IAEEA International Association for the Evaluation of Education Achievement NGO Non Governmental Organization
OLS Ordinary Least Squares PSU Primary Sampling Unit SFE School Fixed Effects SRS Simple Random Sampling SSC Secondary School Certificate
TIMSS Trends in International Mathematics and Science Study UFE Union Fixed Effects
TABLE OF CONTENTS
1. Introduction ……… 1
2. Background: Secondary Schooling in Bangladesh ………... 3
3. Methodology ……….. 5
4. Data ………... 9
5. Students performance in primary-standard mathematics test ………... 12
6. Determinants of secondary school achievement: Regression Results ………….. 14
7. Summary and Conclusion ……….. 19
8. References ……….. 22
9. Appendices ………...………. 24
Abstract
In this paper we present new evidence on the impact of school characteristics on secondary student achievement using a rich data set from rural Bangladesh. We deal with a potentially important selectivity issue in the South Asian context: the non-random sorting of children into religious schools. We do so by employing a combination of fixed effects and instrumental variable estimation techniques. Additionally, we use the variation between two classrooms of the same grade within individual schools to identify causal class-size effects. Our empirical results do not reveal any difference in test scores between religious and secular schools when selection into religious school is taken into account. Net of school fixed-effects, we do not find evidence in support of smaller class size. However, we document significant learning deficit by gender and primary school type: girls and graduates of primary madrasas have a lower test score even after controlling for school and classroom-specific unobservable correlates of learning.
JEL classification: I21, Z12, O12, O15.
Key words: Religious schools, fixed-effects, female education, Bangladesh.
1. Introduction
A hallmark of the educational landscape in Muslim majority countries is the presence of madrasas or religious schools. In Bangladesh, these schools are growing in numbers and in a majority of cases offer a modern curriculum where children are educated in secular subjects alongside religious studies. Graduates of these schools are eligible for further education in mainstream, secular institutes of higher education in the country. In the rural areas of Bangladesh, public secondary schools are rare so that households choice is limited between private secular and religious education.
Unsurprisingly, modernized madrasa (aka Aliyah madrasas) is a popular option for many rural parents to educate boys and girls alike. Today, these madrasas account for 15% of the total post- primary enrollment in the country and compete with secular schools in attracting female students (Asadullah and Chaudhury, 2006a). Consequently, half of the madrasa students are girls (Asadullah and Chaudhury, 2006b).
Beyond the role played in equalizing access to secondary education by gender, the overall significance of madrasas in expanding educational opportunities remains unclear. The nature and level of student learning in these religious seminaries remain poorly understood. Do these schools effectively impart important life skills and adequately prepare individuals for the labor market? This question is of relevance for governments in countries with a large Muslim population where religious school enrolment is on the rise. Yet, extant surveys on school quality in Bangladesh and elsewhere routinely leaves out religious schools from the sample and hence inept in addressing the question of relative quality of madrasas.
In the absence of comparable survey data on religious and secular schools, researchers have tried to use existing household survey data set that contains information on individuals’ school type. Such data has been used by Beegle and Newhouse (2005) for Indonesia. Madrasas in Indonesia are similar to Bangladesh – they offer a modern curriculum and are recognized by the government. Beegle and Newhouse use public examination records on graduates of secondary junior schools and assess the relative effectiveness of private vs. public schools. The different school types examined were public madrasa, private secular, private madrasa, private other Muslim and non-Muslim religious schools.
Their study finds that students attending public madrasas perform no worse than those attending public secular schools, and students attending private madrasas perform no worse than their counterparts in private secular schools. Whilst intriguing, it is difficult to say anything about the efficacy of religious school performance based on single country experience.
In this study, we assess the quality of religious and secular education in rural Bangladesh using a unique, large-scale survey of secondary schools. Quality is measured on the basis of the performance of students in mathematics, collected using two standardized tests. The first test assesses competency in secondary-standard mathematics whilst the second focuses on primary-standard mathematics skills.
Assessing the quality of madrasas vis-à-vis secular schools is not straightforward using a cross section of data. In the rural areas with inadequate public provision, parents choose between private secular and religious schools. Despite adoption of a modern curriculum, religious schools differ from secular ones in many ways (e.g. they explicitly emphasize the importance of religious values and discipline in life). This raises the possibility of non-random selection. Parents who value secular learning over religious teaching opt for secular schools. Such parents may also instill in their children a strong desire to learn and/or spare more time at home to tutor children so that simple cross-
section estimate of the relationship between private school (over madrasa) attendance and test score would be upward biased. Yet, we are not aware of any study that has addressed the question of what determines selection into religious schools and how, conditional on selection, student learning in these schools compare to that in secular schools1.
Such concern over non-random selection in schools on the basis of observed and unobserved parental (and child) attributes has been the subject matter of the broader discourse on educational production function in the economics literature for the last two decades. Selection effects give rise to the problem of identification of educational production functions which have plagued much of the empirical literature on the determinants of student achievement. Consequently, the extant research on the relationship between student achievement and school inputs offer limited policy insights (Hanushek, 1997; Kremer, 2000; Todd and Wolpin, 2003; Case, 2005). This is particularly true for research on developing countries where school surveys seldom collect data on exogenous school inputs and are rarely designed to account for endogenous school choice (Glewwe, 2002).
Designing surveys that gather detailed information on students, teachers and schools potentially limits the prospect of bias that arise owing to non-random sorting on the basis of observed attributes of the student or her family. But it may not fully rule out the possibility of selection on attributes that are unobserved by the researcher (Case, 2005). Ideally, one should exploit an experimental or quasi-experimental setting which gives rise to exogenous variation in educational inputs. This has been attempted in a number of recent studies (Case and Deaton, 1999; Angrist and Lavy, 1999). Nonetheless, experimental data is costly to collect; quasi-experimental settings akin to Angrist and Lavy (1999) are also rare. Consequently, careful design of the sample with the explicit objective of circumventing the problem of identification is the way forward.
Researchers who have sought to model school selection seek to find variables that are uncorrelated with student outcomes yet predicts selection into a given school type. A variety of instruments have been constructed in the literature either using demand- or supply-side information. The former relates to exogenous personal attributes that are correlated to preference for a particular school type yet arguably uncorrelated with learning outcomes. The supply-side related instruments usually exploit information on the availability of a given school type and attributes of schools available in one’s residential vicinity. Developing country studies that have adopted the second strategy are Beegle and Newhouse (2005), Alderman et al (2001), Glewwe et al. (1995) and Glewwe and Jacoby (1994). The latter three are intuitively more appealing as they use characteristics of the school not chosen as the identifying variables, instead of data on the availability of a given school type.
A much richer and innovative application of the instrumental variable technique using demand-side information can be found in developed country literature. In analyses of the influence of Catholic schooling on learning outcomes, US researchers used as instruments the religious beliefs of the student’s family (Evans and Schwab, 1995; Neal, 1997), proportion of Catholics in the area, proximity of Catholic schooling, urbanity (Evans and Schwab, 1995; Neal, 1997), and interactions between religious beliefs and urbanity (Sander 1996). More recently Figlio and Stone (2000) have used variables such as the crime rate in the county, concentration of the public schools in the county (i.e. public school student to teacher ratios) and community characteristics to model selection into a given school type.
1 For instance, neither Beegle and Newhouse (2005) nor Bedi and Garg (2000) address the issue of selection into religious schools in their research using Indonesian data.
In this revisionist study of educational production in developing countries, we address the question of school choice, namely selection into madrasas, in an instrumental variable framework. Our study follows Alderman et al (2001) and use information on the quality of un-chosen school in one’s administrative neighborhood to construct instruments. In addition, drawing upon the US studies, we use measures of parental religiosity as an additional instrument. To the best of our knowledge, there is no study for a developing country that has tried to model selection into religious schools. We further contribute to the existing literature by producing estimates of production functions that are identified on the basis of within-school variation in inputs.
We find that school quality in rural Bangladesh, when assessed in terms of student performance in secondary-standard mathematics test, remains very low. This is true even when we look at performance in primary-school standard mathematics test. The mean percentage correct answers were 37.5% and 77% in secondary-standard and primary-standard mathematics tests respectively. Our regression analysis reveals that girls perform poorly when compared to boys. Among teacher-related inputs, a higher fraction of female teachers significantly increases student test scores. Madrasa students have a significant learning disadvantage compared to students of secular schools. However, once we correct for the endogeneity of enrolment in madrasas, the negative effect of madrasa enrolment becomes insignificant. To investigate the effects of school inputs such as class size and type of primary school attended, we exploit between- classroom variations in school inputs. This yields estimates that are immune to the problem of school choice. We find that graduates of primary madrasas have a significantly low score, a finding that is robust to further control for classroom- specific unobservable factors. However, we do not find any significant effect of class size reduction on student achievement.
The balance of the paper is as follows. Section two provides background information –current state of secondary schooling in rural Bangladesh. Section 3 elaborates on the empirical strategy. Data and sample are discussed Section in section 4. Results are discussed in section 5 whilst section 6 concludes by discussing the implication of our findings for education policy design in Bangladesh.
2. Background: Secondary schooling in Bangladesh
There are two levels of secondary education in Bangladesh, spanning grades 6 to 10. The first level, Junior Secondary, runs for 3 years (grades 6-8) from the ages of 11 to 13 and entrance is via examinations conducted by individual schools. The second level, secondary education (grades 9-10), runs for two years leading up to the Secondary School Certificate (SSC) at the age of 15/16. A typical secondary school consists of grades 6 to 10. Secondary schools in Bangladesh differ in terms of management type and their religious orientation. Most of the schools are managed and owned privately; share of public schools is very small at the secondary level. This is true even if we differentiate between recognized religious (madrasa) and secular mainstream schools. In the former category, almost all the schools belong to the private sector. Table 1 below summarizes the distribution of schools across various types in Bangladesh.
Table 1: Secondary schools and madrasas in Bangladesh, 1980-2003
Year Public school Private school Total # of secondary schools
1980 175 8310 8485
1990 295 10153 10448
1995 317 11695 12012
2003 317 17069 17386
Year Public madrasa Private madrasa Total # of secondary madrasa
1980 3 2681 2684
1990 3 5790 5793
1995 3 5974 5977
2003 3 8407 8410
Source: Ministry of Education, Government of Bangladesh.
Despite their private ownership, secondary schools and madrasas in the non-government sector remain under significant government influence. The majority of these educational institutions regularly receive aid from the government to finance teacher salary. Government contribution accounts for 90% of the monthly teacher salary bill in almost all government recognized private schools and madrasas in rural Bangladesh. For this reason, teacher incentive regime in rural areas does not vary much across schools and madrasas in the rural area. These recognized madrasas are comparable to private schools for another reason. They offer a modern curriculum where alongside religious subjects, students are educated in mathematics, science, English and geography. Upon completion of grade 10, they appear in the SSC examination which is organized separately by the Madrasa Education Board. Graduates of madrasas are eligible for admission in mainstream educational institutes for higher education. They also compete with their secular schooled peers for employment in the public sector2.
Reliable data on the performance of Bangladeshi students in internationally comparable scholastic tests are not available. Bangladesh has not participated in international tests such as TIMSS. Locally administered tests of students on secondary school achievement are almost non-existent.
Nonetheless, it is possible to assess the quality of secondary indirectly by looking at the performance of secondary school students in primary-standard tests. A comprehensive and careful study in this direction is Greaney et al. (1999). Greaney et al. developed a basic test of learning skills in reading, writing, written mathematics and oral mathematics and administered it to a sample of 5235 individuals, aged 11 years or older, in 1992 in 29 (rural) thanas. The authors found that 59 percent of a sample of rural children age 11 and older correctly answered only five or fewer of eight tasks requiring recognition of one- and two-digit numbers, writing one-digit numbers and recognizing basic geometric shapes. This figure is somewhat larger for primary school graduates who have completed some secondary schooling. Even then, 20% of the grade 8 completers failed to attain basic competency in mathematics (Greaney et al., 1999). Given the rudimentary nature of the test items, this finding suggests that the level of school quality in rural Bangladesh is very low.
In the absence of individual level test score data on secondary schools, other extant studies have either used data on school level performance in public examination or have analysed labour market performance of graduates of different school types. For instance, Asadullah (2005a) uses school- level data on SSC pass rate on all secondary private, aided and public schools in seven districts in Bangladesh and explore the role of class size on examination performance. However, the study
2 For a comprehensive review of the madrasa education system in Bangladesh, see Asadullah and Chaudhury (2006b).
precludes religious schools. Two studies that shed some light on the relative quality of religious schools are Asadullah (2005a) and Asadullah (2006b). These papers document labour market returns to education by school type and report moderate wage disadvantage experienced by religious school graduates.
The relative performance of religious and secular school aside, other aspect of the current debate over secondary school quality involves boy-girl difference in achievement. This is owing to the existence of a gender-specific incentive schemes that today cover all rural and non-metropolitan urban areas of Bangladesh. Female students of both religious and secular (recognised) schools in rural and urban non-metropolitan areas benefit from a government subsidy scheme, also known as the Female Stipend Program (FSP). Since its initiation in 1994, Bangladesh has seen a steady rise in female enrolment in the rural area (see for instance, Table 1). Under the project, girls in grade 6 to grade 10 receive monthly stipends which cover the direct costs of schooling. The program has also increased the number of female teachers in rural schools. In sum, the stipend program has succeeded in changing the gender pattern of enrolment and composition of teachers in schools. The structural changes in the secondary education sector brought about by the stipend scheme are evident. Today, 6.5 to 20% of school teachers are female and 1 in every two student in a secondary school is a female. Girls are more likely to enrol school and complete higher grade compared to boys. Given the shortage of public schools for the provision of secondary education in the rural area, the government has included recognised religious schools in the stipend scheme. Consequently, half of the total enrolment in religious schools today also comprise of female students. The program has led to a large-scale expansion of religious schools in the rural area. Yet, the quality of these secondary schools has so far remained out of the policy debate, primarily for a lack of data on secondary school learning outcomes. In addition, whilst female enrolment has increased, it has allegedly come at the cost of retaining girls of low ability in school. Therefore, a study on secondary schools can not only fill the lacuna on the quality of religious and secular schools in the rural area it can also inform about the relative performance of boys vis-à-vis girls.
3. Methodology
As pointed out earlier, extant studies of the determinants of learning suffer from a number of methodological problems. Glewwe (2002) and Glewwe and Kremer (2005) critically review recent retrospective studies using developing countries. Four sources of potential biases are noted by Glewwe and Kremer:
i) Bias due to unobserved components of a child’s innate ability and motivation, as well as parents’ motivation; these unobserved elements could be positively correlated with school quality because high-ability children tend to enroll in higher quality schools.
ii) Bias owing to non-random allocation of government funds to schools – governments may build primary schools or allocate resources to secondary schools based on unobserved community characteristics.
iii) A variety of sample selection bias. Some children never attend school or drop out prematurely. Bias also arises if weak students are less likely to drop out of high quality schools, the impact of school quality could be underestimated (unless student ability is adequately measured).
Biases can also arise due to the choices parents make regarding the schools their children attend and actions parents may take to change those schools, since this may also cause child and household variables to be correlated with unobserved components of school quality.
iv) Bias due to omitted school and teacher quality variables. If unobserved school and teacher variables are positively correlated with observed school and teacher variables, the estimated impacts on the observed variables will tend to be biased upward.
Our analysis of the determinants of test score centers on the estimation of a reduced form educational production function as specified by equation (1):
' ' '
ij = i 1 + Yi 2 + Zij 3 + ij
T X β β β ε
(1)
where ‘i' indexes the student whilst 'j’ is school type. Tij is test score measure, our outcome of interest. Xi contains personal attributes including host of control for past scholastic achievement and type of primary school attended; Yi contains household characteristics of the respondent; Zij is school-specific attributes. The standard method to estimate equation (1) is a simple ordinary least- squares (OLS) regression. Basically all of the estimates of education production functions surveyed in Hanushek (1997) use this method. The empirical strategy set out below departs from this practice and accounts for all potential sources of bias listed above by Glewwe and Kremer. The only exception is bias relating to non-random pattern of school participation. Given that our sample is school-based, this is unavoidable3.
Most of the biases prevail owing to the nature of the school-survey based dataset that is conventionally used to estimate equation (1). Extant surveys mostly use stratified sampling technique and use as primary sampling unit administrative units that are too large to constitute a school- catchment area. Moreover, researchers seldom have data on multiple schools in a given school- catchment area so that school choice is modeled by using variations in characteristics of schools that in reality do not capture the actual selection of schools facing an index child in the sample.
Moreover, surveys sample kids from single classrooms even if a school operates with multiple classrooms per grade so that within school variation in inputs such as class-size is ignored. Even when kids belonging to a single classroom are interviewed, only a sub-sample is selected on a random basis so that there is limited variation in student characteristics. When the sample comprises of (i) all schools in a “catchment” area, (ii) multiple sections (classrooms) of a given grade and (iii) all kids in a section/classroom, the following educational production function could be estimated instead of equation (1):
' ' ' '
iusv = Hi 1 + Ss 2 + Rs 3 + Cs 4 + u + + s v + uiusv
T α α α α ε ε ε (2)
In equation (2), εu, andεs are union and school specific component of the error term respectively; ui is the idiosyncratic (student-specific) component of the error term. The following subscripts are applied throughout: i is for student, c is for class, s is for school and u is union of location. Tiusv is the test score of student i in class c (of grade 8) in school s; C is the class size, R is a dummy for religious school; H is a vector of controls for student- and family-background characteristics.
Equation (2) is estimated using test performance of grade 8 students. The vector S includes several
3 In the absence of data on school-age siblings of our sample children, this issue could not be addressed. Studies that have accounted for sample selection effects due to premature drop out (e.g. Glewwe and Jacoby, 1995) in addition to selection in a given school type, conditional on enrolment, report limited impact of sample selection effects on the results. However, it is difficult to generalize this result and rule out the prospect of a selection bias for Bangladesh on the basis of this finding.
school-specific controls such as land area, fraction of teachers being female, fraction of teachers being trained, mean educational attainment of teachers, log of total school expenditure and class size in grade 74. The vector H controls for family factors such as paternal and maternal education and household assets. We do not have direct measures of a child’s innate ability and motivation. These aspects are partially captured by vector H which includes controls for past achievement of the child and whether the student received pre-primary education in her childhood. Past achievement is proxied by the class rank of the student in grade 7 final examination (administered by the school in 2004). Other individual specific controls included in vector H are variables such as gender and type of the primary school attended by the student. Inclusion of proxies for pre-primary education, past school type and class rank in the regression yields a pseudo value-added specification of the production function to the extent these correlates proxy for past educational inputs.
Given the structure of the error term, one can control for various types of unobservable factors by adopting a fixed-effects regression framework instead of a simple OLS model. First, we note that secondary school availability in rural Bangladesh varies significantly between unions so that control for union-specific unobservables accounts for geographic differences in access to schools5. This partially rules out selection into a given school purely for availability-related reasons. Additionally, this also accounts for non-random placement and/or finance of school facilities by the government.
This is achieved by estimating equation (2) as (union) fixed-effects (UFE) regression and differencing out the term εu. Clearly, this approach is superior to that adopted by Beegle and Newhouse (2005) who account for selection into private school by using information on public school availability in the community. Control for UFE already a priori rules out selection in a given school type (e.g. public schools) purely for reasons related to its local availability.
The resulting estimates of school-specific parameters (e.g. religious school dummy, R) however are not necessarily causal even in a UFE framework. Two important sorting effects discussed in Glewwe and Kremer (2005) are: sorting taking place between schools, such as residential choice, and sorting taking place within schools, such as parents lobbying to place their children in a particular classroom or heads of schools assigning students to different classes. In a rural setting, one can arguably rule out the second scenario. However, the possibility of between school sorting remains strong. Parents may have a preference for a particular type of education (religious vs. secular) or they may care about some aspect of education quality that is correlated to a school’s religious orientation (e.g. smaller class size). Even if rural parents do not move houses to be close to good schools, they may succeed in influencing local school funding and quality. In such cases, a positive relationship between school resources and outcomes for children may be due to unobserved parental tastes for education, and it may not be possible to disentangle the effects of such tastes from those of school inputs.
The identification strategy used in this paper eliminates this between school sorting effects in two ways. The first strategy completely eliminates the effects of between-school sorting by controlling for school fixed effects (SFE). Any systematic between-school variation stemming from any source whatsoever is thereby removed when estimating the class-size effect and effect of past inputs6.
4 We prefer class size experienced in the previous year as it is less endogenous compared to current (grade 8) class size.
5 For instante, the supply of rural public secondary schools only vary between unions in Bangladesh; there is no rural union with more than one public secondary school.
6 A previous study by Asadullah (2005c) exploits a teacher allocation rule, similar to the Maimonides’ rule, where a public as well as an aided secondary school receive an additional teacher from the government if grade enrolment exceeds 60.
The study does not provide any evidence in support of reducing class size in the secondary schools6. Unfortunately, this
Obviously, this identification strategy requires that our dataset has information on more than one class from each school.
Even having controlled for school fixed effects, however, the estimates produced by equation (2) might still be biased by sorting taking place within schools wherever there is more than one class per grade in a school7. However we argue that this problem is less severe in our sample which comprises of rural schools only. Even when there are multiple classrooms, interviews with the head teachers reveal that schools assign kids to a given section randomly at the beginning of the secondary school when the child is first admitted to school and his/her ability is yet to be fully revealed to the school authority. Students rarely switch to a different classroom in a given grade later on the basis of her/his ability. The coefficient estimate α3 can thus be interpreted as a true estimate of the causal impact of class size on student performance which is unaffected by between-school sorting.
Additionally, to the extent students in the same class differ in terms of pre-secondary education, this strategy yields cleaner estimate of the effect of primary school type on secondary school achievement.
Given data on multiple students per classroom, one can further estimate a class-room fixed-effects model (CFE). Whilst this strategy does not permit an analysis of the effect of school/class-specific variables, it yields finer estimates of the impact of past school inputs experienced by students. These include the type of primary school attended by a student, pre-primary education in the childhood and class rank in grade 7 final examination. CFE estimates of these effects are superior (to SFE) in the sense that students grouped in the same class are more similar so that CFE yields better control for common unobservable factors.
However SFE and CFE approach does not permit estimation of individual school-specific variables such as religious school type. Therefore, alternatively, we combine fixed-effects approaches with instrumental variable technique and estimate UFE-IV models. The key challenge here is to find plausible instruments – variables correlated with the observed variables that are not orthogonal to the error term but uncorrelated with the error term.
Beegle and Newhouse (2005) follow a similar methodology using Indonesian household data.
Achievement regressions are estimated using OLS, fixed-effects (using within family data on siblings) and IV techniques. The IV model accounts for selection into private school by using information on public school availability in the community. However, Beegle and Newhouse do not address the issue of selection into religious schooling. We use data on (a) parental religiosity and (b) relative characteristics of secular schools in the catchment area to construct instrument for religious school attendance.
rule has been abolished in 2003 and hence does not any longer serve as a source of exogenous variation in class size in Bangladesh.
7 Wößmann and West (2002) explicitly account for this possibility and dispose of within-school sorting effects in an instrumental variables (IV) framework. Since their dataset contains kids from two adjacent grades and multiple section per grade, they instrument the actual class size by the average class size at the respective grade level of the school, after controlling for school-fixed effects.
4. Data
The data used in this paper was originally collected to assess school quality in rural Bangladesh that has benefited from a female stipend scheme. Jointly initiated by the World Bank and the Government of Bangladesh in 1993, the Female Secondary School Assistance Project (FSSAP) is one of the four stipend schemes and today covers over 5000 secondary educational institutes in a total of 118 Thanas and 1063 unions8. The primary sampling unit (PSU) of the survey was chosen to be unions. To account for regional variation in school participation rate and so on, PSUs were selected with proportional allocation from each division. At first, the whole country was stratified into six strata, so that a similar pattern of enrolment, achievement, performance, social and economic status of students prevailed in the same stratum, the criterion of stratification being the administrative division. Of the 1063 unions (N) in the FSSAP area, N1 = 102 unions are in Barisal division, N2 = 145 in Chittagong division, N3 =308 in Dhaka division, N4 = 171 in Khulna division, N5 = 270 in Rajshahi division and N6 = 67 in Sylhet division. Keeping in view the time, cost and administrative problems of managing large volumes of information and data, 60 unions with proportional allocation from 6 administrative divisions were selected as the sample. The overall sampling fraction thus stands at 5.6% (=60/1063).
The total number of sample unions in each division has been selected by using the following formula: ni = n.[Ni/N], where ni = number of unions to be selected in the i-th division; Ni = Number of total unions under FSSAP-II in the i-th division; N = number of total unions in Bangladesh under FSSAP-II program ( 6
i i=1
N= N∑ ); n = combined number of sample unions that we seek to select ( 6 ).
i i=1
n= ∑n
In the second step, for each sample union, a complete list of schools was prepared according to the Ministry of Education (MoE) database on secondary schools in our sample unions. Using this list, all secondary educational institutes in each of the sample union were selected for data collection.
In sum, a simple clustered sampling procedure was followed to select schools for the survey. From the list of FSSAP unions in each division, 6 unions from Barisal division, 8 from Chittagong, 17 from Dhaka, 10 from Khulna, 15 from Rajshahi and 4 from Sylhet division were drawn independently on a simple random sampling (SRS) basis. All recognized schools and madrasas in each selected union were surveyed. In total, 321 schools and madrasas could be identified in the 60 unions (or school catchment areas). The distribution of sample schools in various types is shown in Table 2.
8 A union is an administrative unit in rural Bangladesh. It is smaller than a thana and typically comprises of about 15 villages.
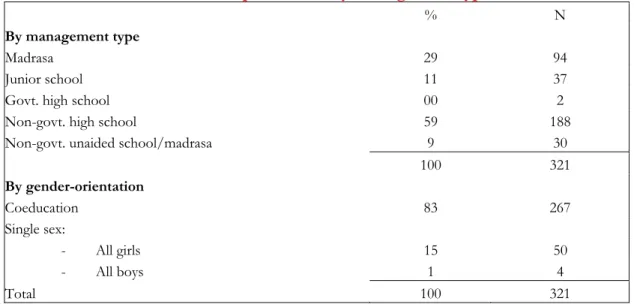
Table 2: Breakdown of the sample schools by management types and orientation
% N
By management type
Madrasa 29 94
Junior school 11 37
Govt. high school 00 2
Non-govt. high school 59 188
Non-govt. unaided school/madrasa 9 30
100 321
By gender-orientation
Coeducation 83 267
Single sex:
- All girls 15 50
- All boys 1 4
Total 100 321
The relative scarcity of government schools in our sample is unsurprising in that we focus on rural areas only. There are approximately 315 secondary government schools in Bangladesh most of which are located in urban centers. Another notable aspect of the sample is the relative scarcity of all-boys schools (1%) vis-à-vis all girls schools (15%). This is an outcome of the stipend program which today attracts more girls than boys to secondary schools in the rural area.
The survey was conducted in 2005. Two mathematics tests were administered on all students (both boys and girls) enrolled in grade 8 and present on the day of the survey irrespective of whether an individual student was on stipend or not. If there were two classrooms in grade 8, both were selected for the survey. However, if any of the schools had more than two classrooms, only two were randomly selected. Once again, all students present on the day of the survey were interviewed.
Given the cluster-based sampling, the survey led to a near-census of all secondary school going children (currently enrolled in grade 8 and present on the day of the survey) in the sample unions.
The dataset contains a total of 321 schools and 8475 students.
The first test was based on secondary-standard mathematics knowledge. The test instrument was constructed by using items previously used in the Trends in International Mathematics and Science Study (TIMSS), 1999. The TIMSS has been administered three times by the International Association for the Evaluation of Educational Achievement (IEA), the latest in 2003. The study has released several secondary-standard (grade 8) mathematics items indicating what each item measures and the results of every participating country. The TIMSS instrument assessed competency in data, measurement, number, algebra and geometry using 125 multiple-choice format mathematics items9. On the basis of pilot test experience and given the time constraint in the field, only 20 original items were retained in our test instrument. These included 9 questions on number and fractions, 3 on geometry, 6 on algebra, 1 on graph and one on measurement. The second test instrument is based
9 It also contained 37 free-response format questions which were not considered whilst designing our test instrument.
See Garden and Smith (2000) for details.
on primary school mathematics syllabus. This test assessed students using four very basic free- response format questions which were used by Greaney et al (1999) to assess competency in written mathematics among primary school graduates in Bangladesh in 1992.
For each school, the head teacher was interviewed to gather data on various aspects of the school and average background of teachers. If the head teacher was absent, the teacher-in-charge was interviewed. Additionally, school registers were accessed to collect data on student performance in school final examination in grade 7 in the previous year. This way, retrospectively, we collected data on 7-th grade final maths, English and total test scores for all sample students.
In addition to test scores, the survey collected data on a host of school and teacher characteristics.
Each student taking the test was asked to answer a number of questions relating to their family and parental background. Detailed data on personal characteristics and the history of pre-secondary schooling (such as types of primary and pre-primary school attended) were also collected. To be precise, simple family-related information on sample students was collected without any household visits. Lastly, in addition to detailed test score data on all schools in the sample, we collected additional data for a sub-sample of 34 schools (10% of the original sample): the primary-standard mathematics test was administered on all students enrolled in grade 6.
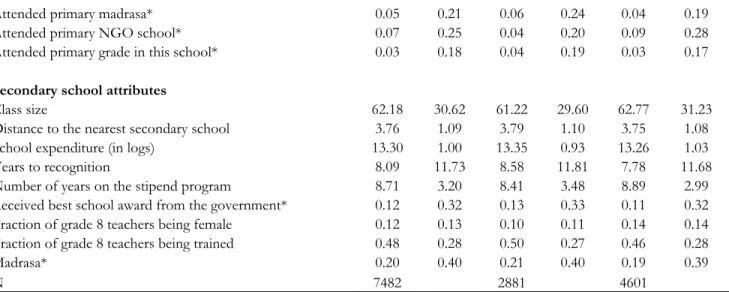
Table 3: Descriptive statistics
Variables Full sample Boys Girls
Mean Std. dev. Mean Std. dev. Mean Std. dev.
% of mathematics answer correct 0.38 0.20 0.38 0.19 0.37 0.21 Personal attributes
Age 13.23 0.95 13.34 1.07 13.16 0.85
Age, squared 175.83 29.77 178.97 37.99 173.86 22.98
Non Muslim* 0.12 0.33 0.12 0.33 0.12 0.33
Female* 0.61 0.49 0.00 0.00 1.00 0.00
Female*(Girl currently on stipend) 0.49 0.50 0.00 0.00 0.80 0.40 Family background
Travel time to school from home (in minutes) 22.49 18.70 21.45 16.85 23.14 19.74
Father un-educated* 0.16 0.37 0.15 0.36 0.17 0.37
Father primary educated* 0.33 0.47 0.33 0.47 0.33 0.47
Father secondary educated* 0.20 0.40 0.19 0.39 0.20 0.40
Father post-secondary educated* 0.23 0.42 0.25 0.43 0.22 0.42
Mother un-educated* 0.24 0.43 0.22 0.41 0.25 0.43
Mother primary educated* 0.39 0.49 0.40 0.49 0.38 0.49
Mother secondary educated* 0.18 0.39 0.17 0.38 0.19 0.39
Mother post-secondary educated* 0.10 0.30 0.10 0.30 0.09 0.29
House is pucca* 0.13 0.34 0.14 0.34 0.13 0.34
House is semi-pucca* 0.16 0.36 0.15 0.36 0.16 0.36
House is kucca* 0.41 0.49 0.41 0.49 0.41 0.49
House is tin-made* 0.30 0.46 0.30 0.46 0.30 0.46
Frequency with which father prays to God 1.76 1.83 1.81 1.88 1.73 1.80 Schooling history
Attended pre-primary (maktab) school in the childhood* 0.62 0.49 0.56 0.50 0.65 0.48 Class rank in grade 7 22.20 21.71 20.52 20.53 23.26 22.35 Attended primary private school* 0.19 0.39 0.19 0.40 0.18 0.39
Attended primary madrasa* 0.05 0.21 0.06 0.24 0.04 0.19 Attended primary NGO school* 0.07 0.25 0.04 0.20 0.09 0.28 Attended primary grade in this school* 0.03 0.18 0.04 0.19 0.03 0.17 Secondary school attributes
Class size 62.18 30.62 61.22 29.60 62.77 31.23
Distance to the nearest secondary school 3.76 1.09 3.79 1.10 3.75 1.08 School expenditure (in logs) 13.30 1.00 13.35 0.93 13.26 1.03
Years to recognition 8.09 11.73 8.58 11.81 7.78 11.68
Number of years on the stipend program 8.71 3.20 8.41 3.48 8.89 2.99 Received best school award from the government* 0.12 0.32 0.13 0.33 0.11 0.32 Fraction of grade 8 teachers being female 0.12 0.13 0.10 0.11 0.14 0.14 Fraction of grade 8 teachers being trained 0.48 0.28 0.50 0.27 0.46 0.28
Madrasa* 0.20 0.40 0.21 0.40 0.19 0.39
N 7482 2881 4601
Note: * indicates a dummy (1/0) variable. Omitted class for parental education variable is “never went to school”. Base category for house type and primary school type is “kacha” and “government primary school” respectively.
Table 3 summarizes key variables of interest10. On average, students could correctly answer only 38% of secondary-standard maths questions. Raw data does not reveal statistically significant gap in test score by gender. Some interesting gender patterns are observed in the data. For instance, compared to boys, girls are more likely to have received pre-primary (maktab) education and more likely to have attended an NGO school for primary education. 80% of the girls in our sample currently receive stipend. Girls have a significantly higher travel time to school compare to their boy peers and more likely to be in a school/madrasa with more female teachers. Further differences are observed in the raw data if we split the sample observations by school type (see Appendix Table 1).
We are interested to see whether these differences translate into boy-girl differences in test score in addition to exploring how test score varies between secular and religious (madrasa) schools. This is explored in section 6 which reports results from multivariate regression models. The next section first describes school quality using data on performance of the sample students in rudimentary primary-level mathematics test.
5. Student performance in primary-standard mathematics test
As mentioned earlier, all students of grade 8 in our sample were given a test based on four simple questions which assessed basic numeracy skills requiring the knowledge of primary level mathematics. These questions were previously used by Greaney et al (1999) to assess basic competency in mathematics in rural Bangladesh. Depending on the question, failure rate ranges from 14% to 40% among girls whilst the range is much narrower for boys i.e. 10%-28%. The mean total score (correct answers) stands at 77% only (3.10 out of 4). It should be noted that Greaney et al. defined competency in rudimentary level mathematics in terms of ability to correctly answer at least 3 of the questions in each set. Therefore, we additionally calculated the fraction of students who were able to answer at least 3 questions correctly. This yields figures which are readily comparable to those reported in Greaney et al. (1999). It is found that only 75% of the sample students could attain basic competency in written mathematics despite the fact that the test instrument used to assess competency was based on primary-school mathematics curriculum. This
10 13% of the actual sample observations were discarded due to missing data problem leading to a working simple of 7482 students.
figure is consistent with the competency level amongst grade 7 and 8 completers reported by Greaney et al., i.e. 60% and 80% respectively (Greaney op. cit., p. 19). This figure is however higher for boys (83%) compared to girls (70%). On the basis of these figures, one could conclude that the level of competency has not improved in rural secondary schools in the country: even after a decade, a quarter of the secondary school students fail to demonstrate basic competence in mathematics.
Not only school quality remains low, it has changed little over the last 13 years.
The low level of competence among grade 8 students could simply reflect the poor quality of students entering rural secondary schools. If so, this then raises the question of value addition by secondary schools in the country. How do grade 6 students perform in primary-standard maths test?
Do students in higher grades gain in competence? To look at these questions, we compare performance of grade 6 and 8 students for the 34 schools for which we have the necessary data.
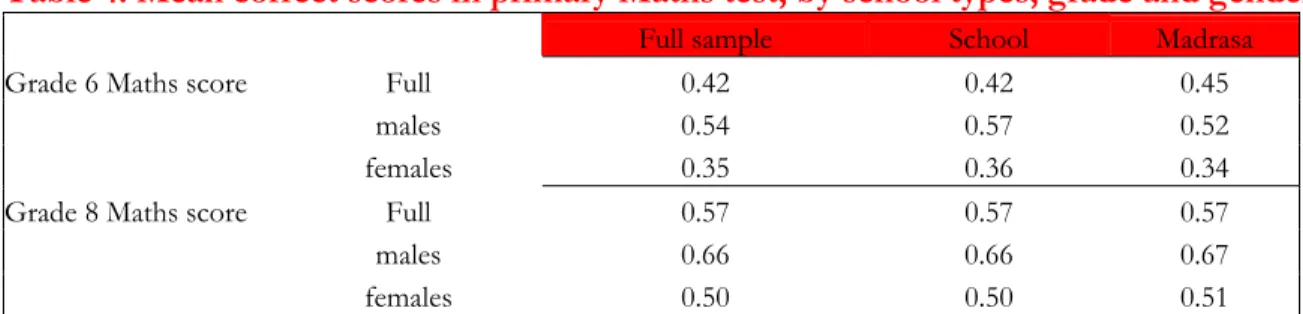
Table 4 summarises mean aggregate score of grade 6 and 8 students.
Two patterns emerge from Table 4. First, mean percentage of correct answers among grade 6 students remains abysmally low. On average, only 42% of the test questions could be answered correctly by a student. When grade 8 students of same school were asked to answer the same questions, the mean score went up but only moderately (by 15 percentage points). It seems that whilst quality of secondary education remains low (in terms of insufficient value addition), much of it might have to do with poor quality of education received in rural primary schools in Bangladesh.
The differences in test scores between madrasa and school are never significant. However, there are significant differences by gender. Boys still have higher scores than girls, both in grades 6 and 8. To be precise, gender gap in test score exists at the beginning of secondary education and prevails through grade 8.
Table 4: Mean correct scores in primary Maths test, by school types, grade and gender
Full sample School Madrasa
Grade 6 Maths score Full 0.42 0.42 0.45
males 0.54 0.57 0.52
females 0.35 0.36 0.34
Grade 8 Maths score Full 0.57 0.57 0.57
males 0.66 0.66 0.67
females 0.50 0.50 0.51
Note: Figures show the fraction of answers being correct.
The evidence on the poor state of mathematics skills among primary completers in rural Bangladesh is not new. Nath et al. (1996) tested a large sample of rural children aged 11-12 years in a total of 13 maths questions. Only 28.7 per cent of the children could answer all the question items correctly, and on average the interviewed children answered only nine items correctly.
In sum, when judged in terms of competence in rudimentary mathematics of primary school standard, quality of students entering secondary schools remains very low in the FSSAP area. While completion of secondary grades reduces some of the initial disadvantage, a quarter of students currently in grade 8 continue to lack basic competency. More importantly, significant gender gap in competency exists at the entry level and persists throughout the secondary cycle. The poor state of
basic education casts doubt about the ability of the students to compete and excel in tests of international standard. In the next section, we attempt to examine education quality in the FSSAP area using data on student performance in secondary-standard mathematics.
6. Determinants of secondary school achievement: Regression results
This section discusses the determinants of student performance in secondary-standard mathematics test. We start with a relatively naïve regression specification which controls for union-specific fixed effects in addition to the usual student, household and school specific covariates of test score. This specification allows us to study determinants of test score by restricting school choice net of differences in the characteristics of school catchment area (i.e. union): we difference out any between-union variation in school availability. The majority of children (89%) attend school that is located in the same union where they reside. Therefore, control for union-specific fixed effects partly addresses concern over the endogeneity of attending a particular school to the extent selection in a given school type is driven by it’s availability in one’s union of residence.
Results are reported in Table 5. The coefficient on Madrasa dummy is negative and significant indicating that students in madrasas are disadvantaged compared to their peers in schools in a given union. There are several additional findings. First, girls score significantly less compared to boys but amongst girls those that are on stipend performs significantly better. Second, students who received pre-primary education (maktab) during their childhood have significantly high test scores. Third, graduates of primary madrasas significantly under-perform compared to public primary schools.
Fourth, students who rank low amongst their peers in the pervious grade (i.e. seventh) also perform poorly in our maths test11. Turning to school specific effects, schools with a larger fraction of female teachers boost test score significantly. Students in schools that have received “best school award”
from the FSSAP authority in a given thana also perform significantly well12. Lastly, schools with higher expenditure perform significantly better (although the effect is modest).
Union fixed-effects IV estimates
Results presented in column (1) whilst intriguing are difficult to interpret as causal. A majority (65%) of the sample unions have at least one school and a madrasa so that the question of choice between secular and religious education is relevant for our data. Hence, we re-estimate the UFE model treating the decision to attend a religious school as endogenous. Results are reported in the second column in Table 5.
11 We also recalculated class rank of the student in the seventh grade school final examination using performance in the mathematics paper only. However, our conclusión remained unchanged.
12 All recognised schools and madrasas with female students in a given thana are eligible for the award.
Table 5: Determinants of student achievement [Dependent variable: % of correct answers in the mathematics test]
(1) (2) Union FE Union FE-IV Student attributes
Age 0.012 0.012
(1.65)+ (2.53)*
Age squared -0.000 -0.000
(2.14)* (5.17)**
Non Muslim -0.004 -0.001
(0.54) (0.23)
Female -0.038 -0.038
(5.58)** (5.94)**
Female*(Girl currently on stipend) 0.029 0.029
(4.39)** (4.59)**
Family background
Father primary educated -0.003 -0.003
(0.51) (0.60)
Father secondary educated 0.001 0.001
(0.19) (0.13)
Father higher educated -0.000 -0.001
(0.03) (0.16)
Mother primary educated 0.005 0.006
(1.19) (1.23)
Mother secondary educated 0.001 0.001
(0.12) (0.18)
Mother higher educated 0.013 0.013
(1.64) (1.70)+
Household has a fan 0.004 0.004
(0.76) (0.75)
Household has a tv 0.003 0.004
(0.69) (0.82)
Household has a radio 0.003 0.003
(0.87) (0.86)
House being pucca 0.004 0.004
(0.65) (0.68)
House being semi-pucca 0.005 0.005
(0.89) (0.91)
Travel time to school from home -0.000 -0.000
(0.66) (0.84)
Schooling history
Had pre-primary (maktab) education in childhood 0.018 0.017
(3.89)** (3.80)**
Class rank in grade 7 -0.001 -0.001
(9.25)** (9.74)**
Attended primary private school -0.008 -0.008
(1.54) (1.57)
Attended primary madrasa -0.029 -0.038
(2.91)** (3.37)**
Attended primary NGO school 0.008 0.008
(0.98) (0.90)
Attended primary grade in this school -0.002 -0.011
(0.20) (0.96) Secondary school attributes
Class size 0.000 0.000
(2.39)* (3.55)**
School’s distance to the nearest secondary school -0.004 -0.003
(1.53) (1.31)
School expenditure (in logs) 0.005 0.004
(1.76)+ (1.37)
Years to recognition -0.001 -0.001
(3.01)** (3.28)**
Years school is on stipend program 0.004 0.005
(4.83)** (5.13)**
School received “best performance award” 0.018 0.016
(2.48)* (2.28)*
Fraction of teachers being female 0.162 0.174
(8.17)** (8.43)**
Fraction of teachers being trained -0.001 0.013
(0.06) (1.11)
Madrasa -0.016 0.009
(1.96)* (0.84)
Single-sex school -0.008 -0.007
(1.17) (0.94)
N 7482 7482
Adjusted R2 0.06 -- Number of FEs 59 59 Partial R2 of excluded instruments -- 0.49 F test of excluded instruments (p-value) -- 0 Sargan over-identification test -- 0.64
Note: Absolute value of t statistics in parentheses. + significant at 10%; * significant at 5%; ** significant at 1%.
Excluded instruments are “# of times father pray daily” and “mean class-size of other schools in the union”. Each regression additionally contains a set of 5 dummies indicating which day of the week the test was taken. Regression constant has been suppressed.
While the purpose of this paper is to evaluate the relative performance of secular and religious schools, the determinants of sector selection are interesting in their own right. Results of the first stage regressions are reported in Appendix Table 2. The signs on the coefficients in the sector- selection equations are consistent with our priors. Father’s religiosity, measured by the frequency of prayers, positively predicts selection into a religious school. On the other hand, larger class size by other secular schools in the union increases the probability of enrolment in a religious school. The later result is also shared by Figlio and Stone (2000) who use characteristics of local public schools to model selection into private schools in the US. They find that parents are more likely to send their children to public schools if the private sector student-teacher ratio in the county is higher.
The first stage results show that our instruments are strong. The excluded instruments, parental religiosity and characteristics of the local secular school, are individually significant. They also pass the over-identification test at the conventional level. The Sargan overidentification test cannot be rejected at the 5% level in any model. That is, the instruments pass the exogeneity test. We also experimented with alternative tests of overidentification, namely the Anderson-Rubin overidentification test. Once again, this cannot be rejected at the 5% level in any model. That is, the instruments pass the exogeneity test.


![Table 5: Determinants of student achievement [Dependent variable: % of correct answers in the mathematics test]](https://thumb-eu.123doks.com/thumbv2/1library_info/4181103.1556882/20.918.101.700.133.1078/determinants-student-achievement-dependent-variable-correct-answers-mathematics.webp)

