The impact of myeloperoxidase on LCMV-induced immunopathology
Inaugural-Dissertation zur
Erlangung des Doktorgrades
der Mathematisch-Naturwissenschaftlichen Fakultät der Universität zu Köln
vorgelegt von
Michelle Arlette Paillard aus Neuwied
Köln 2019
Berichterstatter: PD Dr. Thomas Wunderlich Prof. Dr. Peter Kloppenburg
Tag der mündlichen Prüfung: 29.11.2019
Table of contents
Abbreviations
1Introduction ... 1
1.1 Myeloperoxidase ... 1
1.2 Neutrophils ... 2
1.3 Neutrophils and MPO in anti-viral immunity ... 3
1.4 Lymphocytic Choriomeningitis Virus (LCMV) ... 4
1.4.1 The LCMV-specific immune response ... 5
1.5 Aim of this work ... 6
2Materials and Methods ... 7
2.1 Materials ... 7
2.1.1 Mice ... 7
2.1.2 Virus ... 7
2.1.3 Cell lines ... 8
2.1.4 Cell culture media, chemicals, buffers and solutions ... 8
2.1.5 Antibodies ... 12
2.1.6 Kits ... 14
2.1.7 Technical equipment ... 15
2.1.8 Consumables... 16
2.1.9 Software ... 16
2.2 Methods ... 17
2.2.1 Cell culture... 17
2.2.2 Induction of immunopathological syndromes ... 17
2.2.2.1 Infection of mice with LCMV ... 17
2.2.2.2 LCMV-induced choriomeningitis ... 17
2.2.2.3 Delayed-type hypersensitivity (DTH) reaction ... 18
2.2.2.4 LCMV-induced hepatitis ... 18
2.2.3 Virus titration... 18
2.2.4 Preparation of single cell suspensions ... 19
2.2.4.1 Single cell suspension from the spleen ... 19
2.2.4.2 Single cell suspension from the liver ... 20
2.2.5 Immunomagnetic enrichment of CD8+ T cells from the ... spleen or the liver ... 20
2.2.6 Immunomagnetic enrichment of neutrophils from the bone marrow ... 21
2.2.7 Assay for virus-specific cytotoxicity of CD8+ T cells ... 21
2.2.8 Stimulation of LCMV-specific CD8+ T cells ... 22
2.2.8.1 Preparation of target cells for CD8+ T cell stimulation ... 23
2.2.8.2 Antigen-specific stimulation of CD8+ T cells ... 23
2.2.9 Flow cytometry ... 23
2.2.9.1 Staining of surface molecules ... 23
2.2.9.2 Staining of intracellular molecules ... 24
2.2.9.3 MPO cytotoxicity assay with murine primary hepatocytes ... 24
2.2.9.4 SYTOX Green NETosis assay ... 25
2.2.9.5 Cell cycle analysis of hepatocytes using propidium iodide ... 25
2.2.10Western Blot analysis of cleaved caspase 3 ... 26
2.2.10.1 Homogenization of liver tissue ... 26
2.2.10.2 SDS-PAGE and Western Blot ... 26
2.2.11 Quantification of MPO in the plasma and liver tissue homogenates ... 27
2.2.12 Quantitative real-time PCR ... 27
2.2.12.1 RNA isolation and cDNA synthesis ... 27
2.2.12.2 Quantitative real-time PCR (qRT-PCR) ... 28
2.2.12.3 Primers ... 29
2.2.13 Immunofluorescence microscopy ... 30
2.2.13.1 TUNEL staining ... 30
2.2.13.2 MPO and Hoechst staining ... 30
2.2.14 In vivo neutrophil depletion ... 31
2.2.15 In vivo MPO inhibition ... 31
2.2.16 Statistical analysis ... 31
3Results ... 32
3.1 Effects of MPO-deficiency on LCMV-specific ... immunopathological responses ... 32
3.1.1 Influence of MPO on LCMV-induced choriomeningitis ... 32
3.1.2 Influence of MPO on LCMV-induced DTH reaction ... 33
3.1.3 Course of hepatitis during acute infection of mice with LCMV ... 34
3.2 The impact of MPO on the CD8+ T cell response during ... acute LCMV-induced hepatitis ... 39
3.2.1 Influence of MPO on T cell expansion in the spleen ... 39
3.2.2 The impact of MPO on the effector functions of T cells in the spleen ... 41
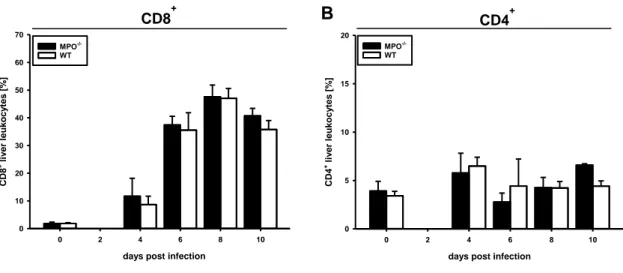
3.2.3 Influence of MPO on T cell infiltration in the liver during ... acute LCMV-induced hepatitis ... 43
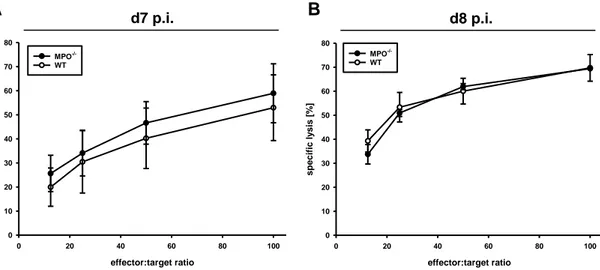
3.2.4 The impact of MPO on the cytotoxic activity of ... liver-infiltrating CD8+ T cells ... 45
3.3 Myeloid cells and LCMV-induced acute hepatitis ... 48
3.3.1 Myeloid cells in the liver during LCMV-induced acute hepatitis ... 48
3.3.2 Cell type-specific expression of MPO ... 50
3.3.3 Neutrophil recruitment to the liver over the course of LCMV infection ... 52
3.3.4 LCMV-induced hepatitis in mice depleted of neutrophils ... 54
3.4 The impact of MPO on neutrophil defense mechanisms in response ... to LCMV infection ... 56
3.4.1 The impact of intracellular MPO activity on ... LCMV-induced immunopathology ... 57
3.4.2 Neutrophil extracellular trap formation by MPO-/- neutrophils ... 58
3.5 Cytotoxic effects of MPO in the liver ... 60
3.5.1 Cytotoxicity of MPO against hepatocytes ... 61
3.5.2 Co-localization of apoptotic hepatocytes with MPO in vivo ... 63
3.5.3 In vivo inhibition of extracellular MPO ... 64
3.6 Mechanisms of MPO-induced hepatocyte death ... 68
3.6.1 The role of MPO on the transcriptional regulation of NADPH oxidase 4 ... 68
3.6.2 Cell cycle progression of hepatocytes over the course of ... acute LCMV infection ... 69
4Discussion ... 72
5References ... 82
6Summary ... 98
6Zusammenfassung ... 99
7Erklärung ... 101
Danksagung ... 102
Abbreviations
ALT alanin aminotransferase (GPT) APC allophycocyanin
AST aspartat aminotransferase (GOT)
51Cr chromium-51
CD cluster of differentiation CNS central nervous system cpm counts per minute CTL cytotoxic T lymphocyte DC dendritic cell
DMEM Dulbecco´s minimal essential medium DMSO Dimethyl sulfoxide
DNA Deoxyribonucleic acid
DTH delayed-type hypersensitivity reaction E:T effector : target
ELISA enzyme linked immunosorbent assay FACS fluorescence activated cell sorting FasL Fas Ligand
FCS fetal calf serum Fig. Figure
FITC fluorescein isothiocyanate
GP glycoprotein
Gzm granzyme
H&E Hematoxylin and eosin HOCl hypochlorous acid IgG Immunoglobulin G IFNγ Interferon-gamma IU infectious units i.c. intracranial i.p. intraperitoneal i.v. intravenous KC Kupffer cell
LCMV Lymphocytic choriomeningitis virus mAb monoclonal antibody
MHC Major Histocompatibility Complex MIU mouse infectious unit
MOI multiplicity of infection MPO Myeloperoxidase
MPO-/- Myeloperoxidase-deficient MEF mouse embryonic fibroblasts NETs neutrophil extracellular traps NOX NADPH oxidase
NP nucleoprotein
n. s. not significant pAb polyclonal antibody
PBS phosphate buffered saline PE phycoerythrin
PFA paraformaldehyde PFU plaque forming unit
pH pH value; negative decadic logarithm of the H+ concentration P/S Penicillin/Streptomycin
p.i. post infection
ROS reactive oxygen species
RPMI Roswell Park Memorial Institute SEM standard error of mean
SV Simian virus s.c. subcutaneous TCR T cell receptor
TGFβ Transforming growth factor beta TNF tumor necrosis factor
U/L units per liter WB western blot wt wild type
1
1 Introduction
1.1 Myeloperoxidase
Myeloperoxidase (MPO, EC 1.11.2.2) is a ~150 kDa, cationic, heme-containing enzyme, first described in 1941 by Agner et al. [1, 2] (reviewed in [3]). Expression of MPO in humans is restricted to phagocytes, where it is stored particularly in primary granules of neutrophils and to a lesser extent in granules of monocytes and tissue macrophage subsets (reviewed in [4]). In rodents, MPO is assumed to be exclusively expressed in neutrophils [5].
MPO catalyzes the generation of highly microbicidal oxidants (reviewed in [6, 7]).
This process is dependent on the presence of hydrogen peroxide (H2O2). For the generation of hydrogen peroxide, superoxide anions (O2-.
) are reduced in an either spontaneous or enzymatically-mediated dismutation reaction. Throughout the body, there are various sources providing reactive oxygen species (ROS). In phagocytes, ROS are predominantly produced by NADPH oxidase 2 (NOX2). In addition to this, other members of the NOX family and the mitochondrial respiratory chain may provide ROS for the MPO-H2O2 system (reviewed in [8, 9]) [10]. MPO oxidizes halides, predominantly chloride, but also bromide and pseudohalides. Thereby, it generates extremely reactive hypohalous acids (reviewed in [11]).
For a long time, the major function of MPO was considered to be the generation of reactive oxidants for the inactivation of internalized pathogens. Following phagocytosis, MPO is released from primary granules into the phagosome, where it mainly generates hypochlorous acid (HOCl) (reviewed in [12]) [13]. Intraphagosomal inactivation of pathogens by MPO is predominantly dependent on ROS generated by the NOX2 complex, which assembles in the phagosomal membrane upon pathogen uptake (reviewed in [14]). However, the function of MPO is more complex than killing ingested pathogens by generation of ROS. Beyond that, MPO can be released to the extracellular environment (reviewed in [15]) [16, 17]. Secretion can occur either directly from primary granules or by formation of neutrophil extracellular traps (NETs) [18]. In the extracellular environment, hypochlorous acid can attack any chemical group of proteins, nucleic acids, carbohydrates and lipids that can be oxidized and thereby disturb the integrity of microorganisms, but also of host tissues (reviewed in [4, 19]) [20-25]. MPO-derived oxidants critically impact cellular homeostasis and the
2 initiation and progression of various diseases. MPO was reported to promote various sterile inflammatory processes, e.g. cardiovascular and neurodegenerative diseases, as well as liver fibrosis in steatosis (reviewed in [3, 7, 26]) [27-30]. In vitro studies showed that hypochlorous acid increases cell permeability by chlorination of lipids and induces direct cell lysis or apoptotic and necrotic pathways in various cell types e.g. epithelial cells, fibroblasts and hepatocytes [31-34].
1.2 Neutrophils
MPO is the most abundant granule protein in neutrophils (reviewed in [7]). In human neutrophils its mass was reported to be higher than 5 % of the dry weight of cells [35, 36]. MPO levels in murine neutrophils only reach about 10 % of that of human neutrophils (reviewed in [7]). Additionally, neutrophils comprise the largest number of leukocytes in the human circulation (~ 70-80 %), while in mice only 20-30
% of white blood cells are neutrophils [35, 36].
Beyond MPO, neutrophils carry a variety of antimicrobial molecules within intracellular granules e.g. neutrophil elastase, lysozyme and α-defensin [37-39].
Together, these molecules are involved in different defense mechanisms of neutrophils in various infections, predominantly by bacteria and fungi (reviewed in [40, 41]). Neutrophils are professional phagocytes and combat pathogens in the circulation and in tissues either by phagocytosis or by release of granule contents to the extracellular environment (Fig. 1). Effective inactivation of pathogens is dependent on synergistic action of an array of antimicrobial molecules. During phagocytosis, release of contents from primary granules to phagosomal compartments potently inactivates pathogens (Fig. 1A) (reviewed in [41]).
By degranulation and NETosis, neutrophils release antimicrobial molecules, including MPO to the extracellular environment (Fig. 1B, C) (reviewed in [15, 38, 42, 43]) [44, 45]. NETs are web-like chromatin structures mainly composed of DNA. These structures contain proteins from neutrophil granules and the cytosol (reviewed in [46]). Bacteria, fungi and some viruses are trapped and disarmed or killed by exposure to antimicrobial molecules [18, 47, 48].
1 Introduction
3 Fig. 1 Major mechanisms of pathogen inactivation by neutrophils [41].
Neutrophils can inactivate pathogens by three major mechanisms: (A) Following phagocytosis, microorganisms are rendered harmless by ROS or antimicrobial granule proteins. Inactivation of extracellular pathogens is achieved by (B) degranulation and (C) NETosis via release of granule proteins.
1.3 Neutrophils and MPO in anti-viral immunity
As part of the innate immune system, neutrophils belong to the host´s first line of defense against invading pathogens. The role of neutrophils in the clearance of bacterial and fungal infections is well characterized. However, their contribution to antiviral immunity is less clear (reviewed in [49]).
Indeed, the few studies about the role of neutrophils and MPO during viral infections are rather controversial. On the one hand, in mouse models for influenza A virus (IAV) infection, neutrophils had a protective role for the host (reviewed in [50]) [51].
Furthermore, neutrophil-derived NETs were reported to capture and immobilize human immunodeficiency virus (HIV)-1 virions and this mechanism was dependent on MPO and α-defensin [48]. On the other hand, massive infiltration of neutrophils in infected tissues can result in acute inflammation and damage of non-infected bystander cells [52]. In patients with hepatitis B virus (HBV) or hepatitis C virus (HCV) infection, MPO plasma levels and infiltration of neutrophils were shown to correlate with liver damage [53, 54].
A B C
4 Thus, depending on the virus, neutrophils and MPO have the potential to ease or aggravate the course of an infection. Because of that, it is indispensable that the antiviral response of neutrophils is tightly regulated to hold the balance between immunoprotection and immunopathology.
1.4 Lymphocytic Choriomeningitis Virus (LCMV)
To study the role of neutrophils and MPO during an antiviral immune response, we used the model of acute infection of mice with LCMV, strain WE. LCMV belongs to the genus of Arenaviruses and was first isolated by Charles Armstrong in 1933 [55].
LCMV is a rodent-borne pathogen with the common house mouse, Mus musculus, as primary host. However, exposure to excretions or secretions from persistently infected rodents is contagious for humans. Infection of pregnant women can be transmitted vertically to the fetus and may result in fetal death or the development of severe birth defects [56-58]. In adults, if at all, symptoms of LCMV infection occur approximately 8 days after infection and are similar to those of influenza e.g. fever, headache, muscle aches and nausea [59]. Invasion of the CNS is very rare and mortality in this case is less than 1 % [60].
Since its discovery, LCMV has been used to study virological and immunological questions [61-63]. By means of LCMV as model pathogen important immunological mechanisms i.e. MHC restriction, T cell memory, persistent infections, T cell exhaustion and immunopathology have been unraveled (reviewed in [64]) [65-78].
LCMV infects cells by attatching to cell surfaces via binding of glycoprotein GP-1 to α-Dystroglycan (α-DG) on the cell [79]. The latter has a broad tropism and is expressed in various tissues of e.g. the liver, kidney and small intestine [80].
LCMV is a non-cytopathic virus. Meaning, the infected cell is not visibly affected during viral replication or shedding (reviewed in [81]) [82, 83]. Instead, the virus induces a vigorous immune response, mediated by cytotoxic T lymphocytes (CTLs), which lyse infected cells in a major histocompatibility complex (MHC) class I- restricted manner.
5 1.4.1 The LCMV-specific immune response
Immunopathology during acute hepatitis is mediated consecutively by NK cells, CD8+ T cells and CD4+ T cells (reviewed in [84]) [85]. However, the most severe destruction is mediated by CD8+ T cells, since cytotoxic T lymphocytes (CTLs) play the key role in virus elimination after acute infection of mice with LCMV [86]. Upon acute systemic infection, LCMV epitope-specific CD8+ T cells become fully activated cytotoxic T lymphocytes (CTLs), they massively expand (about 16.000-fold) and eliminate the virus within approximately 10-14 days [87, 88].
CTLs with an LCMV-specific T cell receptor (TCRLCMV) recognize viral peptides loaded on major histocompatibility complex (MHC) class I on the surface of infected host cells. After antigen encounter, CTLs mediate cytotoxicity by several effector pathways (reviewed in [89]). Upon TCR-mediated signaling, the CTL releases its effector molecules i.e. perforin and serine proteases, namely granzymes by degranulation towards the infected target cell (reviewed in [90]). Perforin-deficient mice were reported to have defective ability to clear LCMV infection [91]. When perforin is released into the immunological synapse, the intercellular space between the CTL and the target cell, it contributes to pore formation in the target cell membrane (reviewed in [92]). Granzymes can now enter the pore and induce apoptosis of the target cell mainly by induction of the caspase cascade.
Beyond target cell killing in a perforin-dependent manner apoptosis can be induced by receptor-mediated pathways. Engagement of FAS receptor (CD95) on a target cell with FAS ligand (CD95L) expressed by a CTL results in apoptotic death of the target cell by activation of caspase pathways [93]. These two strategies are responsible for most of contact-dependent target cell killing.
CTLs also secrete pro-inflammatory cytokines, such as tumor-necrosis factor alpha (TNFα) and interferon gamma (IFNγ) that can be cytolytic to the target cell. Upon infections with intracellular pathogens, IFNγ induces the upregulation of MHC class I molecules on the surface of target cells, which increases the chance for cytolysis by CTLs (reviewed [94]). Via TNF receptor engagement, TNFα can induce signaling pathways that lead to caspase activation and subsequent apoptosis of the infected cell (reviewed in [95]) [96].
6 During choriomeningitis upon intracerebral infection of the mouse central nervous system (CNS) with the Lymphocytic choriomeningitis virus (LCMV), neutrophils were reported to be recruited by T cells and to cause vascular leakage and acute lethality [97]. Depending on the route of virus inoculation, LCMV can induce further immunopathological syndromes. Subcutaneous (s.c.), intraplantar inoculation of LCMV into the footpad induces a delayed-type hypersensitivity (DTH) reaction and intraperitoneal (i.p.) injection leads to acute hepatitis [98-100]. Little is known about the impact of neutrophils on the induction of these immunopathological syndromes during infection of mice with LCMV and the contribution of MPO in these models is so far unresolved.
1.5 Aim of this work
The function of MPO during viral infections is double-edged, since MPO may contribute to virus clearance, but also to host tissue damage. So far, the role of MPO during LCMV-induced immunopathology remained completely unknown.
The aim of this study is to elucidate how MPO influences the course of disease during acute infection of mice with LCMV.
7
2 Materials and Methods
2.1 Materials 2.1.1 Mice
Breeding pairs of MPO-deficient (MPO-/-) mice [101] of the C57BL/6 strain were kindly provided by Stefan Baldus (Department of Internal Medicine and Cardiology, University Clinics Cologne). The mice were heterozygously mated to generate wt littermates as controls.
Mice of the C57BL/6 strain in which the promoter region and first two exons of the NOX2 gene (NOX2fl/fl) are flanked by loxP sites [102] were kindly provided by Ralf Brandes (Vascular Research Center, University Frankfurt).
To obtain mice with cell type-specific deletion of NOX2 in myeloid cells NOX2flox/flox mice were mated with transgenic mice expressing the Cre recombinase under control of the M lysozyme (LysM)-promotor (LysM Crepos [103]), which were donated by Jens Brüning (CECAD, MPI for Metabolism Research, University of Cologne, Germany).
All strains of mice were back-crossed at least 10 times to the C57BL/6J background.
Genotyping was performed by PCR analysis of tail- or ear-biopsies as published for the above listed mouse strains. The mice were bred and maintained under specific pathogen-free (SPF) conditions in the Center for Molecular Medicine Cologne (CMMC) and were used at an age of 8 to 12 weeks. Experiments were performed in accordance with the Animal Protection Law of Germany in compliance with the Ethics Committee at the University of Cologne.
2.1.2 Virus
The Lymphocytic Choriomeningitis Virus (LCMV), strain WE, was propagated and titrated as plaque forming units (PFU) on murine L929 cells, clone L13 as described previously [104].
8 2.1.3 Cell lines
Simian virus 40 [105] transformed mouse embryonic fibroblasts (MEF) derived from C57BL/6 mice (C57/SV) were used as target cells or controls. C57/SV and L929 cells, clone L13 were propagated in Dulbecco´s minimal essential medium (DMEM) supplemented with 5% heat-inactivated fetal calf serum (FCS) at 37 °C and 5% CO2.
2.1.4 Cell culture media, chemicals, buffers and solutions
All cell culture media, chemicals, buffers and solutions were of research grade and purchased from Biochrom AG, MERCK, ROTH or Sigma-Aldrich, if not specified otherwise. All buffers and solutions were prepared using deionised or bidestilled water (ddH2O) from an EASYpure® UV/UF water purification unit (Werner Reinstwassersysteme), sterilized by autoclaving or sterile-filtered with a 0.2 μm filter, if necessary and stored at room temperature (RT) unless specified otherwise.
Denotation Composition/Manufacturer
4-Aminobenzoic acid hydrazide (4-ABAH) 14 mg/mL in DMSO, stored at -20 °C, Cayman Chemicals
Acrylamide 4K-Solution (40%) Mix stored at 4 °C, AppliChem Amersham ELC Detection reagents stored at 4 °C, GE Healthcare
Benzonase stored at 4 °C, Novagen
Blocking solution (BSA) PBS with 3 % BSA and 0.1 % Triton- X-100, stored at 4 °C
Blocking solution (milk) TBS-T with 5 % powdered milk, stored at 4 °C
ß-mercaptoethanol (ß-ME) 0.02 M in ddH2O, stored at 4 °C Bovine Serum Albumin (BSA) stored at 4 °C, Sigma-Aldrich
9
Denotation Composition/Manufacturer
Buffer for mouse infection PBS with 1 % FCS and 5 % P/S, stored at 4 °C
Buffer for virus dilutions PBS with 2 % FCS and 1% P/S, for virus titration stored at 4 °C
Buffer for organ homogenization PBS with 1 % FCS and 2 % P/S, for virus titration stored at 4 °
Buffer for FACS staining PBS with 0.5 % BSA and 2 mM EDTA, stored at 4 °C
Buffer for cell sorting PBS with 2 % FCS and 1mM EDTA, stored at 4 °C
Collagenase type IV 40 mg/mL in HBSS, stored at -20 °C, Merck
Crystal violet ddH20, supplemented with
0.2 % crystal violet, 2 % ethanol, 11 % formaldehyde
Cultivation medium 1 x DMEM supplemented with 5 or
for cell culture and target cells 10 % FCS, stored at 4 °C
Cultivation medium for T cells 1 x VLE RPMI 1640, supplemented
with 10 % FCS,
1 % P/S and 50 μM ß-ME, stored at 4 °C
Dimethylsulfoxid (DMSO) Merck
Ethylenediaminetetraacetic acid (EDTA) Carl Roth GmbH & Co. KG
FCS heat-inactivated at 56 °C for 30 min,
stored at 4 °C, Biowest Formaldehyde, 16 %, methanol-free Polysciences, Inc.
Freezing medium FCS containing 10 % DMSO,
stored at 4 °C
Glucose oxidase Sigma-Aldrich, stored at -20 °C
Growth medium L929 cells DMEM, supplemented with 5 % FCS, for virus titration 1 % P/S, stored at 4 °C
10
Denotation Composition/Manufacturer
HBSS, no calcium, no magnesium, GibcoTM no phenol red
Hoechst 33342 ThermoFisher Scientific
Laemmli buffer (5x) 60 mM Tris/HCl, 25 % Glycerol
10 % β-ME, 2 % SDS
0.2 % bromphenol blue in H2O Stored at -20 °C
Liver digestion medium DMEM supplemented with 5 %
FCS, 1 % P/S, 1 mg/mL collagenase (type IV)
Lysis buffer for 51Cr-release 1.6 % Triton-X-100 (v/v) in ddH2O, stored at 4 °C
Methyl cellulose medium 20 % 10 x DMEM
for virus titration 220 mg/L Sodium-Pyruvate 7.4 g/L NaHCO3
1.16 g/L L-Glutamine 2 % P/S
10 % FCS 54 % ddH2O
0.9 % methyl cellulose
Myeloperoxidase, human Lee Biosolutions, stored at 4 °C
Natrium Chloride (NaCl) AppliChem
PageRuler Prestained Protein Ladder stored at -20 °C, ThermoScientific Paraformaldehyde (PFA) solution 4 % PFA in PBS, stored at -20 °C
PBS 1 x Dulbecco´s phosphate buffered
salt solution, pH 7.4, stored at 4 °C peqGOLD TriFastTM stored in the dark at 4 °C, Peqlab
P/S penicillin (10000 U/mL) and
streptomycin (10 ng/mL) in ddH2O, stored at -20 °C
11
Denotation Composition/Manufacturer
Phorbol 12-myristate 13-acetate (PMA) 1 mg in 1 mL ethanol, stored in the dark at -20 °C, Sigma-Aldrich
Phosphatase inhibitors stored at 4 °C, Roche
Powdered milk Carl Roth GmbH & Co. KG
ProLong™ Gold Antifade Mountant ThermoFisher Scientific
Propidium Iodide BD PharmingenTM, stored at 4°C
Protease inhibitors Roche
RIPA buffer 150 mM NaCl, 50 mM TrisHCl,
1 % SDS, 0.5 % Nonidet P40, 0.1 % deoxicolic acid
RNase A stored at -20 °C,
ThermoFisher Scientific
RNaseZAP™ Sigma-Aldrich
Roti-Blot A anode buffer (10x) Carl Roth GmbH & Co. KG Roti-Blot K cathode buffer (10x) Carl Roth GmbH & Co. KG
Sodium chromate [51Cr] 400 μL sodium chromate (Na2CrO4), 2 mCi/ml, Hartmann Analytics
Sytox Green 5 mM stored at -20 °C,
ThermoFisher Scientific
TBS 150 mM NaCl, 10 mM TrisHCl
in ddH2O
TBS-T 0.1 % Tween 20 in TBS
TEMED stored at 4 °C, AppliChem
TrisHCl buffer Bio-Rad Laboratories, Inc.
Triton X-100 Sigma-Aldrich
Trypanblue solution 1 x ready to use solution Trypsin-EDTA solution 10 x trypsin-EDTA solution,
diluted to 1 x using sterile ddH2O
Tween 20 AppliChem
12 2.1.5 Antibodies
Antigen Specification Provider
primary
β-actin mouse anti-mouse, unconjugated Sigma-Aldrich mAb (clone AC-74)
1:10000 for Western Blot
CD4 (L3T4) rat anti-mouse APC-, PE- or FITC- eBioscience conjugated mAb (clone GK1.5);
1:200 for FACS
CD8a rat anti-mouse APC-conjugated BD Biosciences mAb (clone GK1.5);
1:200 for FACS
CD11b rat anti-mouse APC-conjugated BD Biosciences mAb (clone M1/70);
1:200 for FACS
cl. caspase 3 rabbit anti-mouse, unconjugated Sigma mAb (clone RM250)
1:1000 for Western Blot
F4/80 rat anti-mouse, PE-conjugated eBioscience mAb (clone BM8);
1:200 for FACS
IFNγ rat anti-mouse, FITC-conjugated BD Biosciences mAb (clone XMG1.2)
1:100 for FACS
Ly6C rat anti-mouse, APC-conjugated BD Biosciences mAb (clone AL-21);
1:200 for FACS
13
Antigen Specification Provider
primary
Ly6G rat anti-mouse, unconjugated BioXCell mAb (clone 1A8);
400 µg for in vivo neutrophil depletion
rat anti-mouse, PE-conjugated BioLegend mAb (clone 1A8);
1:200 for FACS
MPO mouse anti-mouse, FITC-conjugated Hycult Biotech mAb (clone 8F4);
1:50 for FACS
1:50 for immunofluorescence
Major Histocompatibility Complex (MHC) dextramers
H-2 Db- H-2Db-restricted immunodominant Immudex
dextramers epitope loaded with (Denmark)
GP33-41 of LCMV (KAVYNFATC),
GP276-286 of LCMV (FQPQNGQFI)
and NP396-404 of LCMV (SGVENPGGYCL);
PE-conjugated MHC dextramer;
1:100 for FACS
Antigen Specification Provider
Secondary
IgG goat anti-mouse, HRP-conjugated Sigma-Aldrich polyclonal Ab
1:6000 for Western Blot
14 IgG goat anti-rabbit, HRP-conjugated Sigma-Aldrich
polyclonal Ab
1:5000 for Western Blot
IgG goat anti-mouse, Alexa Fluor 488-conjugated polyclonal Ab
1:500 for immunofluorescence
Antigen Specification Provider
isotype control
IgG1 mouse anti-mouse, FITC-conjugated Hycult Biotech mAb (clone MOPC-21);
1:50 for FACS
IgG1κ rat anti-mouse, FITC-conjugated BD Biosciences mAb (clone R3-34)
1:100 for FACS
2.1.6 Kits
Denotation Composition/Manufacturer
BCA Protein Assay ThermoFisher Scientific
Click-iT™ Plus TUNEL Assay ThermoFisher Scientific Cytofix/Cytoperm™ Fixation/Permeabilization BD
DNase I Sigma-Aldrich
DyNAmo Flash SYBR Green qPCR ThermoFisher Scientific EasySep™ Mouse CD8a Positive Selection STEMCELL Technologies EasySep™ Mouse Neutrophil Enrichment STEMCELL Technologies
ELISA mouse MPO Hycult Biotech
RevertAid First Strand cDNA Synthesis ThermoFisher Scientific
15 2.1.7 Technical equipment
Device Specification Company
Centrifuge 5417 R Eppendorf
Cell counting chamber Neubauer Improved LO Laboroptik
EasySep™ Magnet EasyEights™ STEMCELLTechnologies
Electrophoresis cell Criterion Cell Bio-Rad Laboratories, Inc.
Flow cytometer FACSCalibur Becton Dickinson
Fluorescence microscope IX81 Olympus
γ-counter COBRA II Canberra Packard
GentleMACS Octo Dissociator Miltenyi Biotech
Imaging system MF-ChemiBIS 3.2 DNR Bio Imaging Systems
Incubator Heracell Heraeus
LightCycler® 480 Instrument II Roche
Magnetic mixer RET IKA
Megafuge 1.0 R Heraeus
Microtiterplate-reader Tecan infinite M1000 Tecan Group Ltd.
Microscope DMi1 Leica
Multimode reader TrisStar LB941 Berthold
NanoDropTM One/OneW ThermoFisher Scientific
Protein blotting system Trans-Blot Turbo Bio-Rad Laboratories, Inc.
Reflotron Reflotron® Plus System Roche
Spring caliper Oditest H. C. Kroplin GmbH
Thermomixer Comfort Eppendorf
TissueLyser LT Qiagen
Vortex Genie 2 Scientific Industries
Working Bench Herasafe Heraeus
16 2.1.8 Consumables
Denotation Composition/Manufacturer
Bottle-Top-Filter, 0.45 µm Nalgene
Cell Culture Plastic TPP
Cell strainer 40 or 70 µm Falcon
Cover glass (13 mm) VWR International
FACS tubes BD Biosciences
Falcon tubes (15 and 50 mL) Greiner Bio-One
gentleMACS M tubes Miltenyi Biotec
Microscope slides Engelbrecht
Reflotron® GOT Roche
Reflotron® GPT Roche
Syringes and needles Braun
Whatman 3 mm (filter paper) GE Healthcare
Whatman Nitrocellulose membrane GE Healthcare
2.1.9 Software
Denotation Composition/Manufacturer
Cell Quest Pro Becton Dickinson
Fluoview FV1000 Ver. 1.7a Olympus Corporation
GraphPad Prism 7 GraphPad Software, Inc.
ImageJ 1.46h software Wayne Rasband
Office Professional Plus 2010 Microsoft
Photo Shop CS3 Adobe
Sigma Plot 13.0 Systat Software, Inc.
17 2.2 Methods
2.2.1 Cell culture
Cells were cultured under sterile conditions at 37 °C in a humid atmosphere containing 5 % CO2. Cells were grown and maintained in tissue culture flasks and passaged in a ratio of one to five every 2-3 days after treatment with trypsin-EDTA.
For long-term storage at -150 °C, cells were suspended in FCS containing 10 % DMSO.
2.2.2 Induction of immunopathological syndromes 2.2.2.1 Infection of mice with LCMV
For infection of adult mice (6 to 8 weeks of age) with LCMV, strain WE,
plaque-forming units (PFU) were converted into infectious units (IU) by multiplying the PFU with a factor of 10 as previously described [106]. To induce LCMV-mediated hepatitis, mice were infected by intraperitoneal (i.p.) inoculation of 1 x 10⁶ IU of LCMV in PBS with 1 % FCS and 5 %. For delayed-type hypersensitivity (DTH) reaction LCMV was subcutaneously (s.c.) inoculated at a dose of 1 x 10⁵ IU into the right hind footpad. To induce choriomeningitis mice were infected by intracranial (i.c.) injection of 103 IU of LCMV.
2.2.2.2 LCMV-induced choriomeningitis
Following i.c. injection of 103 IU of LCMV, mice were monitored for their clinical symptoms. Initially, mice were inspected and weighed daily. After first appearance of symptoms, mice were observed at 6 h intervals.
18 2.2.2.3 Delayed-type hypersensitivity (DTH) reaction
To induce DTH reaction, 105 IU of LCMV were subcutaneously (s.c.) inoculated into the right hind foot pad. From day 5 onwards, footpad swelling was measured daily with a spring caliper (Oditest, especially equipped with a soft spring, H. C. Kroplin GmbH, Schluchtern. Germany). The swelling was expressed as the factor of the thickness of the inoculated foot to the thickness of the contralateral non- inoculated foot [107, 108].
2.2.2.4 LCMV-induced hepatitis
Mice were infected i.p. with 106 IU of LCMV. At the indicated days, serum samples were prepared to measure activity of the hepatic enzymes alanine aminotransferase (ALT) and aspartate aminotransferase (AST) with the appropriate test strips using the Reflotron Plus System according to the instructions of the manufacturer (Roche).
Additionally, liver sections were prepared for histopathological analysis in cooperation with Dr. Katharina Pütz, Institute for Pathology, University Hospital Cologne and Dr.
Sonja Djudjaj, Institute of Pathology, University hospital RWTH Aachen. After 24 h of fixation in 4 % buffered formalin, liver specimens were embedded into paraffin.
Histological quantitative examination of liver fibrosis was performed after hematoxylin and eosin (H&E) staining. Inflammatory activity (i.e. periportal or periseptal interface hepatitis, confluent necrosis, focal (spotty) lytic necrosis, apoptosis and focal inflammation as well as portal inflammation) was assessed according to the Ishak score [109].
2.2.3 Virus titration
The WE strain of LCMV was propagated and titrated as plaque-forming units (PFU) on L929 cells as previously described [110]. Viral loads in spleen or liver
19 samples were titrated as PFU per gram. At the indicated days post infection (p.i.), organs of LCMV-infected mice were collected. The weight of organ pieces was determined and organ samples were homogenized in homogenization buffer supplemented with 1 % FCS and 2 % P/S by use of M-tubes in the gentleMACS Octo Dissociator (program protein_01). The samples were centrifuged for 10 min, at 4 °C and 300 x g, aliquoted and stored at -80 °C. 18 h prior to virus titration, 2 mL of L929 cell suspension at a density of 1.215 x 10⁵ cells/mL were seeded into 6-well plates and incubated at 37 °C and 5 % CO2. On the following day, the homogenized spleen and liver samples were thawed and diluted in 10-fold steps in PBS supplemented with 2 % FCS and 1 % P/S. For homogenized organ samples from days 6, 8 and 10 p.i., a serial dilution of 10-1, 10-2 and 10-3, for days 2 and 4 p.i. 10-3, 10-4 and 10-5 for the spleen and for the liver 10-1, 10-2 and 10-3 was used. Medium from the 6-well plates was aspirated carefully and 100 μL of the dilution of each sample was applied per well. Each dilution was analyzed in duplicates. After 30 min incubation at 37 °C and 5 % CO2, cells were covered with 2 mL methyl cellulose medium. After 3 days of incubation at 37 °C and 5 % CO2, 1.5 mL growth medium for virus titration was added per well. On the next day, medium was removed and 1 mL crystal violet was added per well and cells were fixed and stained. After 15 min of incubation, plates were rinsed with VE-water and dried for analysis.
2.2.4 Preparation of single cell suspensions 2.2.4.1 Single cell suspension from the spleen
At the experimental day, animals were sacrificed and their spleens were removed under sterile conditions. Single cell suspensions were obtained by gently squeezing the spleen and passing cell suspensions through a 70 μm nylon mesh with the plunger of a 3 mL syringe. Cells were centrifuged at 300 x g, for 10 min at 4 °C and cell pellets were resuspended in 5 mL T cell cultivation medium or buffer for FACS staining and passed through a 70 µm nylon mesh again. Viable cells were counted by Trypanblue exclusion in a Neubauer chamber.
20 2.2.4.2 Single cell suspension from the liver
At the experimental day, animals were sacrificed and their livers were perfused with 10 mL ice cold 0.9 % NaCl in a syringe by puncturing the portal vein and cutting the inferior vena cava to allow the fluid to flow freely through the liver until the liver turned brighter. The liver was removed and cut into small pieces. Liver digestion was performed with 5 mL pre-warmed liver digestion medium on a magnetic stirrer at 37
°C for 30 min. After digestion, the cell suspension was taken up in 20 mL ice cold PBS to stop the enzymatic activity and passed through a 70 µm nylon mesh. Cells were centrifuged at 50 x g, for 10 min at 4 °C. After centrifugation, hepatocytes made up the cell pellet and leukocytes were in the supernatant. For continued use of leukocytes, cells were centrifuged twice at 300 x g, for 10 min at 4 °C to get rid of remaining collagenase. For continued use of hepatocytes, cells were centrifuged twice at 50 x g, for 10 min at 4°C. Afterwards both cell types were resuspended in 5 mL cultivation medium or buffer for FACS staining. Viable cells were counted by Trypanblue exclusion in a Neubauer chamber.
2.2.5 Immunomagnetic enrichment of CD8+ T cells from the spleen or the liver
For positive selection, CD8+ T cells were immunomagnetically enriched from splenic or hepatic cell suspensions (2.2.4.1 and 2.2.4.2), using a combination of CD8α-specific Abs following the manufacturer’s instructions (STEMCELL Technologies). After 3 min of incubation at room temperature (RT), cells were magnetically labelled with dextran beads for 3 min at RT. Samples were placed in either 15 mL Falcons or FACS tubes into the EasySepTM “EasyEightsTM” magnet for 10 min at RT. Magnetically labelled cells were retained in the tube, while unlabeled cells were aspirated. This step was repeated twice. After removal from the magnetic field, cells were resuspended in buffer or medium, centrifuged and counted by Trypanblue exclusion in a Neubauer chamber. The frequencies of enriched CD8+ T cells were assessed by flow cytometry to be between 95–98 %.
21 2.2.6 Immunomagnetic enrichment of neutrophils from the bone marrow
Mice were sacrificed by cervical dislocation and the skin and muscles were removed from the hind legs. Afterwards, the legs were detached from the mouse and the ends of the femur and shin were opened. The opened bones were rinsed with 5 mL VLE RPMI 1640 medium, using a syringe with a thin needle (0.6 x 30 mm). The released bone marrow was resuspended and collected in a 50 mL falcon tube.
For negative selection of neutrophils, other cell types in the cell suspension were immunomagnetically removed, using a combination of specific Abs following the manufacturer’s instructions (STEMCELL Technologies). After incubation for 15 min at 4 °C, cells were washed and a biotin selection cocktail was added, followed by incubation for 15 min at 4 °C. Afterwards, magnetic particles were added and cells were incubated for another 10 min at 4 °C. The tubes were placed in the magnetic field and labelled cells were kept in the tube, while enriched neutrophils remained unbound in the supernatant. The frequencies of enriched neutrophils were assessed by flow cytometry to be between 80–90 %.
2.2.7 Assay for virus-specific cytotoxicity of CD8+ T cells
The virus-specific cytotoxic activity of CD8+ T cells from the spleen or the liver was measured in 51Chromium ([51Cr])-release assays according to Brunner et al.
[111] with modifications [112].
Effector cells
Total splenocytes, enriched splenic or enriched hepatic CD8+ T cells were used as effector cells. CD8+ T cells were immunomagnetically enriched from splenic or hepatic single cell suspensions of mice acutely infected with LCMV on days 7 and 8 p.i., as described under 2.2.4.1 and 2.2.4.2. Effector cells were adjusted to 3 x 10⁶ cells/mL in RPMI medium supplemented with 10 % FCS, 1 % P/S and 50 μM ß-ME.
22 Target cells
C57/SV target cells were plated at a density of 5 x 10⁵ or 1 x 10⁶, respectively, into 10 cm cell culture dishes two days before the experiment. After attachment, target cells were infected with LCMV at an MOI of 0.01. As negative control, non-infected fibroblasts were used. 1 x 10⁶ target cells were incubated with approximately 50 µCi of [51Cr] sodium chromate (Hartmann Analytics) for 60 min at 37 °C, washed three times and adjusted to a density of 3 x 10⁴ cells per mL.
Procedure
In three replicates, 200 μL of the effector cell suspension was dispensed in 96-U bottom plate and diluted 1:2 three times, to get effector to target ratios of 100:1, 50:1, 25:1 and 12.5:1. Afterwards, 100 μL of the target cell suspension was added to each well with effector cells. The spontaneous release of [51Cr] by [51Cr]-labelled target cells was determined in 6 wells without effector cells to be less than 9 % of the maximum release. The maximal [51Cr]-release was determined by target cell lysis in 100 µL 1.6 % Triton X-100. The virus-specific cytotoxic activity of CD8+ T cells was determined after 4 h incubation at 37 °C and 5 % CO2. Cells were spun down and 100 μL of cell-free supernatants was harvested. Supernatants from each well were measured in a γ-counter to detect the amount of [51Cr] released by target cells as counts per minute (cpm). The mean of the 4 replicates was calculated before the virus-specific lysis of target cells was calculated with correction for spontaneous lysis, as following for each effector to target ratio:
% specific lysis = (cpm sample – cpm spontan) / (cpm maximal – cpm spontan) x100
2.2.8 Stimulation of LCMV-specific CD8+ T cells
To investigate the role of MPO on IFNγ production by CD8+ T cells, the intracellular accumulation of IFNγ was analyzed. To this end, enriched CD8+ T cells were co-incubated with LCMV-infected fibroblasts (MHC class I restriction to CD8).
23 2.2.8.1 Preparation of target cells for CD8+ T cell stimulation
For antigen-specific stimulation of enriched CD8+ T cells, LCMV-infected C57/SV target cells were prepared as described under 2.2.7.
2.2.8.2 Antigen-specific stimulation of CD8+ T cells
For measurement of intracellular accumulation of IFNγ, 1 x 10⁵ enriched splenic or hepatic CD8+ T cells were incubated for 4 h with either LCMV-infected or non-infected C57/SV fibroblasts. To prevent secretion of IFNγ, cells were treated with 1 µL BD GolgiStopTM (BD Biosciences) 1h prior to stimulation until fixation.
2.2.9 Flow cytometry
2.2.9.1 Staining of surface molecules
The frequencies of cells or expression intensities of surface molecules (indicated as mean fluorescence intensity (MFI)) were determined by flow cytometry.
Cells were washed with PBS supplemented with 0.5 % BSA and 2 mM EDTA. To avoid unspecific Ab binding and staining of cells, 1x10⁶ cells were incubated with 1 µL FcR Block™ for 10 min at 4 °C. Staining was performed for 15 min with 0.5 μg of fluorochrome-conjugated mAb specific for CD4, CD8α, CD11b, F4/80, Ly6-C or Ly6- G at 4 °C in the dark. After incubation, cells were washed twice with cold PBS supplemented with 0.5 % BSA and 2 mM EDTA and analyzed by flow cytometry using a FACSCalibur (BD).
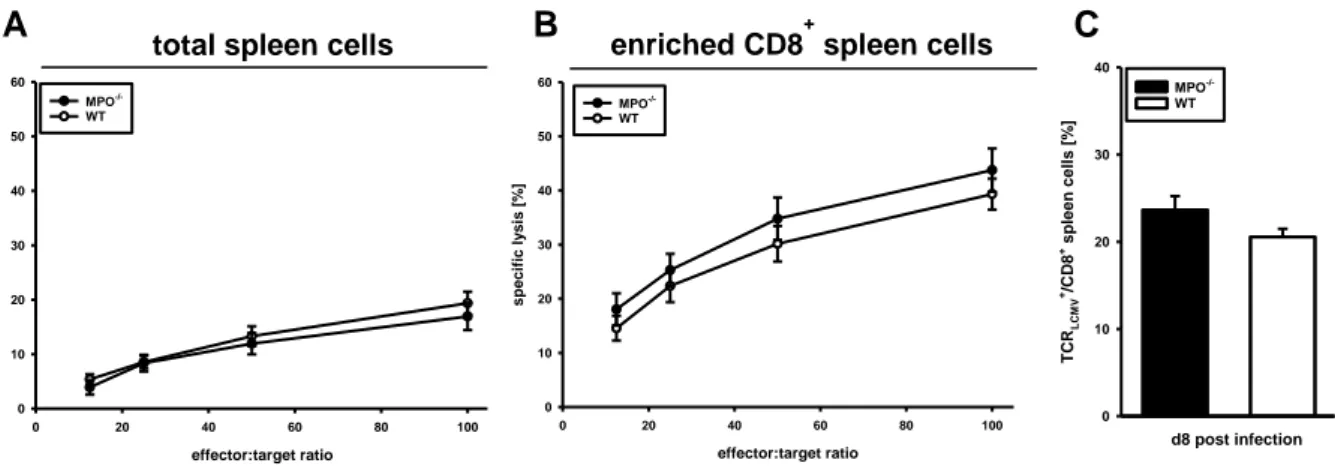
LCMV-specific CD8+ T cells were detected among spleen or liver cells of C57BL/6 mice by using PE-conjugated H-2Db-dextramers loaded with either of the three H- 2Db-restricted immunodominant epitopes of LCMV (GP33-41, GP276-286, and NP396-404) (Immudex, Copenhagen, Denmark). Dot plots of total splenocytes or liver leukocytes from C57BL/6 mice displayed co-staining for H-2Db-restricted immunodominant epitopes GP33-41, GP276-286, and NP396-404 with CD8.
24 The frequencies of LCMV-specific CD8+ T cells were calculated as follows:
% TCRLCMV+
CD8+ cells / % CD8+ spleen cells x 100
Bar charts show the percentage of CD8+ spleen cells from C57BL/6 mice expressing TCR in sum for the three major immunodominant H-2Db-restricted epitopes GP33-41, GP276-286, and NP396-404.
2.2.9.2 Staining of intracellular molecules
For analysis of intracellular IFNγ and MPO, 1 x 10⁶ splenocytes or liver leukocytes were washed twice with PBS and fixed with 100 µL Fixation/Permeabilization solution (BD Biosciences) in a 96-U bottom plate for 20 min at 4 °C. Afterwards, cells were washed twice with 1 x Perm/WashTM (BD Biosciences) with 250 µL/wash total volume to remove all traces of Fixation/Permeabilization solution. Primary mAbs were diluted in 50 µL 1 x Perm/WashTM and added to fixed cells for 30 min at 4 °C. After two times washing with Perm/WashTM in 250 µL/wash total volume, cells were analyzed for intracellular IFNγ and MPO expression by flow cytometry.
2.2.9.3 MPO cytotoxicity assay with murine primary hepatocytes
Hepatocytes were isolated according to procedure under 2.2.4.2. Hepatocytes were seeded at a density of 2 x 10⁵ / mL in DMEM with 1 % P/S without FCS in a 24- well plate. Cells were incubated with either 0.1 U/mL Glucose oxidase (GOX), 0.1 U/mL MPO or 1.0 U/mL MPO alone or in combination with GOX and 0.1 U/mL or 1.0 U/mL MPO. Control cells were left untreated. After incubation for 4 h at 37°C, specific cell death was assessed by flow cytometry via Propidium iodide staining.
Hepatocytes were analyzed according to appearance in the FSC and SSC and spontaneous cell death of untreated cells was substracted from data obtained from treated cells.
25 2.2.9.4 SYTOX Green NETosis assay
Inactive neutrophils were enriched from the bone marrow of naive mice according to the procedure described under 2.2.6. Neutrophils were adjusted to a density of 1 x 10⁶ cells/mL and 5 x 10⁵ cells were seeded in a 48-well microtiterplate.
Cells were stimulated with either 25 nM PMA, or LCMV at MOI 10 and MOI 100 for 4 h at 37 °C and 5 % CO2. Controls remained untreated. After incubation, cells were washed twice with HBSS and adjusted to a density of 1 x 10⁶ cells/mL, 100 µl of cell suspension was used for flow cytometry. Extracellular DNA was stained with 100 nM of cell impermeable dye SYTOX Green for 15 min at 4 °C, followed by two washing steps with HBSS. Extracellular DNA released by neutrophils was analyzed by flow cytometry.
2.2.9.5 Cell cycle analysis of hepatocytes using propidium iodide
Cell cycle analysis of hepatocytes was performed by quantification of DNA content with propidium iodide by flow cytometry. Primary hepatocytes were isolated as described in 2.2.4.2. Cells were fixed in cold 70 % ethanol for 30 min at 4 °C.
Afterwards, cells were washed twice in PBS and centrifuged at 850 x g for 5 min. The cell pellet was taken up in 1 mL PBS. As propidium iodide also stains RNA, cells were treated with 1 µg RNase A for 15 min at 37 °C. For FACS analysis 150 µL of the cell suspension was taken up in 350 µL FACS buffer and DNA was stained by addition of 0.5 µg propidium iodide and analyzed immediately.
Cells that are in the S phase will have more DNA than in the G1 phase and cells in the G2 phase will be approximately twice as bright.
26 2.2.10 Western Blot analysis of cleaved caspase 3
2.2.10.1 Homogenization of liver tissue
Freshly isolated liver tissue (~10 mg) was taken up into m-tubes (Miltenyi Biotec) in 500 µL RIPA buffer with benzonase and protease/phosphatase inhibitors.
Tissue was homogenized using GentleMACSTM Octo Dissociator (Miltenyi Biotec) at program protein_01. Homogenates were centrifuged at 836 x g, for 10 min at 4 °C, the pellet was discarded. Lysates were transferred into 1.5 mL Eppendorf tubes followed by incubation at 95 °C for 5 min. After short condensation on ice, the samples were briefly centrifuged. Protein concentration was determined using BCA Protein Assay Kit in accordance with the protocol of the supplier (Pierce, Thermo Scientific). Finally, protein concentration was adjusted to 35 μg in 5 x Laemmli buffer and H2O.
2.2.10.2 SDS-PAGE and Western Blot
Prior to SDS PAGE, the lysates were incubated at 95° C for 10 min. SDS PAGE was performed according to the manufacturer´s protocol (Bio-Rad Laboratories, Inc.), using a Criterion Cell filled with (1 x) TGS running buffer and Criterion Cassettes containing a 14 % Tris/HCl gel for cleaved caspase 3 blot. After SDS-PAGE, proteins were transferred onto a nitrocellulose membrane according to the manufacturer´s protocol (Bio-Rad Laboratories, Inc.) using a Trans-Blot Turbo system.
In order to block unspecific binding sites, the membranes were incubated in milk blocking solution for 30 min at RT. Afterwards the membranes were incubated with primary Ab in blocking solution overnight at 4 °C. Monoclonal Abs against cleaved caspase 3 and β-actin (diluted in milk blocking solution) were from Sigma-Aldrich.
Unbound Abs were removed by triple washing of the membrane with TBST.
Thereafter, membranes were incubated with HRP-conjugated secondary Abs in blocking solution for 60 min at RT. Again, unbound Abs were removed by washing two times with TBST and once with TBS. The immune complex was visualized using
27 Amersham ELC Detection reagents (GE Healthcare) and detected using the MF- ChemiBIS 3.2 imaging system (DNR Bio Imaging Systems). PageRuler Prestained Protein Ladder (Thermo Scientific) was used for identification of protein size. Specific bands on immunoblots were quantified by densitometry using ImageJ 1.46h software (Wayne Rasband, NIH, USA).
2.2.11 Quantification of MPO in the plasma and liver tissue homogenates
At the experimental days, blood was collected from the superficial temporal vein of mice. Plasma was prepared by use of Mircovette 500 LH according to the manufacturer´s protocol (Sarstedt). After incubation for 5 min, blood samples were centrifuged for 5 min at 2000 x g and plasma was aliquoted and stored at -80 °C. For liver tissue homogenization, snap-frozen tissue was prepared as described under 2.2.10.1. Protein concentration was determined using BCA Protein Assay Kit in accordance with the protocol of the supplier (Pierce, Thermo Scientific).
Systemic levels of extracellular MPO in the plasma of mice and total protein levels in liver tissue homogenates were analyzed with the MPO mouse ELISA kit (HycultBiotech) according to the manufacturer´s instructions.
2.2.12 Quantitative real-time PCR
2.2.12.1 RNA isolation and cDNA synthesis
To obtain total RNA from liver tissue, peqGOLD TriFastTM was used according to manufacturer’s instructions (peqlab).
The RNA yield was quantified by NanoDropTM Spectrophotometer (ThermoFisher Scientific). The quality of RNA was determined through the ratio of A260/A280 (ratio of ~2.0 is accepted). DNA digestion was performed using the DNase I kit according to the manufacturer´s instructions (Sigma-Aldrich). For cDNA synthesis a total amount of 1 μg of RNA was used. Synthesis of cDNA was performed with the RevertAid First Strand cDNA Synthesis kit (ThermoFisher Scientific) according to the manufacturer´s protocol.
28 2.2.12.2 Quantitative real-time PCR (qRT-PCR)
Quantitative real-time PCR was performed with the DyNAmo Flash SYBR Green qPCR kit (ThermoFisher Scientific). The qRT-PCR was performed in the LightCyler480 (Roche). Gene expression of β-actin, Nox4, p21, p53 and TGFβ was analyzed by use of specific primer pairs for each gene, respectively. Primers were purchased by Sigma-Aldrich.
The composition of each PCR reaction sample was as follows:
2 µL cDNA
10 µL 2 x qPCR master mix 1 µM forward primer
1 µM reverse primer 6 µL DEPC-treated ddH2O
Total volume: 20 µL per reaction
PCR program:
1. Initial denaturation 95 °C 10 min 45 cycles
2. Denaturation 95 °C 10 sec
3. Annealing/Extension 60 °C 10 sec
Gene expression for each gene was determined by calculation of the threshold cycle- (Ct-) value. The value obtained for each gene was normalized to that of the housekeeping gene encoding β-actin. Then the fold change was calculated.
29 2.2.12.3 Primers
β-actin
Forward
5´-AGACCTGTACGCCAACACAG-3´
Reverse
5´-AGGAGGAGCAATGATCTTG-3´
Nox4
Forward
5´-AGAGCATCTGCATCTGTCCTGAACC-3´
Reverse
5´-AACAATCTTCTTGTTCTCCTGCTAGGGAC-3´
p21 [113]
Forward
5´-AGATCCACAG CGATATCCAGAC-3´
Reverse
5´-ACCGAAGAGACAACGGCACACT-3´
p53 [114]
Forward
5´- CTCCGAAGACTGGATGACTGC-3´
Reverse
5´- CAACAGATCGTCCATGCAGTG-3´
TGFβ [115]
Forward
5'-GGAGAGCCCTGGATACCAAC-3' Reverse
5'-CAACCCAGGTCCTTCCTAAA-3'
30 2.2.13 Immunofluorescence microscopy
Cryo sections (5 µm) of liver tissue were kindly generated by Gülsah Schwab (Heartcenter, University Hospital Cologne).
2.2.13.1 TUNEL staining
DNA double-strand breaks were stained using the Click-iT™ Plus TUNEL Assay (ThermoFisher Scientific). Sections were fixed and stained according to the manufacturer´s protocol (ThermoFisher Scientific).
2.2.13.2 MPO and Hoechst staining
Cryo sections were fixed with 4 % methanol-free formaldehyde for 15 min at room temperature (RT), followed by three washing steps with PBS for 5 min at RT.
Cells were permeabilized with PBS containing 0.1 % Trition X-100 for 20 min at RT.
Unspecific binding sites were blocked with PBS containing 3 % BSA and 0.1 % Triton X-100 for 1 h at RT. Afterwards, MPO was stained using mouse anti-mouse FITC- conjugated MPO mAb for 1 h at RT. Thereafter, sections were washed thrice with PBS in the dark. Nuclei were stained with 1:2000 of 10 mg/mL solution Hoechst 33342 (ThermoFisher Scientific) for 10 min at RT in the dark. Finally, slides were washed three times with PBS in the dark and coverslips were mounted on the microscope slides with ProLong™ Gold Antifade Mountant. Sections of the preparations were analyzed by confocal laser scanning microscopy.
31 2.2.14 In vivo neutrophil depletion
For neutrophil depletion, mice were intraperitoneally injected with 400 µg anti- Ly6-G (clone 1A8) Ab in PBS twice, one day prior to LCMV-infection an on day 4 p.i..
Control mice did not receive Ab-treatment. Neutrophil depletion was proven by flow cytometry via CD11b and Gr-1 staining. Populations of CD11b+/Gr-1hi cells were characterized as neutrophils.
2.2.15 In vivo MPO inhibition
For MPO inhibition mice were intraperitoneally injected with 25 µg/g body weight 4-Aminobenzoic acid hydrazide (4-ABAH) in PBS on the day of LCMV- infection and every second day until the experimental end. 4-ABAH was diluted to a stock concentration of 14 mg/mL in DMSO. Control mice were treated with DMSO in PBS alone at the indicated days.
2.2.16 Statistical analysis
Data on continuous variables were summarized by mean and standard error of the mean (SEM). Groups were compared using independent two-tailed student´s t-test.
The p-values of p < 0.05, p < 0.01 or p < 0.001 are indicated by *, ** or ***, respectively. The numbers of mice per group are indicated in the respective figure legends.
32
3 Results
3.1 Effects of MPO-deficiency on LCMV-specific immunopathological responses
LCMV is a non-cytopathic virus. However, it induces robust immunopathological reactions depending on the route of infection [116]. During acute infection of mice with LCMV, immunopathology is primarily mediated by virus-specific CD8+ T cells [117].
To assess whether MPO has an influence on immunopathology upon infection with LCMV, MPO-deficient (MPO-/-) mice and wt littermates were infected via different routes of virus inoculation to analyze the resulting immunopathological syndromes.
3.1.1 Influence of MPO on LCMV-induced choriomeningitis
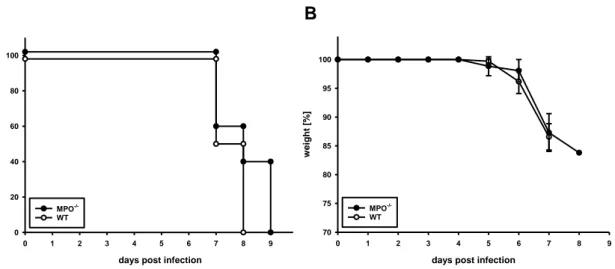
Upon inoculation of LCMV by intracerebral (i.c.) injection, the resulting fatal disease is mediated by immune cells, which infiltrate into the brain [118]. The immunopathological reaction of wt mice induced by i.c. inoculation of 103 IU of LCMV, strain WE, was lethal for 100 % of mice by day 8 p.i. (Fig. 1A). For MPO-/- mice, i.c.
infection was lethal for all individuals by day 9 p.i.. Over the course of infection, MPO-
/- and wt mice dramatically lost weight from day 5 p.i. on. However, weight loss was also comparable in wt and MPO-/- mice (Fig. 1B).
These data indicate that MPO-/- activity is not involved in the lethal outcome of immunopathology after i.c. infection of mice with LCMV.
33
A B
Fig. 1 Clinical course of meningitis after i.c. infection with LCMV
Groups MPO-/- and wt mice were infected by i.c. injection of 103 IU of LCMV, strain WE. (A) Survival and (B) body weight of the mice were observed daily. Shown are data from 1 experiment with n = 5 MPO-/- mice and n = 6 wt mice. Survival p.i. is shown as Kaplan-Meier plot.
3.1.2 Influence of MPO on LCMV-induced DTH reaction
Subcutaneous (s.c.) intraplantar inoculation of LCMV into the hind footpad of mice induces a delayed-type hypersensitivity (DTH) reaction. The immune reaction occurs in two distinct phases [98]. CD8+ T cells mediate a first swelling phase, which peaks around day 8 p.i.. A second minor swelling phase (days 10 to 16 p.i.) is mediated by CD4+ T cells [86]. The LCMV-induced DTH reaction was similar in both MPO-/- and wt mice. In both, footpad swelling peaked to a similar extent on day 8 p.i.
and slowly declined within the following days (Fig. 2).
These data show that the lack of MPO has no influence on the intensity of the LCMV- induced DTH reaction. This indicates that MPO does not impact the T cell response after s.c. intraplantar infection of mice with LCMV.
days post infection
0 1 2 3 4 5 6 7 8 9
survival [%]
0 20 40 60 80 100
MPO-/- WT
days post infection
0 1 2 3 4 5 6 7 8 9
weight [%]
70 75 80 85 90 95 100
WT MPO-/-
34 Fig. 2 Influence of MPO on LCMV-specific delayed-type hypersensitivity (DTH)
reaction
Groups of MPO-/- and wt mice were infected by s.c. injection with 105 IU LCMV, strain WE, into the right hind footpad. On the indicated days p.i., the swelling factor (ratio of the dorso- ventral thickness of the inoculated foot over that of the non-inoculated foot) was determined.
Shown are cumulative data as means ±SEM from 2 experiments with n = 13 MPO-/- mice and n = 3 wt mice.
3.1.3 Course of hepatitis during acute infection of mice with LCMV
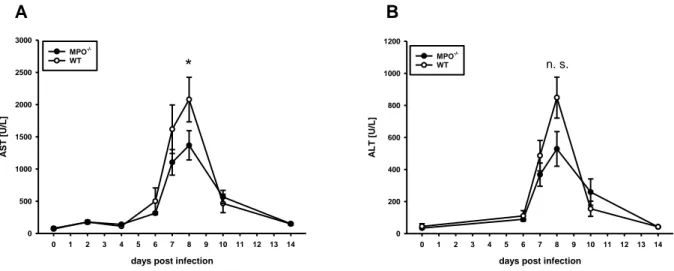
Acute hepatitis following intraperitoneal (i.p.) injection of LCMV was investigated by determining serum transaminase activity of aspartate aminotransferase (AST) and alanine aminotransferase (ALT) (Fig. 3).
In naïve MPO-/- and wt mice, background AST activity was at about 90 U/L. Until day 4 p.i. background levels were not exceeded in neither MPO-/- nor wt mice. On day 6 p.i., AST activity increased to about 300 U/L in MPO-/- mice and to 500 U/L in wt mice. In wt mice, maximum AST activity was observed at about 2100 U/L on day 8 p.i., while there was a significant reduction in MPO-/- mice at about 1400 U/L.
Between days 8 and 10 p.i., AST activity decreased to ranges of about 500 U/L until it returned to background levels in both MPO-/- and wt mice by day 14 p.i. (Fig. 3A).
Similar to AST, ALT activity peaked on day 8 p.i. in MPO-/- and wt mice. In serums of MPO-/- mice, ALT activity was about 30 % lower on day 8 p.i. with 500 U/L. In wt
days post infection
4 5 6 7 8 9 10 11 12 13 14 15 16
swelling factor
1,0 1,2 1,4 1,6 1,8 2,0 2,2
WT MPO-/-