https://doi.org/10.1007/s10858-020-00348-4 ARTICLE
A suite of 19 F based relaxation dispersion experiments to assess biomolecular motions
Jan H. Overbeck
1· Werner Kremer
1· Remco Sprangers
1Received: 23 June 2020 / Accepted: 18 September 2020 / Published online: 30 September 2020
© The Author(s) 2020, corrected publication 2020
Abstract
Proteins and nucleic acids are highly dynamic bio-molecules that can populate a variety of conformational states. NMR relaxation dispersion (RD) methods are uniquely suited to quantify the associated kinetic and thermodynamic parameters.
Here, we present a consistent suite of
19F-based CPMG, on-resonance R
1ρand off-resonance R
1ρRD experiments. We validate these experiments by studying the unfolding transition of a 7.5 kDa cold shock protein. Furthermore we show that the
19F RD experiments are applicable to very large molecular machines by quantifying dynamics in the 360 kDa half-proteasome.
Our approach significantly extends the timescale of chemical exchange that can be studied with
19F RD, adds robustness to the extraction of exchange parameters and can determine the absolute chemical shifts of excited states. Importantly, due to the simplicity of
19F NMR spectra, it is possible to record complete datasets within hours on samples that are of very low costs. This makes the presented experiments ideally suited to complement static structural information from cryo-EM and X-ray crystallography with insights into functionally relevant motions.
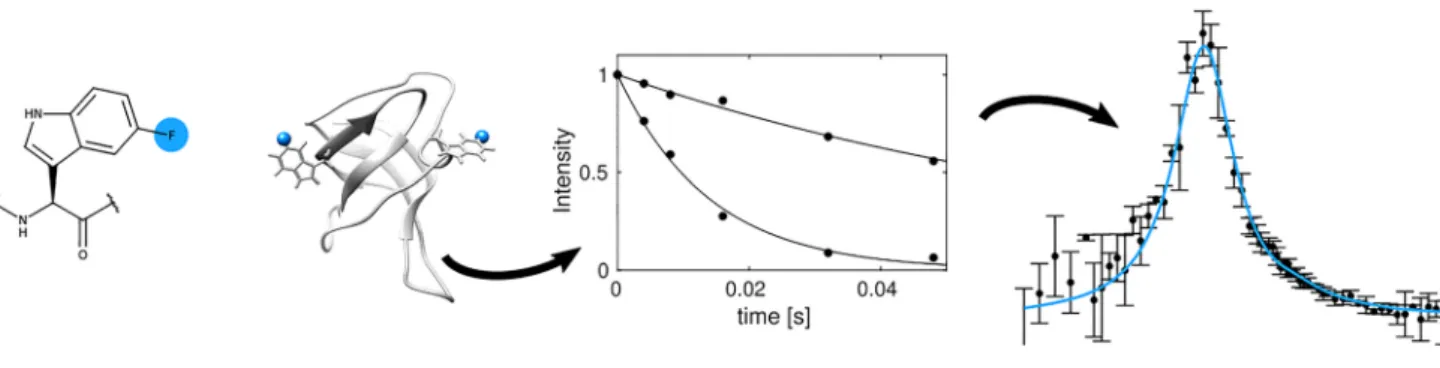
Graphic abstract
Keywords Fluorine · Large complexes · Protein folding · Relaxation dispersion · Structural dynamics.
Introduction
Bio-molecules are inherently dynamic and populate a num- ber of structurally different states. NMR spectroscopy is a unique tool to experimentally investigate these bio-molecu- lar motions with atomic resolution. When the exchange rates between the different states are on the millisecond timescale Carr–Purcell–Meiboom–Gill (CPMG) and rotating-frame relaxation experiments at different effective magnetic fields can be exploited to record relaxation dispersion (RD) pro- files. These profiles directly depend on thermodynamic
Electronic supplementary material
The online version of this article (https ://doi.org/10.1007/s1085 8-020-00348 -4) contains supplementary material, which is available to authorized users.
*
Remco Sprangers remco.sprangers@ur.de
1
Department of Biophysics I, Regensburg Center
for Biochemistry, University of Regensburg,
93053 Regensburg, Germany
(populations) and kinetic (rates) parameters of the exchange process and structural information (chemical shifts) of sparsely populated (invisible), short-lived excited states can be obtained. For proteins under 20 kDa, RD experiments can be recorded on protonated
15N-labeled samples, whereas deuteration and transverse relaxation optimized spectros- copy (TROSY; Pervushin et al. 1997) are required for larger systems. In very large complexes (> 80 kDa), methyl group labeling in a fully deuterated background combined with methyl TROSY based approaches (Tugarinov et al. 2003;
Schütz and Sprangers 2019; Abramov et al. 2020) can be used to record
13C single quantum (SQ; Skrynnikov et al.
2001; Lundström et al. 2007; Rennella et al. 2016) and
13C multiple quantum (MQ; Korzhnev et al. 2004) as well as
1H SQ (Tugarinov and Kay 2007; Baldwin et al. 2010; Otten et al. 2010; Weininger et al. 2012), double quantum (DQ;
Gopalan et al. 2018) and triple quantum (TQ; Gopalan et al.
2018) RD profiles.
Recently, fluorine (
19F) NMR has regained attraction (Hellmich et al. 2009; Liu et al. 2012; Kim et al. 2013;
Kitevski-Leblanc et al. 2013; Aramini et al. 2014; Hoang and Prosser 2014; Manglik et al. 2015; Matei and Gronen- born 2016; Lu et al. 2019; Huang et al. 2020). This spin is absent from virtually all biomolecules, however,
19F probes can be artificially introduced into proteins by incorporation of fluorinated amino acids (Crowley et al. 2012) or through post-translational modification with fluorine-containing tags (Brauer and Sykes 1986). These
19F labeling strategies pro- vide a number of advantages. First, the resulting samples contain only a limited number of NMR probes and spectra can often be recorded in a simple 1 dimensional (1D) man- ner. Second, in most cases, fluorine-based experiments can be recorded in a fully protonated background and samples can thus originate from sources where deuteration or methyl group labeling is not easily achievable (e.g. mammalian expression systems). Third,
19F experiments can comple- ment and verify information from deuterated systems, where structure, stability and dynamics can be altered due to the pervasive isotopic substitution (Korzhnev et al. 2005a, b).
Fourth,
19F shares favorable characteristics with
1H with respect to RD experiments (Juen et al. 2016), including reduced sample heating on probe heads with inverse coil configuration, short pulses and an extended range of acces- sible effective field strengths. Finally, the
19F chemical shift dispersion is large, which can result in significant chemical shift differences between the ground state and excited states and thus RD profiles that have large amplitudes.
In the past,
19F RD CPMG experiments have been exploited to study dynamic protein interfaces (Aramini et al. 2014), dynamic dimer asymmetry (Kim et al. 2017), allostery (Manglik et al. 2015), ligand-bound states (Hoang and Prosser 2014), protein folding (Kitevski-Leb- lanc et al. 2013) and fold-switching (Liebau et al. 2020).
In those experiments, a varying number of 180° pulses is applied within a fixed relaxation delay such that exchange induced line-broadening can be suppressed. Fitting of these RD profiles with analytical or numerical approaches provides insight into the exchange constant k
ex, the popula- tions p
Aand p
Bas well as the absolute value of the chemi- cal shift difference |Δω| between the two states. However, in many cases these data are not sufficient to unambigu- ously and accurately determine these parameters as sig- nificantly different exchange regimes can result in similar RD profiles. In those cases R
1ρexperiments can be used to resolve these ambiguities. In R
1ρexperiments the effec- tive relaxation rate is measured in the rotating frame as a function of spin-lock field strengths (“on-resonance”) or as a function of spin-lock offsets (“off-resonance”). Com- pared to the CPMG approach, this has several advantages.
First, R
1ρexperiments can access higher frequencies and thus allow quantification of faster dynamics. Second, off- resonance experiments can provide not only the magnitude but also the sign of Δω. Third, the sampling of points in the frequency dimension is not restricted, as it is in CPMG experiments where only frequencies that correspond to an integer number of 180° pulses in the relaxation delay are possible. Motivated by these considerations, we developed a suite of one-dimensional CPMG, on-resonance R
1ρand off-resonance R
1ρpulse sequences for
19F nuclei. We vali- date the experiments on the unfolding transition of a cold shock protein, show that they yield consistent exchange parameters and extract thermodynamic information from a temperature series of RD datasets. Moreover, we dem- onstrate the applicability of
19F rotating frame relaxation to a fully protonated 360 kDa protein complex.
Materials and methods Molecular biology
The protein coding sequence of cold shock protein from Thermotoga maritima (NCBI reference sequence WP_004082199.1, hereafter referred to as TmCsp, inter- nal reference: 2093) was codon optimized with COOL (http://bioin fo.bti.a-star.edu.sg/COOL/), synthesized by Integrated DNA Technologies (Coralville, USA) and cloned into a pETGB-1a vector (kindly provided by Dr.
Arie Geerlof, Helmholtz Zentrum München). The vec-
tor contains an N-terminal His6-GB1-tag followed by a
tobacco etch virus protease (TEV protease) cleavage site
constituted by the amino acid sequence ENLYFQGG. The
final protein sequence therefore contains an additional GG
at the N-terminus of the protein.
NMR sample preparation Thermotoga maritima Csp
Plasmids were transformed into Escherichia coli BL21(DE3) CodonPlus-RIL cells (Stratagene) and grown in LB over night. Subsequently, M9 medium was inoculated with the LB culture and grown to an optical density OD
600of 1.0 at 37 °C. The medium was then supplemented with 50 mg/l 5-fluoroindole (Crowley et al. 2012) that was dissolved in DMSO at a 100 mg/ml stock concentration. 45–60 min later protein expression was induced by addition of 1 mM IPTG and the culture was shifted to 20 °C. Cells were har- vested by centrifugation 12–18 h after induction. Cell pellets were resuspended in 10 mM Tris, pH 8.0, 10 mM imida- zole, 1 mM EDTA, 1:1000 Triton X-100, 1 mg/l lysozyme and 0.2 U/ml DNaseI by vortexing for 30 min at 4 °C and then lysed by sonification. After addition of 5 mM MgCl
2and 5 µg/ml RNaseA the sample was incubated for 2 h at 37 °C. The cell debris was removed by centrifugation, the supernatant was additionally cleared with a 0.45 µm syringe filter and loaded onto a nickel–NTA gravity flow column that was pre-equilibrated with buffer A (10 mM Tris, 10 mM imidazole, pH 8.0). Subsequently, the column was washed with 20–30 column volumes of buffer A and the bound protein was eluted with 10 mM Tris, 300 mM imi- dazole, pH 8.0. The His
6-GB1-tag was cleaved by addition of a His
6-tagged TEV protease during dialysis for 12–18 h against 10 mM Tris, pH 8.0, 1 mM DTT at 20 °C. In order to separate the His-tagged proteins from the target protein, the dialyzed proteins were loaded on a nickel–NTA column pre- equilibrated with 10 mM Tris, pH 8.0, 10 mM imidazole.
The column flow-through was dialyzed for 12–18 h against 10 mM NaHPO
4, pH 6.8 and loaded onto a 5 ml Heparin HP HiTrap™ column. The protein was eluted with a salt gradient (0–500 mM NaCl in the presence of 1 mM EDTA) and the target fractions were combined and concentrated to a final volume of 1–1.5 ml. Finally, the protein was puri- fied using a 16/600 Superdex S75 column in 50 mM Tris, pH 8.0, 100 mM NaCl, 1 mM EDTA. The target fractions were combined and concentrated with a simultaneous buffer exchange to 50 mM NaHPO
4, pH 6.5, 20 mM NaCl, 0.2 mM EDTA, 1 mM DTT. The NMR sample was supplemented with 0.03% NaN
3and 5% D
2O, the final protein concentra- tion was 550 μM.
Thermoplasma acidophilum α
7α
7complex
Plasmids were transformed into E. coli BL21(DE3) Codon- Plus-RIL cells (Stratagene) and grown in LB over night.
Fresh LB medium including antibiotics was inoculated from the overnight culture and grown to an optical density OD
600of 0.6–0.8 at 37 °C. The culture was shifted to 20 °C and
protein expression induced with 0.5 mM IPTG for 12–18 h.
Cell pellets were resuspended in 50 mM sodium phosphate, pH 7.4, 400 mM NaCl, 10 mM imidazole, 1 mM EDTA, 1:1000 Triton X-100, 1 mg/l lysozyme and 0.2 U/ml DNaseI by vortexing for 30 min at 4 °C and lysed by sonification.
The cell debris was removed by centrifugation, the super- natant was additionally cleared with a 0.45 µm syringe fil- ter and loaded on a nickel–NTA gravity flow column that was pre-equilibrated with buffer A2 (50 mM sodium phos- phate, pH 7.4, 400 mM NaCl, 10 mM imidazole). In order to remove weakly bound contaminating proteins, the column was washed with 20–30 column volumes of buffer A2, after which the protein was eluted with 50 mM sodium phosphate, pH 7.4, 150 mM NaCl, 300 mM imidazole. The His
6tag was cleaved with His
6-tagged TEV protease while dialyzing the elution against 50 mM sodium phosphate, pH 7.4, 150 mM NaCl, 1 mM DTT at 4 °C. The dialyzed sample was loaded on a second nickel–NTA column pre-equilibrated with buffer A2. The column flow-through was concentrated to 1 ml and finally purified using a 16/600 Superdex S200 column in 25 mM HEPES, pH 7.3, 125 mM NaCl, 1 mM DTT. The target fractions were combined and concentrated again to a volume of 0.5 ml. Bromotrifluoroacetone (Sigma-Aldrich) was added to a final concentration of 10 mM and incubated at 37 °C for 30′. The reaction was quenched with 20 mM DTT and the sample was purified over a PD 10 column pre- equilibrated with 25 mM HEPES, pH 7.3, 125 mM NaCl, 1 mM DTT. The NMR sample was supplemented with 0.03% NaN
3and 5% D
2O, the final protein concentration was 1.3 mM (monomer concentration), corresponding to 93 µM α
7α
7complex for the 18C mutant, and 0.75 mM (monomer concentration), corresponding to 54 µM α
7α
7complex for the 35C mutant.
NMR spectroscopy
All NMR RD experiments were recorded on a 500 MHz
Bruker NEO NMR spectrometer equipped with triple reso-
nance TCI H/F–C–N–D nitrogen cooled probehead, where
the proton coil was tuned and matched to the
19F resonance
frequency (470 MHz). Data was acquired with 1024 points
in the direct dimension and a relaxation delay of 1.5 s. The
1D spectra of TmCsp (Fig. 1) were recorded at 333 K, 343 K
and 373 K on a Bruker 600 MHz spectrometer equipped
with a TBI H–F–D probehead. Temperatures were calibrated
using an ethylene glycol sample. Both the ethylene glycol
sample as well as the sample of 5-fluoroindole dissolved in
glycerol were locked using a capillary filled with D
2O that
was inserted into the 5 mm NMR tube.
19F spectra were
referenced to TFA indirectly by measuring the absolute pro-
ton frequency of DSS and using a correction factor Ξ of
0.940866982 (Maurer and Kalbitzer 1996).
The CPMG experiments for TmCsp were recorded with a relaxation delay of 40 ms and with 23 different CPMG frequencies of 50, 100, 150, 200, 250, 300, 350, 400, 450, 500, 600, 700, 800, 900, 1000, 1500, 2000, 2500, 3000, 3500, 4000, 4500 and 5000 Hz.
The CPMG experiments for the α
7α
7complex at 303 K, 313 K and 323 K were recorded with a relaxation delay of 8 ms and with 22 different CPMG frequencies of 125, 250, 375, 500, 625, 750 875, 1000, 1125, 1250, 1500, 1750, 2000, 2250, 2500, 2750, 3000, 3250, 3500, 4000, 4500 and 5000 Hz; the experiments at 293 K were recorded with a relaxation delay of 4 ms and with 20 different CPMG fre- quencies of 250, 500, 750, 1000, 1250, 1500, 1750, 2000, 2250, 2500, 2750, 3000, 3250, 3500, 3750, 4000, 4250, 4500, 4750 and 5000 Hz.
The fully extended phase cycle for the
19F CPMG including the aring-sequence (Fig. 2a) is φ1 = [0 0 0 0 0 0 0 0 0 0 0 0 0 0 0 0 2 2 2 2 2 2 2 2 2 2 2 2 2 2 2 2 1 1 1 1 1 1 1 1 1 1 1 1 1 1 1 1 3 3 3 3 3 3 3 3 3 3 3 3 3 3 3 3], φ2 = [1 1 1 1 1 1 1 1 3 3 3 3 3 3 3 3 1 1 1 1 1 1 1 1 3 3 3 3 3 3 3 3 0 0 0 0 0 0 0 0 2 2 2 2 2 2 2 2 0 0 0 0 0 0 0 0 2 2 2 2 2 2 2 2], φ3 = [2 2 2 2 2 2 2 2 2 2 2 2 2 2 2 2 0 0 0 0 0 0 0 0 0 0 0 0 0 0 0 0 3 3 3 3 3 3 3 3 3 3 3 3 3 3 3 3 1 1 1 1 1 1 1 1 1 1 1 1 1 1 1 1], φ4 = [2 0 2 0 2 0 2 0 2 0 2 0 2 0 2 0 0 2 0 2 0 2 0 2 0 2 0 2 0 2 0 2 3 1 3 1 3 1 3 1 3 1 3 1 3 1 3 1 1 3 1 3 1 3 1 3 1 3 1 3 1 3 1 3], φ5 = [0 0 2 2 1 1 3 3 0 0 2 2 1 1 3 3 2 2 0 0 3 3 1 1 2 2 0 0 3 3 1 1 1 1 3 3 2 2 0 0 1 1 3 3 2 2 0 0 3 3 1 1 0 0 2 2 3 3 1 1 0 0 2 2], φ
rec= [0 2 2 0 1 3 3 1 0 2 2 0 1 3 3 1 2 0 0 2 3 1 1 3 2 0 0 2 3 1 1 3 1 3 3 1 2
0 0 2 1 3 3 1 2 0 0 2 3 1 1 3 0 2 2 0 3 1 1 3 0 2 2 0], where [0, 1, 2, 3] corresponds to [x, y, − x, − y].
The R
1ρon-resonance experiments for TmCsp were based on six different spin-lock times T
SL(0, 4, 8, 16, 32 and 48 ms) and 28 different spin lock fields (351.05, 393.88, 441.94, 495.87, 556.37, 624.26, 700.43, 785.9, 881.79, 989.38, 1110.11, 1245.56, 1397.54, 1568.07, 1759.4, 1974.08, 2214.95, 2485.22, 2788.46, 3128.71, 3510.47, 3938.81, 4419.42, 4958.67, 5563.72, 6242.59, 7004.3, 7858.96 Hz). The
19F frequency carrier was centered on the respective peak maximum in the 1D
19F spectrum.
The R
1ρon-resonance experiments for the α
7α
7complex were based on six different spin-lock times T
SL(0, 2, 4, 8, 12 and 16 ms) and 31 different spin lock fields (103.54, 116.17, 130.35, 146.25, 164.10, 184.12, 206.591, 231.80, 260.08, 291.82, 327.42, 367.37, 412.20, 462.50, 518.93, 582.25, 653.29, 733.01, 822.45, 922.80, 1035.40, 1161.74, 1641.00, 2600.81, 3274.23, 4122.01, 5189.30, 5822.49, 6532.94, 7330.08, 8224.49 Hz). The
19F frequency carrier was centered on the respective peak maximum in the 1D
19
F spectrum.
The R
1ρoff-resonance experiments for TmCsp were based on six different spin-lock times T
SL(0, 4, 8, 16, 32 and 48 ms), 71 different offsets frequencies (+ and − 0, 50, 100, 150, 200, 250, 300, 350, 400, 450, 500, 600, 700, 800, 900, 1000, 1100, 1200, 1300, 1400, 1500, 1600, 1700, 1800, 1900, 2000, 2100, 2200, 2300, 2400, 2500, 2600, 2800, 3000, 3200 and 3400 Hz) and 4 different spinlock fields (100, 200, 300 and 400 Hz). The spin-lock is flanked by two
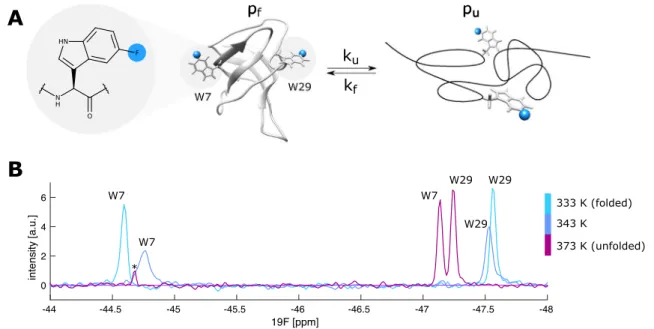
Fig. 1
The folding-unfolding exchange of the TmCsp protein. a The chemical structure of 5-fluoro tryptophan (5FW; left) and a schematic presentation of the (un-) folding of TmCsp, which contains 5FW resi- dues at positions 7 and 29 (Protein Data Bank, PDB ID 1G6P Kremer
et al. 2001). b
19F spectra of TmCsp at 333 K, 343 K and 373 K with
assignments for Trp7 and Trp29. The peak labeled with an asterisk
results from a small impurity in the sample. This impurity resonates
outside the displayed spectral window at the two lower temperatures
hard pulses that transfer the magnetization to the spin-lock angle θ. θ is calculated from the spin-lock power and the spin-lock offset as θ = tan
−1(ω
SL/ΔΩ), after which the length of the θ-hard pulse is calculated from the 90° hard pulse p
hardas pθ = θ/90° * p
hard. The
19F frequency carrier was centered on the Trp7 peak maximum in the 1D
19F spectrum.
All relaxation dispersion datasets were recorded in tripli- cate in order to obtain the indicated error estimates.
Data processing/analysis/fitting
NMR experiments were processed with the NMRpipe soft- ware (Delaglio et al. 1995) and analyzed with in house writ- ten Python and Matlab scripts.
CPMG
Effective transverse relaxation rates were calculated as R
eff2= − ln(I/I
0)/T
CPMG, where I is the peak intensity, I
0is the reference intensity recorded without the CPMG ele- ment and T
CPMGis the constant CPMG time. The CPMG profiles were numerically fitted (Korzhnev et al. 2004) to a two-state model using an in-house Matlab script. The transverse relaxation rates of the folded state and the
unfolded state were assumed to be equal in the absence of exchange (R
2,f= R
2,u).
On‑resonance R
1ρR
1ρrates were extracted from an exponential fit of the resonance intensities in experiments with six different T
SLtimes. R
1ρdata was fitted with an in-house Matlab script using a numerical approach in which R
1ρis approximated as the least negative eigenvalue of the Bloch–McConnell evolution matrix (Trott and Palmer 2002).
Off‑resonance R
1ρR
1ρrates were extracted from an exponential fit of the resonance intensities in experiments with six different T
SLtimes. The off-resonance R
1ρdata was fitted with an in- house Matlab script using the Laguerre approximation as an analytical equation that is valid for off-resonance R
1ρdata (Koss et al. 2017; Miloushev and Palmer 2005).
0 1000 2000 3000 4000 5000 CPMG
/2 [s
-1]
0 20 40 60 80 100 120 140
R
2,eff[s
-1]
0 1000 2000 3000 4000 5000 CPMG
/2 [s
-1]
5 10 15 20 25 30 35 40
R
2,eff[s
-1]
W7 W29
A
B
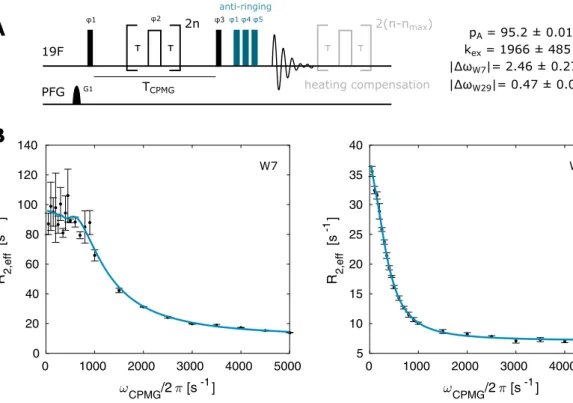
pA = 95.2 ± 0.01 % kex = 1966 ± 485 s-1
|ΔωW7|= 2.46 ± 0.27 ppm
|ΔωW29|= 0.47 ± 0.05 ppm TCPMG
2n
heating compensation 2(n-nmax) 19F
φ1 φ2
τ τ
φ4 φ5 φ1
τ τ
anti-ringing φ3
PFG G1
Fig. 2 19
F CPMG experiment. a Pulse sequence for recording
19F CPMG RD profiles. Narrow (wide) rectangles indicate 90° (180°) pulses, which are applied along the x-axis unless indicated otherwise.
The phase cycle is φ1 = φ
rec= [x, x, − x, − x, y, y, − y, − y], φ2 = [y, − y, y, − y, x, − x, x, − x]. The number of CPMG pulses applied
during the CPMG time T
CPMGis given by 2n, where n is an integer.
The maximum number n
maxis chosen so that the highest applied fre-
quency υ
CPMG= n
max/T
CPMGis at or below 5 kHz. b CPMG relaxation
dispersion profiles for W7 and W29 recorded at 344 K. The size of
the error-bars correspond to 1 standard deviation
Monte Carlo simulations
Standard deviations and mean values of all datapoints were calculated using the experimental triplicates. In order to assess the uncertainties from the fitting, we per- formed a Monte Carlo Simulation with 100 fit iterations, where all data-points were varied in each iteration accord- ing to a Gaussian distribution.
Thermodynamic and kinetic analysis
Solutions for k
ex(= k
F+ k
U) and p
Ffrom the CPMG fits at different temperatures were used to calculate the unfold- ing rate k
U, the folding rate k
Fand the equilibrium con- stant K
eqaccording to
To obtain the thermodynamic parameters, first K
eqwas fit according to
The values obtained for the change in entropy ΔS and in enthalpy ΔH were subsequently used as constraints
in the fit equations
where τ
TPTis the transition path time, ΔS and ΔH are the differences in entropy and enthalpy between the folded and the unfolded state, 𝛥 S
‡F→Uand 𝛥 H
‡F→Uare the entropy and enthalpy differences between the folded state and the tran- sition state and 𝛥 S
‡U→Fand 𝛥 H
‡U→Fare the entropy and enthalpy differences between the unfolded state and the transition state.
(1) p
U= 1 − p
F,
(2) k
U= p
U∙ k
ex,
(3) k
F= p
F∙ k
ex,
(4) K
eq= k
U∕k
F.
(5) K
eq= e
−ΔG∕RT= e
(TΔS−ΔH)∕RT.
(6) ΔS = ΔS
‡F→U+ 𝛥S
‡U→F,
(7) 𝛥 H = 𝛥H
‡F→U+ 𝛥H
‡U→F.
(8) k
U= 1
𝜏
TPTe
(TΔS‡F→U−𝛥H‡F→U)∕RT,
(9) k
F= 1
𝜏
TPTe
(T𝛥S‡U→F−𝛥H‡U→F)∕RT,
Results
Here we introduce a suite of one-dimensional
19F pulse sequences for the collection of CPMG, on-resonance R
1ρand off-resonance R
1ρdata that only require a limited amount of experimental time. We use the cold shock pro- tein from T. maritima (TmCsp) to highlight the applicabil- ity of these sequences to accurately determine exchange parameters in biomolecules. TmCsp is a small (7.5 kDa) thermostable protein that undergoes an unfolding transi- tion with a melting temperature of T
m= 359 K (Schuler et al. 2002a, b). Two
19F probes were introduced into the protein by replacing the two natural tryptophan residues (W7 and W29) with 5-fluoro tryptophan (5FW; Fig. 1a;
Supporting Information). Both the natural and the 5FW- labeled protein follow a two state unfolding transition (Perl et al. 1998; Wassenberg et al. 1999; Schuler et al. 2002a, b), which makes it a well-suited system to establish our
19
F RD experiments.
The
19F NMR spectra of the protein show two sharp resonances at low (333 K) and high (373 K) temperatures corresponding to the fully folded (light blue) and fully unfolded (red) states (Fig. 1b). Based on these spectra, the chemical shift differences between the folded and ther- mally unfolded protein are 2.53 ppm (W7) and 0.33 ppm (W29) respectively. Of note, at temperatures above 373 K the resonances of the unfolded state (red) continue to shift towards lower ppm values. Based on this tempera- ture dependence of the unfolded state chemical shift we can derive that the chemical shift differences at 333 K are 2.35 ppm (W7) and 0.48 ppm (W29). At 343 K (blue) extensive line broadening is observed, which arises from the exchange (k
ex= k
F+ k
U) between the folded (F) and unfolded (U) states of the protein (Fig. 1a).
To quantify this exchange process we first recorded
19F CPMG RD profiles using the pulse sequence displayed in Fig. 2a (Supporting Information). This sequence con- tains two elements that we found to be particularly impor- tant for obtaining high quality data. First, we included a heat compensation block such that the sample is exposed to the same total RF power independent of the CPMG frequency. This is especially important when higher
19
F CPMG frequencies (5 kHz) are used in combina- tion with longer (> 20 ms) CPMG times. Second, when using a probehead where the
1H coil is de-tuned to record
19
F spectra, we found broad baseline artifacts at the on- resonance
19F frequency that are due to suboptimal per- formance of the
1H RF coil for
19F experiments. These imperfections can be suppressed through the use of an
“anti-ring” sequence (Gerothanassis 1987) that consists
of three 90° pulses of different phases in combination
with extensive phase cycling. We then used a sample that
contains 5-fluoroindole in glycerol to show that the CPMG experiment results in flat RD profiles for a system that does not undergo chemical exchange (Fig. S1). Due to the high viscosity, the
19F T
1and T
2times are comparable to the
19F relaxation times in proteins making this a good testing system for biological samples.
Based on the above, we recorded CPMG RD profiles on TmCsp at 11.7 T (500 MHz
1H frequency) and 344 K, which is 15 K below the melting temperature of the protein. In total, we recorded a full dataset with 23 CPMG frequencies in approximately 40 min (64 scans, 1.5 s interscan delay), highlighting the efficiency of the 1D based
19F CPMG method. The
19F signals of the two
19F tryptophan residues show large dispersions, indicative of chemical exchange (Fig. 2b). A global numerical fit (solid line) according to a two-site exchange model (Supporting Information) gives an exchange rate of k
ex= 1966 ± 485 s
−1, populations of p
F= 95.2 ± 0.1%, p
U= 4.8 ± 0.1% and chemical shift differences of |Δω
W7| = 2.46 ± 0.27 ppm and |Δω
W29| = 0.47 ± 0.05 ppm, where the errors in the extracted parameters are standard deviations calculated by Monte Carlo simulations based on three separately recorded datasets (Fig. S2). It is noteworthy that the determined chemical shift differences agree well with the values obtained from 1D spectra recorded at dif- ferent temperatures (2.35 ppm and 0.48 ppm for W7 and W29 respectively; Fig. 1b), especially when considering that only two peaks at a single field strength are used to fit the
exchange parameters. The relatively high accuracy of the extracted parameters can be explained based on the fact, that the values of |Δω| are significantly different for the two resi- dues. The ratio between the kinetic parameter k
ex(1966 s
−1) and the absolute value of |Δω|, which defines the exchange regime, effectively yields an intermediate exchange for W7 (|Δω
W7| = 2.44 ppm = 2π·1170 Hz), but is in fast exchange for W29 (|Δω
W29| = 0.46 ppm = 2π·216 Hz). Our data here show, that the exchange parameters can be reliably extracted from the CPMG dispersions alone. The associated standard deviations in the extracted parameters are nevertheless con- siderable (Fig. S2).
To complement the CPMG RD data and to be able to study systems that exchange on faster timescales we made use of a
19F on-resonance R
1ρpulse sequence (Fig. 3a and Supporting Information). We initially implemented the option to use adiabatic ramps with tanh/tan amplitude/phase modulation for the magnetization transfer to the transverse plane (Mulder et al. 1998). However, we found a transfer with hard pulses more convenient, as it is compatible with lower spin-lock powers, for which the adiabatic condition would otherwise be violated. As for the CPMG RD experi- ment, we observed significant baseline distortions in the spectra that result from acoustic ringing in the
1H/
19F-coil at the
19F resonance frequency. These artifacts could be efficiently eliminated with an anti-ringing element. In addi- tion, the pulse sequence includes a heating compensation for
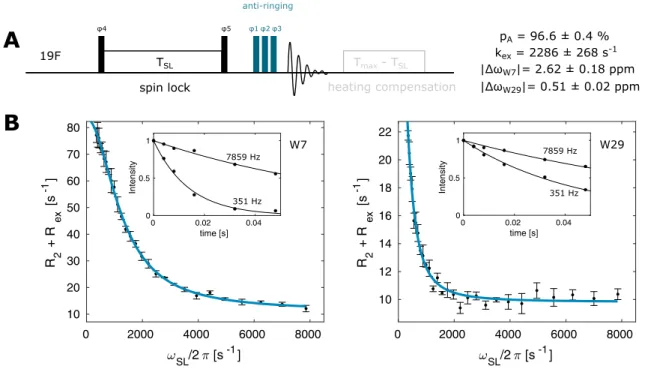
0 2000 4000 6000 8000
SL
/2 [s
-1]
1020 30 40 50 60 70 80
R
2+ R
ex[s
-1]
0 2000 4000 6000 8000
SL
/2 [s
-1]
1012 14 16 18 20 22
R
2+ R
ex[s
-1]
0 0.02 0.04
time [s]
0 0.5 1
Intensity
TSL
φ2 φ3 φ1
19F
anti-ringing φ5
φ4
heating compensation spin lock
Tmax - TSL
A
B
W7 W29
pA = 96.6 ± 0.4 % kex = 2286 ± 268 s-1
|ΔωW7|= 2.62 ± 0.18 ppm
|ΔωW29|= 0.51 ± 0.02 ppm
7859 Hz
351 Hz
0 0.02 0.04
time [s]
0 0.5 1
Intensity
7859 Hz
351 Hz
Fig. 3 19
F on-resonance R
1ρexperiment. a Pulse sequence for the
19
F on-resonance R
1ρexperiment. Narrow (wide) rectangles indicate 90° (180°) pulses, which are applied along the x-axis unless indicated otherwise. The phase cycle is φ1 = x, φ2 = [− x, x], φ3 = [x, x, − x,
− x, y, y, − y, − y], φ4 = [y], φ5 = [− y], φ
rec= [x, − x, − x, x, y, −
y, − y, y]. b On-resonance R
1ρrelaxation dispersion profiles for W7
and W29. The size of the error-bars correspond to 1 standard devia-
tion
different spin-lock times T
SLto ensure a constant RF power.
We recorded separate datasets for W7 and W29 at 11.7 T and 344 K with the carrier frequency placed on-resonance (either at W7 or at W29), each with 28 spin-lock field strengths between 0.35 kHz and 7.9 kHz. Every datapoint corresponds to an R
1ρ= R
2+ R
exvalue that is obtained by fitting of an exponential decay recorded over six time points T
SL. The total experimental time for 1 complete R
1ρdataset (32 scans, 1.5 s interscan delay) is around 2.3 h. To extract a reliable estimate of the error, we recorded three datasets for W7 and three datasets for W29. The data was simultaneously fitted using Trott’s and Palmer’s approach (2002) (solid line) and yields an exchange rate of k
ex= 2286 ± 268 s
−1, popula- tions of p
F= 96.6 ± 0.4%, p
U= 3.4 ± 0.4% and chemical shift differences of |Δω
W7| = 2.62 ± 0.18 ppm and |Δω
W29| = 0.51 ± 0.02 ppm. The extracted parameters agree well with the parameters that we extracted from the RD CPMG experi- ments (Fig. 2b) and with the chemical shift differences that we observe in the 1D NMR spectra (Fig. 1b).
It is noteworthy, that higher spin-lock fields up to 20 kHz have been employed in proton R
1ρexperiments on cryoprobes (Steiner et al. 2016), which accordingly expands the range of dynamics that can be studied with the presented fluorine R
1ρ. On the other end, the lower limit of the spinlock field is dictated by the largest J-cou- plings present in the spin system (Zhao et al. 2014). In 5FW, the
3J
HFcoupling of ~ 9.9 Hz restricts the use of spin-lock to fields below 30 Hz (Zhao et al. 2014). This limitation is eluded by the use of a dual
1H–
19F probe- head where proton-fluor couplings can be decoupled and is also not applicable in fluorine labels where no vici- nal protons are coupled to the
19F spin, as is the case in bromotrifluoroacetone (BTFA; see below). We note that in the CPMG experiment the
3J
HFcoupling leads to the interconversion of
19F in-phase and anti-phase magnetiza- tion during the periods 2τ between the refocusing pulses.
Dependent on the CPMG frequency and on the difference of in-phase and anti-phase transverse relaxation rates, this can result in a distorted RD profile (Kay et al. 1992). This can be overcome by employing explicit relaxation–com- pensation, where in-phase and anti-phase contributions are averaged for all CPMG frequencies (Loria et al.
1999). However, in biological application of
19F NMR this problem is negligible for most practical purposes, as the anti-phase contributions only become relevant, when the periods 2τ between the refocusing pulses become longer than 1/4J. Even in the case of a strong three-bond H–F coupling of 10 Hz, this issue thus only arises for unusually long CPMG times (> 50 ms when 2 refocussing π pulses are used). Finally, it is worth mentioning that we here sampled six points of the exponential decay in order to rule out a non-exponential behavior of the spin-locked
relaxation, that can arise due to inaccurate alignment of the magnetization with the spin lock field. The experi- mental time can be reduced at least by a factor of 3 when only a reference and a single timepoint are measured to determine the exponential decay for each spinlock field (Fig. S7), without a significant change in the values of the extracted parameters.
The CPMG and R
1ρRD experiments only yield the abso- lute value of the chemical shift difference between the two states (|Δω
i|).
19F off-resonance R
1ρexperiments (Fig. 4a and Supporting Information) on the other hand can be used to extract a full set of parameters (p
F, k
ex, R
2,i, Δω
i) from meas- urements at a single B
0field in case of a two-state exchange process (Trott and Palmer 2002; Korzhnev et al. 2005a, b).
In that experiment the effective field, which is defined by the vector sum of the spin-lock field ω
1and the spin-lock offset ω
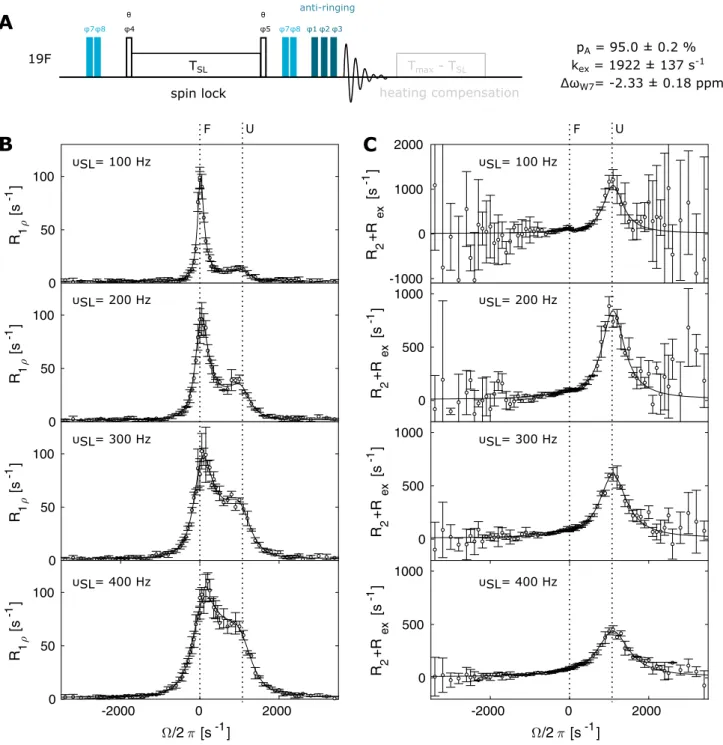
offset, is now inclined by an angle θ. The magnetization is transferred from the ± z axis to an angle θ by hard pulses of the appropriate length, which allows to use very low spin- lock fields. Again, our pulse sequence included a heating compensation for the different spin lock lengths as well as an anti-ringing element. We recorded datasets for W7 at 11.7 T and 344 K at spin-lock fields of 100 Hz, 200 Hz, 300 Hz and 400 Hz and with 71 offsets in each experiment. The total experimental time for this complete dataset (16 scans, inter- scan delay 1.5 s) is 11.5 h. To estimate the error in the data, this dataset was recorded three times. Figure 4b shows the R
1ρdata together with a global fit of all off-resonance data- sets (solid line). A main peak corresponding to the observ- able resonance (F) is centered at zero offset, with a width determined by the spin lock power ω
1. Exchange between the folded and the unfolded state leads to the appearance of a second peak that is centered around the resonance frequency of the excited, unfolded state (U). At 100 and 200 Hz, this peak gives rise to a distinct maximum; at higher spin-lock frequencies the resonances merge, but still add up to a clearly asymmetric profile that is indicative of the exchange process. The contribution of R
2+ R
excan be extracted from the R
1ρdata as R
2+ R
ex= (R
1ρ– R
1* cos
2θ)/sin
2θ (Fig. 4c).
The error in R
2+ R
exrapidly increases with the spin-lock offset, because the contribution is scaled with the inverse of sin
2θ. At the same time, the error at a given offset decreases when increasing the spin lock power, as is readily visible from the data between 100 and 400 Hz power. Based on a global fit of the complete off-resonance dataset, we extract an offset Δω
W7of − 2π·1097 ± 84 Hz = − 2.33 ± 0.18 ppm, a ground state population of p
F= 95.0 ± 0.2% and an exchange constant of k
ex= 1922 ± 137 s
−1, which is close to the values obtained by the CPMG and on-resonance R
1ρRD experi- ments. We also observe that the single datasets at 100 Hz or 200 Hz can be used to obtain accurate exchange parameters.
The 300 Hz data, and certainly the 400 Hz data, on the other
hand fail to give well-defined results (Fig. S4), because a higher spin lock field increasingly overwrites off-resonance effects (Trott and Palmer 2002).
In order to evaluate the consistency between the CPMG, the on-resonance R
1ρand the off-resonance R
1ρexperi- ments, we used a global fit for all datasets (Figs. S5, S6). We 0
50 100
R
1[s
-1]
0 50 100
R
1[s
-1]
0 50 100
R
1[s
-1]
-2000 0 2000
/2 [s
-1] 0
50 100
R
1[s
-1]
-1000 0 1000 2000
R
2+R
ex[s
-1]
0 500 1000
R
2+R
ex[s
-1]
0 500 1000
R
2+R
ex[s
-1]
-2000 0 2000
/2 [s
-1] 0
500 1000
R
2+R
ex[s
-1]
υSL= 100 Hz
υSL= 200 Hz
υSL= 300 Hz
υSL= 400 Hz
C
TSL
φ2 φ3 φ1
19F
anti-ringing θ
θ
φ5 φ4
φ7φ8 φ7φ8
heating compensation Tmax - TSL
spin lock
A
B
υSL= 100 HzυSL= 200 Hz
υSL= 300 Hz
υSL= 400 Hz
pA = 95.0 ± 0.2 % kex = 1922 ± 137 s-1 ΔωW7= -2.33 ± 0.18 ppm
F U
F U
Fig. 4 19
F off-resonance R
1ρexperiment. a Pulse sequence for the
19F off-resonance R
1ρexperiment. Narrow rectangles indicate 90° pulses.
The phase cycle is φ1 = x, φ2 = [− x, − x, x, x], φ3 = [x, x, x, x, − x, − x, − x, − x, y, y, y, y, − y, − y, − y, − y], φ4 = [y, − y], φ5 = [− y, y], φ6 = [x, − x], φ7 = [x], φ8 = [x, − x], φ
rec= [x, − x, − x, x, y, − y, − y, y]. The flip-angle of pulses that flank the spinlock block is θ, which ensures that the magnetization is aligned at the angle of the effective magnetic field. This angle depends on the offset and the spinlock power. The pulse pairs with phases φ7/φ8 are used to cycle
the magnetization to ± z before the spin lock period and back to + z
after the spin lock, which ensures that the rotating frame relaxation is
symmetrically measured both above and below the transverse plane
at all offsets. b R
1ρoff-resonance relaxation dispersion profiles and
c corresponding R2+ R
excontributions for W7 at spin-lock fields of
100 Hz, 200 Hz, 300 Hz and 400 Hz. Solid lines show the best fit to
a two-state Laguerre approximation. The offsets of the folded (F) and
the unfolded (U) state are indicated with dotted lines. Error bars show
experimental uncertainty (1 standard deviation)
expect that a global fit yields the most precise parameters, because the three experiments contain redundant informa- tion about the protein folding/unfolding transition. In the fit, we optimized the following parameters: k
ex, Δω
W7, Δω
W29, p
Fand R
2. Because we observed small deviations on the order of 2 Hz in the R
2values from the CPMG and the R
1ρexperiments we introduced two independent R
2variables:
R
2CPMGand R
2R1ρ. Based on that, we obtained a ground state population of p
F= 94.8 ± 0.1%, an exchange constant of k
ex= 1737 ± 54 s
−1, and chemical shift differences of Δω
W7= 2π·1086 ± 66 Hz = −2.31 ± 0.14 ppm, |Δω
W29| = 2π·202 ± 5 Hz = 0.43 ± 0.01 ppm. These parameters are in agreement with the individually fitted datasets, but have a significantly increased precision (Fig. S5).
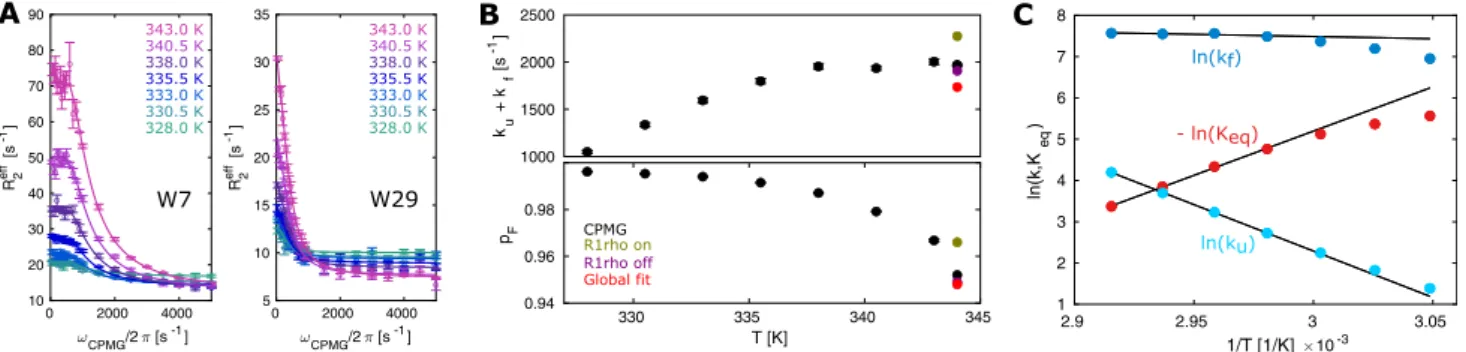
Temperature dependent RD measurements are well suited to extract thermodynamic parameters of chemical exchange processes (Mulder et al. 2001; Nikolova et al. 2011; Audin et al. 2013). Here, we measured
19F CPMG RD profiles at seven different temperatures between 328 and 343 K and determined the unfolding and folding rates (k
U, k
F) as well as equilibrium constants K
eq= k
U/k
F(Fig. 5; Supporting Infor- mation). The temperature-profile of K
eqbetween 335.5 and 343 K was subsequently fit to an Arrhenius model for Gibbs free energy ΔG = ΔH − TΔS = − RT ln K
eq, from which we obtain ΔH = 43.9 ± 1.0 kcal/mol and TΔS = 40.6 ± 1.0 kcal/
mol at 343 K, indicating an entropy–enthalpy compensation during TmCsp unfolding. Similarly, transition state theory can be used to obtain estimates of the enthalpic and entropic contributions to the energy barrier that separates the folded and the unfolded state. Because the traditional pre-exponen- tial factor k
BT/h in the Eyring equation is on the timescale of covalent bond vibrations and hence a suboptimal esti- mate for large-scale biomolecular dynamics (Moore 2012;
Vallurupalli et al. 2016), we chose to estimate it as 1/τ
TPT, where τ
TPTis the transition path time. Based on MD simula- tions and single-molecule fluorescence studies that show that
τ
TPTis similar even for proteins with vastly different fold- ing rates (Shaw et al. 2010; Chung et al. 2012; Vallurupalli et al. 2016), we assumed τ
TPTto be 1 µs and obtained values of ΔH
‡= 45.8 ± 1.2 kcal/mol and TΔS
‡= 39.2 ± 1.2 kcal/
mol at 343 K. We note that the value of the transition path time hardly effects the enthalpy of the transition state, but the entropic contribution is dependent on it and varies from 37.7 ± 1.1 kcal/mol for τ
TPT= 0.1 µs to 40.9 ± 1.3 kcal/mol for τ
TPT= 10 µs.
Based on these findings a higher temperature stabilizes the unfolded state (p
U=1 − p
F; Fig. 5b, lower panel; Fig. 5c, red curve; ΔG
F→Udecreases from 3.29 to 2.32 kcal/mol between 335.5 and 343 K) due to an entropic benefit. Like- wise, but to a slightly lesser extent, a higher temperature reduces the free energy of the transition state. As a result, an increase in temperature results in a decreased energy barrier for the unfolding reaction (ΔG
‡F→Udecreases from 9.07 to 8.19 kcal/mol between 335.5 and 343 K), while the energy barrier for folding is slightly increased, (ΔG
‡U→Fchanges from 5.78 to 5.87 kcal/mol between 335.5 and 343 K). This leads to the counterintuitive situation where the exchange rate (k
ex= k
F+ k
U= exp(− ΔG/RT) that is dominated by k
F) remains nearly constant with temperature (Fig. 5b, top panel), because ΔG
‡U→Fand T increase at approximately the same pace.
For high molecular weight systems, the R
2relaxation rates will be significantly higher than the rates that we observed for TmCsp. In those cases, the CPMG relaxation time has to be shortened to such an extent, that the lower relaxation dispersion frequencies can no longer be sampled, which will hamper the faithful examination of dynamics. This limitation can be resolved with R
1ρexperiments that are able to sample arbitrary frequencies between a lower limit given by scalar couplings and an upper limit given by the probe head power limits. To illustrate this we applied
19F RD experiments to a 360 kDa double heptameric α
7α
7complex (half proteasome)
0 2000 4000
10 20 30 40 50 60 70 80 90
R2eff[s-1]
0 2000 4000
5 10 15 20 25 30 35
R2eff[s-1]
2.9 2.95 3 3.05
1/T [1/K] 10-3 1
2 3 4 5 6 7 8
ln(k,Keq)
ln(kf)
ln(ku) - ln(Keq)
A
1000 1500 2000 2500
ku+ kf[s-1]
330 335 340 345
T [K]
0.94 0.96 0.98
pF CPMG
R1rho on R1rho off Global fit
343.0 K
B C
340.5 K 338.0 K 335.5 K 333.0 K 330.5 K 328.0 K
343.0 K 340.5 K 338.0 K 335.5 K 333.0 K 330.5 K 328.0 K
W7 W29
CPMG/2 [s-1] CPMG/2 [s-1]
Fig. 5
Kinetic and thermodynamic analysis of the TmCsp folding. a CPMG curves with a global fit, assuming a constant chemical shift difference between the folded and the unfolded state across all tem- peratures. b Temperature dependence of exchange rates and popula- tions from 328 to 343 K. For comparison, the results from the experi-
ments at 344 K are included. c Temperature dependence of k
u, k
fand
K
eqof 5FW-labeled TmCsp from 328 to 343 K. Note that only the
data between 335.5 and 343 K was used to extract the thermody-
namic parameters
derived from the α
7β
7β
7α
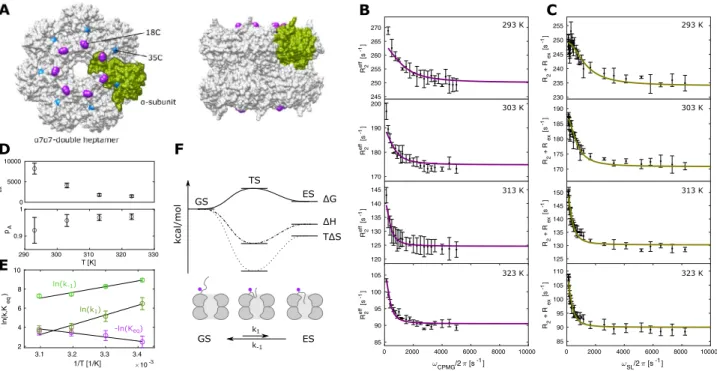
720S proteasome of T. acidophilum (Fig. 6). The seven N-termini in each of the two α-rings have been shown to sample conformations in- and outside of the ring pore, thereby forming a functionally important dynamic gate (Sprangers and Kay 2007; Religa et al. 2010). We intro- duced single cysteine mutations at positions 18 and 35 of the α-subunit and labeled the purified half proteasome with BTFA to introduce a site specific
19F probe. The sample with a cysteine at position 35, that is remote from the pore, showed a modest relaxation rate of 122 Hz and a flat CPMG curve (Fig.
S8). However, for the 18C-sample, we found that the single fluorine resonance at − 84 ppm shows strongly temperature dependent peak widths between 161 Hz (293 K) and 88 Hz (323 K). To monitor the gate dynamics, we collected CPMG (Fig. 6b) and R
1ρ(Fig. 6c) datasets at 293 K, 303 K, 313 K and 323 K. The constant time in the CPMG experiment had to be restricted to 4 ms at 293 K which results in CPMG frequencies that are multiples of 250 Hz. In the rotating frame relaxation experiments, on the other hand, we recorded 8 different R
1ρrates below 250 Hz, which provides essential information on the exchange process. Of note, the trifluoroacetone moiety lacks vicinal protons that couple to the
19F spins and the larg- est scalar coupling present is a
4J
FHcoupling of around 1 Hz (Abraham et al. 1996) which eliminates the lower bound for the sampling of the frequencies. To extract exchange parameters,
we simultaneously fitted the CPMG and R
1ρdata at all temper- atures with a two-state model, assuming that the Δω between the ground state and the excited state is independent of the experimental temperature. Based on that, we unexpectedly observe that higher temperatures result in significantly slower exchange rates and increased populations of the ground state (Fig. 6d). In line with this, an Eyring plot of the rate constants k
1and k
−1shows a linear decrease in ln(k) for both constants (Fig. 6e). These results arise from a negative entropy of the excited state (TΔS = − 10.1 ± 3.0 kcal/mol at 313 K) as well as the transition state (TΔS
‡= − 26.1 ± 4.8 kcal/mol at 313 K), which makes the excited state unfavorable at higher tempera- tures (Fig. 6f). Structurally, this behavior can be explained by a model where the N-terminal extensions are flexible in the open ground state and motionally restricted in the excited state where this region of the protein is located within the annulus pore (Fig. 6f).
Discussion and conclusions
Taken together, we here present a suite of one-dimen- sional
19F RD experiments, to study exchange processes in
19F-labeled proteins. The on-resonance and off-reso- nance R
1ρpulse sequences provide a number of important
3.1 3.2 3.3 3.4
1/T [1/K] 10-3 2
4 6 8 10
ln(k,Keq)
245 250 255 260 265 270
R2eff[s-1]
170 180 190 200
R2eff[s-1]
120 125 130 135 140 145
R2eff[s-1]
0 2000 4000 6000 8000 10000
85 90 95 100 105
R2eff[s-1]
ln(k-1) 0
5000 10000
kex[s-1]
290 300 310 320 330
T [K]
0.9 1 pA
ln(k1) -ln(Keq)
C B
A
293 K
230 235 240 245 250 255
R2+ Rex[s-1]
170 175 180 185 190
R2+ Rex[s-1]
125 130 135 140 145 150
R2+ Rex[s-1]
0 2000 4000 6000 8000 10000
85 90 95 100 105 110
R2+ Rex[s-1]
303 K
313 K
323 K
293 K
303 K
313 K
323 K
D
α7α7 double heptamerE
ΔG TΔS ΔH
kcal/mol
k-1 k1
F
GS TS
ES
GS ES
CPMG/2 [s-1] SL/2 [s-1]
Fig. 6 19
F Relaxation dispersion experiments of the 360 kDa α
7α
7double heptamer. a Model of the double heptameric α
7α
7complexes with 14 BTFA labeling sites at position 18C (purple) of each subu- nit. Position 35 that does not show exchange (Fig. S8) is indicated in cyan. The model of the complex is based on the structure of the 20S proteasome from T. acidophilum (PDB ID 1PMA). b CPMG experi-
ments from 293 to 323 K. c On-resonance R
1ρexperiments from 293
to 323 K. d Plot of exchange rates against temperatures as derived
from the global fit of all RD data. e Logarithmic plot of kinetic rates
against inverse temperature. f Schematic presentation of ΔG, ΔH and
TΔS changes from the ground state GS to the excited state ES via a
transition state TS
advantages over the complementary CPMG RD experi- ments. First, the rotating frame experiments can make use of very low spin lock fields, opening the possibility to obtain a full set of parameters at a single static mag- netic field. The ability to sample arbitrary frequencies also allows study cases where the
19F signals experience fast relaxation and where CPMG experiments are restricted to higher frequencies due to the requirement for very short (2–3 ms) CPMG times (Manglik et al. 2015). In that light, it is also worth mentioning that short R
1ρsequences could be combined with recently introduced two-dimensional (2D)
19F–
13C TROSY experiments, where destructive interferences between DD and CSA mechanisms in aro- matic
19F–
13C groups result in improved
13C line widths (Boeszoermenyi et al. 2019). Second, compared to CPMG RD experiments, the rotating frame approaches can expand the timescale of chemical exchange that is accessible to very fast (µs timescale) processes. Third, the off-resonance R
1ρexperiments provide important information on the sign of the chemical shift differences, which provides direct information on the nature of the excited state.
We anticipate that fluorine NMR methods will become increasingly popular. Indeed, studies in the recent years have shown first examples of its applicability to challeng- ing systems including GPCRs, where the possibilities for protein deuteration and methyl group labeling are limited due to the requirements of eukaryotic expression systems.
Proteins from these sources can, however, be labeled with trifluoromethyl groups in a straightforward posttranscrip- tional manner at very low costs. The very short experi- mental times of the
19F based 1D experiments will further increase the applicability to systems that are not stable over time and where time intensive
13C,
15N or
1H based RD are not feasible. In the case of the TmCsp, the use of
19
F RD approaches was motivated by enhanced amide-pro- ton exchange rates at our experimental conditions, which resulted in very low quality
1H–
15N based experiments.
In general,
19F based experiment can thus be expected to outperform more traditional measurements at the elevated temperatures or at a higher pH. Finally, recent advances in labeling techniques have made RNA and DNA acces- sible for
19F NMR (Sochor et al. 2016; Nußbaumer et al.
2020; Baranowski et al. 2020), thereby further expanding the applicability of the presented methodologies. In sum- mary, our approach will strengthen the use of
19F NMR to accurately quantify dynamic processes in a broad range of biological systems. This applicability of this strategy will benefit from the
19F capabilities of many modern NMR probe-heads.
Acknowledgements
We thank Johanna Stöfl for excellent technical assistance and members of the group for discussions. We would also like to thank Ruth Gschwind and Verena Streitferdt for access and
support at the TBI-F-equipped 600 MHz spectrometer and Katja Pet- zold for advice related to adiabatic ramps. This work was supported by the Deutsche Forschungsgemeinschaft (SFB 960 TP/B12).
Funding
Open Access funding enabled and organized by Projekt DEAL.
Open Access