Year 9 Chemistry – Worksheet 13
3.2 Energy in chemical reactions
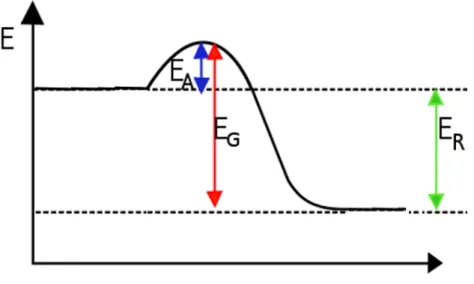
The energy change in chemical reactions is usually shown in an energy diagram. This diagram displays the energy contained in the reacting compounds as the y-axis. The x-axis is the reaction coordinate which represents the progress of the reaction from the initial reactants to the final products.
The activation energy EA is a property of all chemical reactions: For a reaction to start a certain amount of energy has to be added in. For some reactions the heat energy of room temperature alone will suffice, in other we have to add energy (most often in form of heat) for them to start. (Example:
Striking a match) The more activation energy is needed, the slower a reaction will be.
Task: Add a labeled energy diagram for an endothermic reaction.
Figure 1: Energy diagram for an exothermic reaction (Example: Synthesis of iron sulfide)
Figure 2: Energy diagram for an endothermic reaction (Example: Decomposition of iodine pentoxide)
Year 9 Chemistry – Worksheet 13
Catalysts
Practical: Catalytic properties of manganese dioxide and yeast
Hydrogen peroxide is an unstable compound that (very) slowly decomposes to water and oxygen. At room temperature it is a clear liquid.
Word equation: Hydrogen peroxide Water + Oxygen ΔE<0 Material:
- A spatula - 3% Hydrogen peroxide solution in water
[Caution! Corrosive!]
- Two test tubes in a stand - Manganese dioxide - A Bunsen burner and matches - Dry yeast
- A wooden splint - A pipette
M
a) A spatula is used to place a small amount of yeast in a test tube, a bit of manganese dioxide is placed in a second test tube.
b) The pipette is used to place 1 ml of hydrogen peroxide [use the markings on the pipette]
solution in each of the test tubes. Test the bottom of the test tube for temperature.
c) After a while a second ml of hydrogen peroxide solution is added to the test tubes.
d) Test both test tubes for oxygen.
e) Heat the liquid in both test tubes to boil.
f) Add a third ml of hydrogen peroxide solution to the test tubes.
O
__________________________________________________________________________________
__________________________________________________________________________________
__________________________________________________________________________________
__________________________________________________________________________________
__________________________________________________________________________________
__________________________________________________________________________________
C
a) Use your observations to confirm the word equation given above is valid for the reaction in presence of yeast or manganese dioxide.
b) Confirm the reaction energy given in the word equation using your observations.
c) Yeast and manganese dioxide are not part of the word equation for the reaction happening in the test tube. Use your findings to explain.