AUS DEM LEHRSTUHL FÜR
MUND-, KIEFER- und GESICHTSCHIRURGIE Prof. Dr. Dr. Torsten E. Reichert
DER FAKULTÄT FÜR MEDIZIN DER UNIVERSITÄT REGENSBURG
THE INFLUENCE OF SUBSTRATE STIFFNESS ON THE OSTEOGENIC DIFFERENTIATION OF STEM-AND PROGENITOR CELLS FROM DENTAL TISSUE
Inaugural – Dissertation zur Erlangung des Doktorgrades
der Zahnmedizin
der
Fakultät für Medizin der Universität Regensburg
vorgelegt von Esthera Prateeptongkum
2014
Dekan: Prof. Dr. Dr. Torsten E. Reichert 1. Berichterstatter: PD Dr. rer. nat. Christian Morsczeck 2. Berichterstatter: Prof. Dr. Lukas Prantl
Tag der mündlichen Prüfung: 11.03.15
Abstract
The influence of substrate stiffness on the osteogenic differentiation of stem-and progenitor cells from dental tissue
This thesis is mainly concerned with the influence of substrate stiffness on periodontal ligament stem cells (PDLSCs) and stem cells from the apical papilla (SCAPs). PDLSCs and SCAPs are stem cells from dental tissues which are known to be a valuable source for regenerative procedures. The substrate stiffness is an important factor to promote the differentiation of stem cells to specific cell lineage. For example, stiff substrate induces the osteogenic differentiation of mesenchymal stem cells (MSCs) and stem cells from human exfoliated deciduous teeth (SHED), while soft matrix promoted the differentiation of dental follicle cells (DFCs) into the osteogenic lineage. In this study, PDLSCs and SCAPs were characterized in terms of stem cell properties. The characterization of PDLSCs and SCAPs which were obtained from different isolation methods and donors were comparable. However, the strongest mineralization was observed in PDLSCs and SCAPs which were isolated from the same tooth.
Subsequently, polyacrylamide (PA) substrates with 3 different stiffness; stiff, medium and soft, were used to determine the influence of matrix stiffnesses on PDLSCs and SCAPs. Here, the matrix stiffness could not promote the osteogenic differentiation of PDLSCs and SCAPs. However, soft substrate tended to induce PDLSCs, while stiff substrate tended to promote SCAPs into osteogenic lineage, which is similar to DFCs and SHED respectively. Interestingly, soft matrix induced both PDLSCs and SCAPs into adipocytes, which is similar to MSCs.
Diese Doktorarbeit beschäftigt sich vor allem mit dem Einfluss der Substratsteifigkeit auf Parodontalligament-Stammzellen (PDLSCs) und Stammzellen aus der apikalen Papille (SCAPs). PDLSCs und SCAPs sind Stammzellen aus Zahngewebe, die dafür bekannt sind, eine wertvolle Quelle für regenerative Verfahren zu sein. Die Substratsteifigkeit ist ein wichtiger Faktor, um die Differenzierung von Stammzellen zu spezifischen Zelllinien zu fördern. Steifes Substrat induziert zum Beispiel die osteogene Differenzierung von mesenchymalen Stammzellen (MSCs) und Stammzellen aus der Pulpa von Milchzähnen (SHED), während die weiche Matrix die osteogene Differenzierung dentaler Follikelzellen (DFCs) fördert. In dieser Studie wurden PDLSCs und SCAPs hinsichtlich der Stammzelleigenschaften untersucht. Die Charakterisierung der PDLSCs und SCAPs, die aus verschiedenen Isolationsmethoden und Spendern stammen, waren vergleichbar. Jedoch wurde die stärkste Mineralisierung in PDLSCs und SCAPs die aus dem gleichen Zahn stammen beobachtet. Anschließend wurden Polyacrylamid (PA) Substrate mit 3 verschiedenen Steifigkeiten, steif, mittel und weich, verwendet, um den Einfluss der Matrix-Steifigkeit auf PDLSCs und SCAPs zu bestimmen. Hier konnte die Matrix-Steifigkeit die osteogene Differenzierung von
PDLSCs und SCAPs nicht fördern. Tendenziell jedoch haben ein weicher Untergrund bei PDLSCs und ein steifer Untergrund bei SCAPs die osteogene Richtung gefördert, ähnlich wie bei DFCs beziehungsweise SHED. Interessanterweise und ähnlich wie bei MSCs hat eine weiche Matrix sowohl bei PDLSCs als auch bei SCAPs die Differenzierung in Adipozyten gefördert.
Contents
1. Introduction 1
1.1 Tooth development 1
1.2 Dental stem cell isolation method 2
1.3 Tooth tissue-derived stem cell 4
1.3.1 Dental pulp stem cells (DPSCs) 4 1.3.2 Periodontal ligament stem cells (PDLSCs) 5 1.3.3 Stem cells from apical papilla (SCAPs) 5 1.3.4 Dental follicle stem cells (DFSCs) 6 1.4 Tissue engineering 6 1.5 Factors influence the fate of stem cells 8 1.5.1 Soluble factor directs stem cell fate 8 1.5.2 Mechanical and physical factors direct stem cell fate 9
1.5.2.1 Mechanical force controls the gene expression of MSCs 9 1.5.2.2 Topography influences MSC fate 10
1.5.2.3 Stiffness substrate directs MSCs fate specification 10
1.5.2.4 Influences of stiffness substrate on dental stem cells 13
1.6 Objective of the study 14
2. Materials and Methods 15
2.1 Materials 15
2.2 Methods 24
2.2.1 Cell culture 24
2.2.2 Flow cytometry 25
2.2.3 Preparation of Polyacrylamide Substrate 26
2.2.4 Cell attachment and proliferation 27
2.2.5 Colony-Forming Efficiency 27
2.2.6 Differentiation protocol 28
2.2.7 Mineralization measurement 28
2.2.8 Alkaline phosphatase (ALP) activity measurement 29
2.2.9 Adipogenic differentiation 30
2.2.10 Quantitative reverse transcription-polymerase chain reaction (qRT-PCR) 31
2.2.11 Statistical analysis 32
3. Results 33
3.1 Phenotype characterization of PDLSCs and SCAPs 33
3.2 Osteogenic differentiation of PDLSCs and SCAPs 36
3.3 Adipogenic differentiation of PDLSCs and SCAPs 40
3.4 Substrate characterization 42
3.5 PDLSCs and SCAPs on polyacrylamide (PA) substrates 42
3.6 Effect of substrate stiffness on the ALP activity of PDLSCs and SCAPs 43
3.7 Effect of substrate stiffness on the osteoblast-related-gene expressions of PDLSCs 45
and SCAPs 3.8 Effect of substrate stiffness on the adipogenic differentiation of PDLSCs and SCAPs 48
4. Discussion 51
4.1 Characterization of PDLSCs and SCAPs 51
4.2 Osteogenic differentiation potential of PDLSCs and SCAPs 52
4.3 Adipogenic differentiation potential of PDLSCs and SCAPs 53
4.4 PDLSCs and SCAPs selection for the experiment with PA substrate 53
4.5 PA substrate fabrication 54
4.6 PDLSCs and SCAPs attachment and proliferation on PA substrate 55
4.7 Osteogenic differentiation of PDLSCs and SCAPs on PA substrate 56
4.8 Adipogenic differentiation of PDLSCs and SCAPs on PA substrate 58
4.9 Conclusion 58
5. References 60
Supplementary data 74
Introduction
Page | 1
1. Introduction
Tooth loss or the onset of oral health problems, including periodontal disease, dental caries, traumatic injury, etc., causes physical and mental suffering such as mastication, occlusion, esthetic and associated general health issues that compromise an individual’s self-esteem and quality of life (1-4). A tooth is a complex biological organ that arises from the tooth germ under the sequential reciprocal interactions between oral epithelial cells (ectoderm) and cranial neural crest derived mesenchymal cells (5-8), as well as consisting of distinctive hard tissues including enamel, dentin and cementum (9-10). The soft connective tissues, including pulp and periodontal ligament (PDL) that contain blood vessels and nerve fibers, are also the component of vital pulp for maintaining the homeostasis of a tooth. Therefore, a tooth has a three dimensional multicellular structure which forms the functional cooperation with the maxillofacial region (9-10).
1.1 Tooth development
Embryologically, teeth are ectodermal organs regulated by the reciprocal interaction of epithelial and mesenchymal cells that is a principal development mechanism related to stem cells, signaling molecules and the transcription factor pathway. Tooth forming fields are specified through the expression of homoeobox genes such as Msx1, Msx2, Barx1 and Lhx8 and secretory molecules including fibroblast growth factors (FGFs) and bone morphogenetic proteins (BMPs) during the development of craniofacial in mice (5,11-13). The invagination of oral epithelium into the mesenchymal region occurs between embryonic day (ED) 11-12 and then the tooth bud is formed by the aggregation of cranial neural crest derived mesenchymal cells. Between ED 13-15, an enamel knot, which is a transient epithelial signaling center that expresses several signaling molecules including Wnt 10b, Shh, FGFs and BMPs, is thought to be the regulation of epithelial- mesenchymal and individual cell fate interactions. The epithelial and mesenchymal cells in the tooth germ finally differentiate into the precursors of the specialized tooth cells such as
Introduction
Page | 2 ameloblasts, odontoblasts and dental follicle cells between ED 16.5-18.5 (14-15). These progenitor cells coordinate enamel deposition and produce dentin matrix at the boundary surface between the epithelium and the mesenchyme (14). Simultaneously, dental follicle cells differentiate into periodontal tissues, including periodontal ligament (PDL), cementum, and alveolar bone (16). Teeth continue to develop postnatally, tooth elongation is followed by tooth crown formation and then the mature teeth erupt into the oral cavity. It is believed that various immature cells remain as adult tissue stem cells, which can act as a self-repairing system for injured dental tissue (17).
1.2 Dental stem cell isolation method
To obtain the cells from dental tissues, two main methods were used to isolate cells;
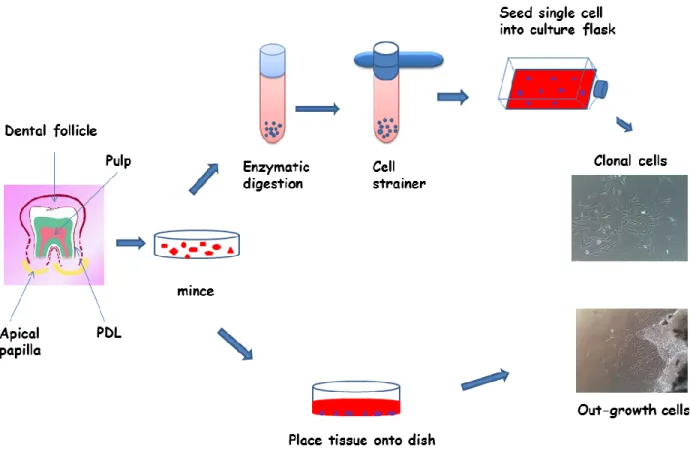
outgrowth and single cell isolation methods, which previously named the cells as progenitor and stem cell, respectively (18-22). Regarding the outgrowth method, the fragments were placed into the culture dishes, after the dental tissues had been separated from a tooth and minced into small pieces. Afterwards, the progenitor cells migrated from the tissue fragments and attached themselves on the surface of the culture dishes. The single cell isolation method was first documented by Friedenstein, with the presence of nonhematopoietic cells that were able to autorenovate and differentiate in the bone marrow (20). Subsequently, bone-marrow-derived cells which were isolated following Friedenstein’s technique, also demonstrated the high capacity of proliferation and differentiation into mesenchymal cells. Therefore, the term “mesenchymal stem cell” (MSC) was used by Caplan to describe them (23). For stem cells from dental tissues, Gronthos et al. were the first group of people to isolate stem cells from human dental pulp by using a single cell isolation method (24). In short, the small pieces of dental tissues were digested with a digestive enzyme and passed through a 70 µm strainer. Single cells were then seeded into
Introduction
Page | 3 culture dishes containing a culture medium. After a period of time, a single cell formed a colony cluster (Figure A).
Figure A. Isolation methods of human tooth-tissue derived stem cells
Feng et al. investigated the differences of stem cell properties between periodontal ligament progenitor cells (PDLPs) and periodontal ligament stem cells (PDLSCs) which were isolated using a different method. They found that PDLPs demonstrated stem cell properties, including MSC surface molecule expression, a high proliferation rate, multipotential differentiation, and the regeneration of cementum-collagen-Sharpey’s fiber in vivo. However, PDLPs expressed MSC markers STRO-1, CD146 and SSEA4 lower than PDLSCs. Moreover, the osteogenic and adipogenic differentiation capacities and the expression level of scleraxis (SCX) of
Introduction
Page | 4 PDLPs were weaker than PDLSCs. PDLPs had a significantly higher cell mobility in the culture dishes than PDLSCs. According to the data, Feng suggested that PDLPs were a progenitor cell population that was able to express stem cell markers and be used for periodontal tissue regeneration in vivo (19).
1.3 Tooth tissue-derived stem cell
Currently, the studies of stem/progenitor cells were encouraged by the advances in techniques related to stem cells characterization at molecular levels. These have provided new insights for our understanding of tooth tissue-derived stem cells, which can be obtained from different parts of the teeth (22,25-27). These include cells from the pulp of both adult and exfoliated deciduous teeth, from the periodontal ligament that connects the tooth root with the alveolar bone, from the dental follicle that surrounds the unerupted tooth and from the apical of the developing root. All these stem cells have the properties of mesenchymal stem cells including the marker gene expression and differentiation into mesenchymal cell lineages such as osteoblasts, chondrocytes and adipocytes. However, differences regarding their proliferation rate in culture, the expression of marker genes and cell differentiation could be detected (22,24,28-31). These differences can be put down to tissue origin, function or culture conditions. However, it remains unclear.
1.3.1 Dental pulp stem cells (DPSCs)
Dental pulp stem cells (DPSCs) were the first dental stem cells isolated from the dental pulp tissue of a human permanent third molar which develops from the dental papillae and consists of odontoblasts, fibroblasts, blood vessels and peripheral nerves. DPSCs demonstrated similar characteristics to bone marrow stromal cells (BMSCs), such as plastic adherence and colony-forming cells (24). Stem cells from human exfoliated deciduous teeth (SHED) were isolated from the pulp of exfoliated deciduous (children’s milk) teeth. SHED could also display
Introduction
Page | 5 the adherence to plastic, fibroblast-like cells and neural-like stem cells (31). Both DPSCs and SHED express stem cell markers CD146 and STRO-1. They were suggested to be dental stem cells with high proliferation and multipotential of differentiation into odontoblasts, osteoblasts, adipocytes and neural cells. Thus, these stem cells would be a good resource for stem cell mediated dentin-pulp complex regeneration (24,31-34).
1.3.2 Periodontal ligament stem cells (PDLSCs)
Periodontal ligament (PDL), a specialized connective tissue, is developed from dental follicle tissue during tooth formation in tooth development, and establishes a biological connection between the cementum of the tooth root and the alveolar bone (16,35-36). PDL-derived stem cells could also be isolated from adult human PDL and cultured in vitro as stem cells. Recently, several studies have demonstrated that PDLSCs were able to differentiate into all of the periodontal cell types after transplantation in vivo, and were able to generate cementum and the PDL complex structure in vivo transplantation into an immunocompromised animal (28). The periodontal ligament is under constant strain from the mastication forces. Therefore, PDL cell numbers are assumed to be maintained by PDLSCs. This could explain why they are better than other dental stem cells at forming a PDL-like structure (37).
1.3.3 Stem cells from apical papilla (SCAPs)
Stem cells from the root apical papilla (SCAPs) are isolated from dental papilla located apically to the developing pulp. So, SCAPs can only be obtained during a period of tooth development. SCAPs demonstrated higher rates of proliferation than DPSCs in vitro culture and had the capability to differentiate into odontoblasts and adipocytes (29). Interestingly, the study of Sonoyama et al. showed that dentin and periodontal ligament were formed after co-transplanting SCAPs (to form a root) and PDLSCs (to form a periodontal ligament) into tooth sockets of pigs.
These findings suggested that a combination of SCAPs and PDLSCs could be used to create a
Introduction
Page | 6 biological root which is similar to the principle of a metal implant. Therefore, the apical papilla, an embryonic-like tissue with a very active source of stem cells, is considered to be a valuable source of stem cells for tissue engineering (29).
1.3.4 Dental follicle stem cells (DFSCs)
The dental follicle is an ectomesenchyme-derived connective tissue sac surrounding the tooth crown and the dental papilla of the developing tooth germ before eruption (38). It is believed that this tissue contains progenitor cells for cementoblasts, PDL, and osteoblasts. During the tooth development stage, dental follicle cells (DFCs) differentiate into PDL fibroblasts which secrete collagen and interact on the surface of root cementum and alveolar bone with PDL fibers (39,40).
Dental follicle stem cells (DFSCs) isolated from the first molars of the neo-natal rat were first identified as mesenchymal stem/progenitors cells (41). Human DFSCs can also be easily isolated after surgical removal of impacted third molars. Similar to BMSCs, DFSCs are plastic adherent and colony forming cells. In addition, DFSCs have shown the ability of differentiation into osteoblasts, cementoblasts, adipocytes and neural cells (22,42). Therefore, these cells are thought to be good candidate cell types for periodontal tissue regeneration.
1.4 Tissue engineering
Tissue engineering is an interdisciplinary field that is expected to have a marked impact in the field of healthcare. Tissue engineers are working on developing new approaches to encourage tissue growth or repair that are founded on the basic science of organ development and wound healing. The loss of tissue or loss of an organ, as well as damaged tissue or a damaged organ is one of the most frequent, devastating, and costly problems in human health care. A new field, tissue engineering, applies the principles of biology and engineering to develop the functional substitutes for damaged tissue (43-44). Recently, the production of synthetic implantable devices,
Introduction
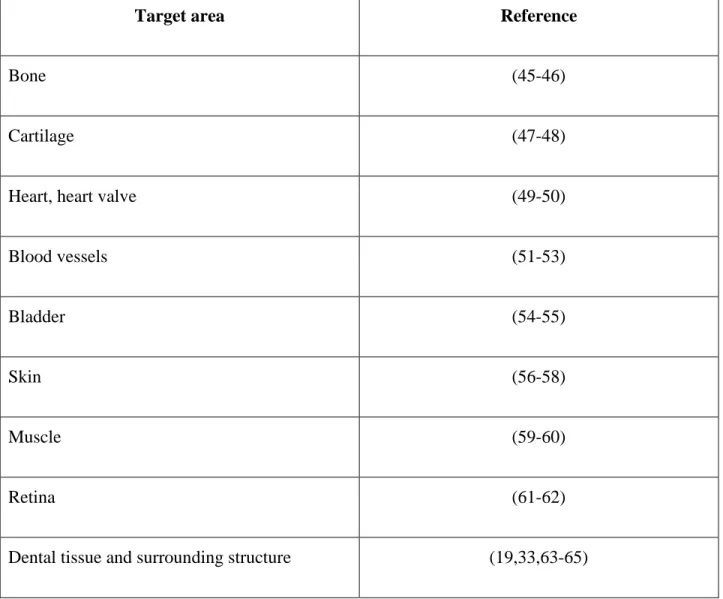
Page | 7 which have been placed in patients in order to restore or replace diseased or damaged tissue, was mainly to be found in reconstructive medicine technology (Table A).
Target area Reference
Bone (45-46)
Cartilage (47-48)
Heart, heart valve (49-50)
Blood vessels (51-53)
Bladder (54-55)
Skin (56-58)
Muscle (59-60)
Retina (61-62)
Dental tissue and surrounding structure (19,33,63-65)
Table A: Medical and dental tissue engineering
Realizing the potential of regenerative approaches for the craniofacial complex will require integration of three key elements: engineering and material methods, responding progenitor/stem cells, and suitable biochemical and physico-chemical approaches (Figure B).
Introduction
Page | 8 Figure B. Three key elements of tissue engineering
1.5 Factors influence the fate of stem cells 1.5.1 Soluble factor directs stem cell fate
Understanding the factors that drive the differentiation of stem cells to a desired cell type is highly important in designing artificial scaffolds for tissue engineering purposes. The stem cell niche refers to the local microenvironment that regulates stem cell survival, self-renewal and differentiation. Key components of a stem cell niche are soluble growth factors, cell-cell contacts, extracellular matrix (ECM) and mechanical load (66). As a key component of the extracellular environment, the extensive studies of the effects of soluble factors in stem cells have been demonstrated. For example, the osteogenic differentiation of MSCs in vitro could be observed in
Introduction
Page | 9 the presence of a combination of dexamethasone, ascorbic acid, and β-glycerophosphate (67), in a conditioned medium from osteocytes (68), and with a variety of factors such as transforming growth factor-β1 (TGF-β1) (69), and basic fibroblast growth factor (70). Furthermore, TGF-β1 has been verified in global gene expression analyses of MSCs as a key growth factor pathway for chondrogenic, osteogenic and adipogenic differentiation (71-72).
1.5.2 Mechanical and physical factors direct stem cell fate
Mechanical and physical factors such as mechanical loading (73), electromagnetic fields (74), and biomaterials (75-80) have been studied in tissue engineering approaches for the differentiation of MSCs into osteogenic lineage. Advances in biomaterial engineering and scaffold fabrication were able to develop in vitro cell culture systems for accommodation and application of MSCs in regenerative medicine. Several studies showed the strong influences of the features of extracellular matrix (ECM) on regulating stem cell fate as follows.
1.5.2.1 Mechanical force controls the gene expression of MSCs
Kurpinski et al. investigated the effects of mechanical forces on the differentiation of MSCs by using a micropatterned strip to align MSCs along the uniaxial strain direction. The result showed that the expression of smooth muscle cell (SMC) marker calponin-1 was increased, while the expression of cartilage matrix marker was decreased. However, the changes of gene expression were diminished when aligning MSCs perpendicularly to the direction of the strain. Therefore, the study suggested that mechanical strain had an effect on the differentiation of MSCs (81).
Moreover, the study from the same group has shown that the synergistic upregulation of calponin- 1 was detected when TGFβ1 was applied together with cyclic mechanical strain. So, they suggested that both TGF-β and mechanical stimulation play an important role in MSC regulation (82).
Introduction
Page | 10 1.5.2.2 Topography influences MSC fate
Physical topography, a part of ECM networks, was shown to influence the behavior of stem cells (83-84). The studies of cell-nanoenvironment interaction were performed using nano topographies which were fabricated by electron beam lithography (EBL). Dalby et al. examined the effect of nanoscale topographic features on MSCs. Bone-specific ECM protein osteocalcin and osteopontin-positive regions, as well as early nodule formation were detected in MSCs grown on the substrate with dots displaced randomly by up to 50 nm (DSQ50). However, a distinct differentiation profile of differentiated cells could be observed in comparison to those treated with osteogenic medium. Therefore, they suggested that the mechanism for the regulation of differentiation between cells cultivated on nanotopography substrate and in osteogenic medium was different (85).
1.5.2.3 Stiffness substrate directs MSCs fate specification
Engler et al. illustrated the first evaluation of the matrix stiffness role in modulating the fate of human mesenchymal stem cells (hMSCs) (86). Polyacrylamide gels, which were established according to the protocol described previously by Pelham et al. (87) and were coated with type I collagen as an artificial matrix for the attachment of stem cells in vitro, were used in this publication. The elasticity of matrix substrates ranged from relatively rigid to soft, depending on the proportion of chemical crosslinking. The result showed that MSC fate was promoted by the substrate stiffness. For example, MSCs demonstrated neuronal phenotype when they were grown on a soft matrix that mimicked brain elasticity (E ~ 0.1-1 kPa). In addition, when MSCs were cultured on substrate with intermediate stiffness that mimicked the elasticity of striated muscle (E
~ 8-17 kPa), they displayed myogenic characteristics. Furthermore, the stiffer substrates comparable to collagenous bone (E ~ 25-40 kPa) led MSCs to osteoblast. Hence, the substrate stiffness was very effective in regulating MSCs to develop into the desired lineage (86).
Introduction
Page | 11 In order to understand the mechanism, Engler found that the elasticity-directed lineage specification was blocked by non-muscle myosin II (NMM II) inhibition without strongly perturbing many aspects of cell function. The results indicated the distinct mechanism by which matrix stiffness governed directed differentiation. This conclusion was supported by the investigation that the induction by substrate stiffness was complementary to the regulatory effects of specialized soluble factors which have previously been shown to regulate MSCs into specific cell lineages (86).
In order to support the study from Engler, Li et al. investigated the effect of substrate stiffness on the functions of rat bone marrow and adipose tissue derived mesenchymal stem cells in vitro (88). Polydimethylsiloxane (PDMS) was used in this study with five different stiffnesses;
the softest (Sot), soft (SO), medium (M), stiff (ST), and the stiffest (STt). They found that when rat bone marrow derived MSCs (rBMSCs) and rat adiposed tissue derived MSCs (rAMSCs) were grown on different surface substrates, cellular functions were detected according to the matrix stiffness. The attachment of both rBMSCs and rAMSCs on the softer substrate was better than that on the stiffer one. The proliferation of these cells had no significant difference according to the matrix stiffness. However, the stiffer substrate induced the osteogenic differentiation of the two kinds of stem cells significantly more than the softer one. In addition, rBMSCs grown on the same stiffness exhibited the expression of more osteoblast-related gene markers than rAMSCs.
Moreover, biomaterials, together with biochemical reagents influenced a stronger effect on osteogenic differentiation of MSCs than with either treatment alone (88).
Park et al. also showed the influence of substrate stiffness on MSC differentiation (89).
They observed how the matrix stiffness modulated MSC differentiation into SMC and chondrogenic lineages in response to TGF-β. They found that MSCs on a stiff matrix exhibited a higher expression of SMC marker α-actin and calponin-1, on the other hand, MSCs on a soft
Introduction
Page | 12 matrix showed a high expression of chondrogenic marker collagen II and adipogenic marker lipoprotein lipase (LPL). They also showed that TGF-β increases SMC marker expression on stiff substrates and chondrogenic marker expression of soft substrates. However, TGF-β suppressed adipogenic marker expression on soft substrates while the adipogenic medium and soft matrix promoted the differentiation of MSCs into adipogenic lineage effectively. From the results, it was suggested that although substrate stiffness was an important determinant of stem cell differentiation, its effect might not be specific for only one lineage, and specialized soluble factors such as TGF-β are required, together with matrix stiffness, to determine a unique differentiation pathway (89).
Xue et al. observed the influences of substrate elasticity and cell seeding density on MSC lineage differentiation (90). They generated polyacrylamide substrates with two different stiffnesses that were hard and soft matrices corresponding to Young’s moduli of 40 + 3.6 and 1.6 + 0.3 respectively. Type I collagen and fibronectin were used to coat the surface of substrates. The result demonstrated that the regulation of osteogenic marker expression by stiff substrate was overridden by a high cell seeding density. However, cell seeding density did not influence the chondrogenic marker expression induced by soft gel. These evidences suggested that the interplays between cell-matrix and cell-cell interactions contribute to hMSCs differentiation (Figure C) (90).
Introduction
Page | 13 Figure C. The cellular microenvironment
Soluble growth factors and ECM combine with cell-cell adhesion to control cell fate.
Adapt from Regen Med. 2011 March; 6(2): 229-240
1.5.2.4 Influences of stiffness substrate on dental stem cells
To date, little is known regarding the substrate stiffness regulating the function of stem cells from dental tissues. Viale et al. showed the first evaluation of the effects of substrate stiffness on cell proliferation and osteogenic differentiation of human dental follicle cells (DFCs). They found that the proliferation of DFCs was slightly decreased in cell culture with stiff substrates.
The osteogenic differentiation in DFCs could only be initiated with osteogenic differentiation medium (Dexamethasone) after using various substrate stiffnesses. Unlike the study with MSCs, the softest matrix promoted osteogenic differentiation in DFCs more than that on the stiffest one (91). In contrast to DFCs, the study from the same group has demonstrated that the stiff substrate
Introduction
Page | 14 promoted osteogenic differentiation in SHED which was similar to MSCs. In addition, the proliferation of SHED was increased on a stiff substrate. Thus, they suggested that cellular reactions on matrix-elasticity actually depended on the kind of the cell type and the extracellular environment. However, additional studies are required to confirm this suggestion (92).
1.6 Objective of the study
The effect of surface stiffness on the function of MSCs has been well studied, and the influence of this factor on DFCs and SHED has come to be known. However, for the other stem cell lineages from dental tissues, the effect of matrix stiffness has not yet been examined.
This study investigated the effect of substrate stiffness on regulating the proliferation and differentiation of two kinds of dental stem cells, PDLSCs and SCAPs. The following questions were addressed:
1. Is there an association between human dental stem cell attachment, proliferation, the osteogenic differentiation or adipogenic differentiation and the substrate stiffness?
2. Do the different kinds of dental stem cells respond differently to the substrate stiffness?
In the first part of this study, PDLSCs and SCAPs which are closely related to DFCs and SHED were characterized in terms of stem cell properties from three teeth. Next, the best quality of each stem cell lineage according to stem cell properties such as the capability of osteogenic differentiation focusing on the mineralization induction and the multipotential differentiation was used for the surface stiffness experiments.
Materials and Methods
Page | 15
2. Materials and Methods
2.1 Materials
General materials Manufacturer
96-Well-,48-Well-, 24 Well-and 6-Well-Cell Culture Plates
Costar-Corning 8-Well-Cell Culture Dish, Non-Treated
Polystyrene
Thermo Fisher Scientific T-25 Cell Culture Flask (25 cm²) Nunc
T-75 and T-162 Cell Culture Flasks (75 and 162 cm²)
Costar-Corning 10-cm Cell Culture Plate Costar-Corning
70 μm Cell Strainer Corning
10ml, 25ml and 50ml Serological Pipette Greiner bio-one
5ml Serological Pipette Corning
15ml and 50 ml Conical Centrifuge Tubes Falcon
Counting Slides Bio-Rad
5 ml and 10 ml BD Luer-Lok™ Tip Syringe BD Syringe
0.2 µm Syringe Filters VWR
QIAshredder Qiagen
Disposable Scalpel Feather
Filter Pipette Tips Kisker
Pipettor Eppendorf
Whatman Filter Papers GE Healthcare Life Sciences
Materials and Methods
Page | 16
Chemicals Manufacturer
Acetic acid Merck
Acetone Roth
Acrylamide solution (40%) Bio-Rad
Alizarin Red S Sigma-Aldrich
Alkaline Buffer Solution 1.5 M Sigma-Aldrich
Ammonia solution Roth
Ammonium persulfate Sigma-Aldrich
Amphotericin B Roth
Bis solution (2%) Bio-Rad
Bovine serum albumin (BSA) biomol
Cell Counting Kit-8 DOJINDO
Cetylpyridinium chloride Sigma-Aldrich
Collagen type I solution Sigma-Aldrich
Collagenase/Dispase Roche
Coomassie Brilliant Blue R250 Thermo Scientific
Dexamethason Sigma-Aldrich
Dimethylsulfoxid (DMSO) Sigma-Aldrich
DNase I Roche
Materials and Methods
Page | 17
Chemicals Manufacturer
Eosin Merck
Ethanol Roth
Ethidium Bromide AppliChem
37 % Formaldehyde Roth
β-Glycerophosphate Sigma-Aldrich
Gentamicin Sigma-Aldrich
GP Agarose Biozym
Hematoxylin Merck
HEPES AppliChem
Hyaluronidase Sigma-Aldrich
Hydrochloric acid Roth
β-Mercaptoethanol AppliChem
Methanol Sigma-Aldrich
NaOH (1 M) Sigma-Aldrich
Oil-Red-O Sigma-Aldrich,
Phosphatase Substrate Sigma-Aldrich
2-Phospho-L-ascorbic acid Sigma-Aldrich
Probes Roche
Materials and Methods
Page | 18
Chemicals Manufacturer
2-Propanol Merck
Silver nitrate Merck
Sodium Phosphate Sigma-Aldrich
Sodium thiosulfate Merck
TEMED AppliChem
Triton X-100 Sigma-Aldrich
Trypan Blue Sigma Aldrich
Trypsin Gibco
Buffer/Solution Manufacturer Composition/Dilution
HEPES-Buffer Sigma-Aldrich 1M, pH 7
HEPES-Buffer AppliChem 1M, 50mM, pH 8.5
1 x PBS-Buffer Sigma-Aldrich -
Tris-Borate EDTA-Buffer Sigma-Aldrich 1xTBE
Cell culture medium Manufacturer Composition/Dilution Standard cell culture medium Sigma-Aldrich DMEM
10% FBS 100 µg/ml
Materials and Methods
Page | 19 Penicillin/Streptomycin
Osteogenesis differentiation medium (ODM)
-Self-made ODM Sigma-Aldrich DMEM
10% FBS 100 µg/ml
Penicillin/Streptomycin 100 µM Ascorbic acid 2- phosphate
20 mM HEPES buffer 10 mM β-glycerophosphate 1x10⁻⁷ M dexamethasone sodium phosphate
Osteogenesis differentiation medium (ODM)
-StemPro® Osteogenesis Differentiation Kit
Invitrogen 90% Basal medium
10% Supplement 5µg/ml Gentamicin
Adipogenesis differentiation medium (ADM)
-StemPro® Adipogenesis Differentiation Kit
Invitrogen 90% Basal medium
10% Supplement 5µg/ml Gentamicin
Materials and Methods
Page | 20
Kit Manufacturer
Light Cycler Fast Start DNA Master Plus Set
SYBR Green Roche
Light Cycler Taq Man Master Roche
Quant-iT PicoGreen dsDNA Assay Invitrogen
Osteolmage™ Mineralization Assay Lonza, Switzerland QuantiTect Reverse Transcriptase Kit Qiagen
RNeasy Plus Mini Kit Qiagen
SYBR Green JumpStart Taq ReadyMix Sigma-Aldrich
Antibody Manufacturer
CD44- FITC Miltenyi Biotec, Germany
CD146- FITC Miltenyi Biotec, Germany
CD 105- APC Miltenyi Biotec, Germany
CD 90- PE Miltenyi Biotec, Germany
Anti- human Nestin- Phycoerythrin Monoclonal Antibody
R&D Systems, Inc., USA
FITC- anti- human STRO-1 BioLegend, USA
Mouse IgG- FITC Miltenyi Biotec, Germany
Mouse IgG2b- APC, Isotype control antibody Miltenyi Biotec, Germany Mouse IgG1, Isotype Control- PE R&D Systems, Inc., USA FITC Mouse IgM, λ Isotype Control BioLegend, USA
Materials and Methods
Page | 21
Equipment/Software Manufacturer
Biological Safety Cabinet : Herasafe HS 12 Kpl. Heraeus
Centrifuge Labofuge 400 R ENDRO, FunctionLine, Heraeus
Centrifuge 5417R Eppendorf
Cell counter ; Automated Cell Counter TC20 TM
BioRAD Dynamic test equipment; Instron ElectroPuls
E3000
Instron
FACS Canto-II Cell analyzer Becton Dickinson Biosciences, San Jose, California
GS Gene Linker® UV Chamber BioRAD
Image Analysis programm, AxioVision Zeiss
Incubator, CO2- Incubator HERAcell®150 Thermoscientific
LightCycler Roche
Liquid Nitrogen Storage Vessels ; Arpege110 Air LIQUIDE Medical
Microplate Reader : TECAN infinite F200 TECAN, Crailsheim, Germany
Microscope Eclipse TS100 Nikon
Mini protean casting strand and frame BioRAD
Nanodrop ND 1000 Spectrophotometer Thermo Scientific
pH-Meter FE20/EL20 METTLER TOLEDO
Power Supply, Power PAC 3000 BioRAD
Reax Top Vortex Mixer Heidolph
Materials and Methods
Page | 22
Equipment/Software Manufacturer
Round hollow punch 14mm Marshal Tools
Shakers KM-2 Edmund Bühler GmbH
Shaking Water Baths 1092 GFL
Thermocycler BioRAD
Thermomixer Compact Eppendorf
Vacuum desiccator DURAN
Table1. Real time-PCR primer sequences with accession number and probe type
Gene Primer sequence Accession
number
Probe type GAPDH h_GAPDH_f Forward:
AGCCACATCGCTCAGACAC
NM_002046 SYBR
Green h_GAPDH_r Reverse:
GCCCAATACGACCAAATCC Runx2 h_Runx2_f Forward:
CACCATGTCAGCAAAACTTCTT
NM_001015051.3 Roche Probe #29
h_Runx2_r Reverse: TCACGTCGCTCATTTTGC SYBR
Green OCN h_Osteocalcin_f Forward:
TGAGAGCCCTCACACTCCTC
NM_199173.4 Roche Probe #81 h_Osteocalcin_r Reverse:
ACCTTTGCTGGACTCTGCAC
OPN OPN_f Forward: GAA TCT CCT AGC CCC
ACA GAA TGC
NM_001251830.1 SYBR Green OPN_r Reverse: TTC GGT TGC TGG CAG
GTC CG
Materials and Methods
Page | 23
Gene Primer sequence Accession
number
Probe type CP-23 CP-23_f Forward:
CTAGCCCTGTGGACCAACC
AY584596 Roche
Probe #53 CP-23_r Reverse:
CCAGTCCAGAGCTGGTGAG TGF-
Bmp 2
h_TGF-Bmp2_f Forward: CGGACTGCGGTCTCCTAA NM_001200.2 SYBR Green h_TGF-Bmp2_r Reverse:
GGAAGCAGCAACGCTAGAAG PPARγ2 h_PPARγ2_qrt_
f
Forward:
GACCTGAAACTTCAAGAGTACCA AA
XM_006713208.1 SYBR Green
h_PPARγ2_qrt_
r
Reverse:
TGAGGCTTATTGTAGAGCTGAGT C
LPL h_LPL_qrt_f Forward: ATGTGGCCCGGTTTATCA NM_000237.1 SYBR Green h_LPL_qrt_r Reverse:
CTGTATCCCAAGAGATGGACATT
Materials and Methods
Page | 24 2.2 Methods
2.2.1 Cell culture
In this experiment, Tooth no. 1A and 1B were surgically removed from the same patient, while tooth no.2 was obtained from a different person. Stem cells from apical papilla (SCAPs) and periodontal ligament stem cells (PDLSCs) were isolated by two different methods. All SCAPs and PDLSCs except PDLSCs no.1A were isolated with the single cell isolation method as previously described (24). The protocol was approved by the Ethics Committee of the University of Regensburg. Briefly, the impacted third molars were surgically removed from young patients in the department of Cranio- and Maxillo-facial Surgery of the University Hospital Regensburg and placed into Dulbecco´s modified Eagle´s medium (DMEM; Sigma-Aldrich) containing 100 µg/ml Penicillin/Streptomycin (Sigma-Aldrich) and stored at 4°C after informed consent. Before starting the cell isolation procedure, the teeth were washed with phosphate buffered saline (PBS; Sigma- Aldrich). The apical papilla tissues were separated from the exterior of the root foramen area and the periodontal tissues were removed along the surface of the root with a sterile surgical blade.
The tissues were then minced into small pieces and digested in a solution of 1 mg/ml Collagenase/Dispase, 0.3 mg/ml DNase I (Roche Applied Science, Manheim, Germany) and 0.2 mg/ml Hyaluronidase (Sigma-Aldrich) in PBS for 1 hour at 37°C. Cell suspensions were passed through a 70 µm strainer to get single cell suspension, then centrifuged at 400 x g for 10 minutes and then the cells were resuspended by complete growth medium containing DMEM supplemented with 20% Fetal bovine serum (FBS; Sigma-Aldrich), 100 µg/ml Penicillin/Streptomycin, 2.5 µg/ml Amphotericin B (Sigma-Aldrich) and 50 µg/ml Gentamycin (Sigma-Aldrich ). Subsequently, the cell suspension was seeded into T25 flasks in complete growth medium at 37°C in 5% carbon dioxide (CO2). After 24 hours, the cell culture medium was changed to remove non-adherent cells. Then, the remaining cells grew as a small cluster and
Materials and Methods
Page | 25 formed colonies approximately 10-14 days after seeding cells. The standard cell culture medium containing DMEM supplemented with 10% FBS and 100 µg/ml Penicillin/Streptomycin was used after the first passaging was done.
Due to the small amount of periodontal tissue we were able to harvest from tooth no.1A, PDLSCs no.1A were isolated with the explant outgrowth method (19). After the tissues were minced and put into a digestion enzyme solution, the tissues were then placed into a 6-well plate, and incubated for 10 minutes at 37°C to allow adherence. The complete cell culture medium was carefully placed into the culture plates and cultured at 37°C with 5% CO2 like as the first method.
Non-adherent cells were removed by changing the medium. After the cell culture had reached confluency between 2 and 4 weeks, PDLSCs were passaged as a cell passage 1. Passaged cells were seeded at 5,000 cells/cm2 and medium change was carried out every 2-3 days. For all experiments, SCAPs and PDLSCs were used at cell passage 4-6.
2.2.2 Flow cytometry
For characterization, PDLSCs and SCAPs were investigated for stem cell associated markers with flow cytometry which has been done by Anja Reck, department of Cranio- and Maxillo-facial Surgery of University Hospital Regensburg. In short, PDLSCs and SCAPs were incubated with the following monoclonal antibodies; CD44- FITC, CD146- FITC, CD 105- APC, CD 90- PE (Miltenyi Biotec, Bergisch Gladbach, Germany), anti- human Nestin- Phycoerythrin monoclonal antibody (R&D Systems, Inc., Minneapolis, USA) and FITC- anti- human STRO-1 (BioLegend, San Diego, CA 92121, USA) for 45 minutes at 4°C. Then, they were washed with PBS containing 0.5% bovine serum albumin (BSA) and 2 mM EDTA. Cells were permeabilized with 0.2% saponin and 0.1% BSA for 15 minutes and washed in PBS containing 0.1% BSA and 2 mM EDTA before intracellular staining. The following antibodies were used as negative controls;
mouse IgG- FITC (Miltenyi Biotec), mouse IgG2b- APC isotype control antibody (Miltenyi
Materials and Methods
Page | 26 Biotec), Mouse IgG1 isotype Control- PE (R&D Systems, Inc.) and FITC mouse IgM, λ isotype control (BioLegend). Flow cytometry analysis was performed using the FACS Canto II (Becton Dickinson).
2.2.3 Preparation of Polyacrylamide Substrate
Polyacrylamide gels were prepared according to the method described previously (87). In short, five milliliters of PA gel solution with the three different concentrations of acrylamide and bis-acrylamide (Bio-Rad) that are 8% acrylamide and 0.1% bis-acrylamide, 8% acrylamide and 0.06% bis-acrylamide, and 5% acrylamide and 0.06% bis-acrylamide for stiff, medium, and soft substrate respectively were mixed and degassed under a vacuum for at least 20 minutes to remove the oxygen. Then, 30 µl of 0.1 mg/ml ammonium persulfate (Sigma-Aldrich) and 20 µl TEMED (Applichem) were added and placed into the mini protean casting strand and frame (Bio-Rad) to form 1 mm thickness of substrate. After letting the gel polymerize for 30-45 minutes, it was gently removed and the gel was rinsed with 50 mM HEPES, pH 8.5 (Applichem). PA gel was then cut into a circular shape with 14 mm diameters and placed in a 24 well-plate for all experiments except RNA isolation. For RNA isolation, PA gel was cut into a rectangular shape with 2.5 x 3.5 cm length and prepared in an 8 well-plate. Sulfo-SANPAH (Pierce) 0.5 mg/ml in 50 mM HEPES, pH 8.5, which is used for the cross linking of collagen I and PA gel, was pipetted onto the surface of substrate and exposed to UV light for 5-8 minutes at a distance of 2-3 inches for photoactivation procedure. The sulfo-SANPAH solution was then removed, and the photoactivation was repeated. After photoactivation, the substrate was washed several times in 50 mM HEPES to remove excess reagent. A 0.2 mg/ml of type I collagen (Sigma-Aldrich) was then layered onto the surface of gel and incubated for 4 hours at room temperature or overnight at 4°C on a shaker. After washing with PBS, the gels were stored in PBS at 4°C. Before platting the cells, the gel was exposed to UV for 15 minutes for sterilization. The gel was transfered to the new
Materials and Methods
Page | 27 culture plate whose surface had been pre-treated for 1 hour with 0.1% BSA to reduce the attachment of cells on the plate. Then, the PBS was replaced with a complete culture medium for 1 hour at 37°C to allow the equilibrium.
In order to confirm the stiffness of polyacrylamide substrate, the PA gel was prepared in circular shapes with 2 mm thickness and 14 mm diameter and measured by dynamic test equipment (Instron ElectroPuls E3000) at the Biomedical Engineering department of the University of Applied Science, Regensburg.
2.2.4 Cell attachment and proliferation
For stem cell characterization, both SCAPs and PDLSCs were cultured in DMEM, supplemented with 10% FBS and 100 µg/mL Penicillin/Streptomycin (standard cell culture medium) in a 96-well plate with a cell seeding density of 5,000 cells/cm2. Similarly so with cell characterization, cell attachment and proliferation on PA gel analysis were cultured in a standard cell culture medium. The cell seeding density on the control group was 5,000 cells/cm2, but on the PA gel it was 10,000 cells/cm2. Cell attachment and proliferation were then estimated by cell counting kit-8 (CCK-8; Dojindo, Japan) following the instructions from the manufacturer. CCK-8 is a colorimetric assay for determining the number of viable cells in cell proliferation and cytotoxicity assays. Cell cultures with CCK-8 were incubated for 2 hours at 37°C. After that, the optical density was measured at 450 nm wavelength.
2.2.5 Colony-Forming Efficiency
The assessment of colony forming unit fibroblast (CFU-F) in SCAPs and PDLSCs was done at cell passage 4. Cell suspension of PDLSCs and SCAPs were seeded into a 6-well culture plate at a concentration of 100 cells/well in standard cell culture medium. Cultures were set up in quadruplicates and incubated at 37°C in 5% CO2 for 2 weeks. For enumeration, colonies were
Materials and Methods
Page | 28 washed twice with PBS and then fixed in 2% paraformaldehyde for 10-15 minutes. The fixed cultures were then stained with 0.2% Coomassie Brilliant Blue R250 for 15 minutes and the stained culture was rinsed with tap water. Aggregates greater than 50 cells were scored as CFU-F which was observed under the microscope.
2.2.6 Differentiation protocol
SCAPs and PDLSCs were cultivated in a standard cell culture medium until sub- confluence (>80%). Then, the culture medium was changed to osteogenic differentiation medium (ODM) or adipogenic differentiation medium (ADM). Two different kinds of ODM were used in this study; StemPro® osteogenic differentiation medium (StemPro® ODM; Invitrogen) and a self- made osteogenic differentiation medium (self-made ODM), while StemPro® adipogenic differentiation medium (StemPro® ADM; Invitrogen) was used for adipogenic differentiation.
StemPro® ODM and ADM are the instant kits containing all reagents required for inducing MSCs to be committed to the osteogenesis and adipogenic pathway which can be prepared from 90%
basal medium, 10% supplement and 5µg/ml Penicillin/Streptomycin. Important to note is that, StemPro® ODM and ADM should be used within 1 month after preparing. For self-made ODM, the culture medium contains DMEM supplemented with 10% FBS, 100 µg/mL Penicillin/Streptomycin, 100 µM Ascorbic acid 2-phosphate, 20 mM HEPES buffer, 10 mM β- glycerophosphate and 10-7 M dexamethasone sodium phosphate.
2.2.7 Mineralization measurement
SCAPs and PDLSCs were cultivated in a standard cell culture medium until subconfluency was reached (>80%) before that they had been stimulated with the StemPro® ODM. Long-term cell cultures were carried out in a standard cell culture medium as a control. The mineralized deposits of the differentiated cells were determined by alizarin red staining after 28 days of the differentiation. Briefly, cells were washed with PBS and fixed with 70% Ethanol for 10 minutes.
Materials and Methods
Page | 29 Cells were then washed with distilled water and stained with alizarin red reagent, pH4.2 [adjusted pH by using hydrochloric acid (HCl) and Ammonium hydroxide solution (NH4OH)] thereafter for 10 minutes at room temperature. Subsequently, the alizarin red was removed from the culture plates and washed several times with PBS. Calcium staining was observed under a phase contrast microscope. The alizarin crystals were quantified by dissolved in 100 µl of 10% cetylpyridinium chloride monohydrate solution at room temperature for 30 minutes. The samples were then measured at 540 nm wavelength by a using a plate reader (TECAN infinite F200).
2.2.8 Alkaline phosphatase (ALP) activity measurement
Activity of ALP was measured with a colorimetric assay. Briefly, after cells had been cultivated in DMEM until reaching subconfluency, the cell culture medium was then changed to ODM. For cell characterization, all PDLSCs and SCAPs were induced with StemPro® ODM and ALP activity was evaluated on day 3 and day 7. However, the effect of the surface stiffness on ALP activity of PDLSCs and SCAPs was determined by inducing cells with two different kinds of ODM; StemPro® and self-made ODM at day 7. Cells cultured in a standard cell culture (DMEM) on day 0 were used as a control. SCAPs and PDLSCs on polystyrene or on PA gel either treated with ODM or control with DMEM were washed with PBS buffer. Then, the cells underwent the process of lysis with 0.1% Triton X-100 for 10 minutes. Cell lysate (approximately 25 µl) was mixed with 25 µl of 1.5 M alkaline buffer and 41.6 µl of phosphatase substrate (Sigma-Aldrich) and incubated at 37°C for 1 hour. Subsequently, the reaction was stopped by using 41.6 µl of 0.3 M NaOH solution and absorbance at 405 nm was measured thereafter by using a TECAN plate reader. ALP activity was normalized to the DNA content. DNA concentration was performed by using 15 µl of cell lysate and mixed with 85 µl of 1xTE buffer and 100 µl of working reagent which could be prepared following the protocol of the Quant-iT PicoGreen ds DNA Assay Kit
Materials and Methods
Page | 30 (Life Technology). The mixture was then measured by using a plate reader (TECAN) with standard fluorescein wavelength at 485 nm.
2.2.9 Adipogenic differentiation
SCAPs and PDLSCs were seeded at 5,000 cells/cm2 on polystyrene plates or 10,000 cells/
cm2 on the PA gel and cultivated in a standard cell culture medium until sub-confluence (>80%) before they were induced with the StemPro® ADM. As a control, long-term cell cultures were carried out in a standard cell culture medium (DMEM). The presence of lipid droplets was detected by Oil Red O staining after 4 weeks of adipogenic induction and 2 weeks of adipogenic differentiation of stem cells on PA gel.
The staining was started with removing the media from the wells and gently rinsing the samples with PBS. Cells were then fixed with 10% formalin and incubated at room temperature for 30-60 minutes. Subsequently, each well was rinsed with distilled water and 60% isopropanol was added to each sample for 5 minutes. After isopropanol was removed from the plates, Oil Red O working solution was prepared according to the manufacturer’s protocol and was added to the wells and incubated for 5 minutes at room temperature. Then, the cultures were rinsed several times with tap water and Hematoxylin stain was added into each well for 1 minute. Finally, the cultures were washed with tap water until the water was clear, and water was added to each well and viewed on a phase contrast microscope.
The quantification of lipid droplets of PDLSCs and SCAPs on PA gel was measured by 5 fields of each replicate using AxioVision-Release 4.8.2-SP2 (Carl Zeiss Microscopy GmbH).
Three biological replicates were used for statistical analysis.
Materials and Methods
Page | 31 2.2.10 Quantitative reverse transcription-polymerase chain reaction (qRT-PCR)
Total RNA was isolated from cells by using RNeasy Mini Kit (Qiagen, Hilden, Germany) according to the manufacturer’s protocol. The cDNA synthesis was performed using 400 ng total RNA and the QuantiTect Reverse Transcription Kit (Qiagen) was used for reverse transcription. In this study, qRT-PCR was done with two different PCR systems; the LightCycler 2.0 (Roche) and The StepOnePlus Real-Time PCR system (Applied Biosystems). With the characterization of PDLSCs and SCAPs no.1A and 1B and the experiments of PDLSCs and SCAPs no.1B cultivated on PA gel by using StemPro® ODM as a differentiation medium, the LightCycler® FastStart DNA MasterPLUS SYBR Green I (Roche Applied Science) was used for studying Glyceraldehyde 3-phosphate dehydrogenase (GAPDH), osteopontin (OPN), bone morphogenetic protein 2 (BMP2), peroxisome proliferator-activated receptor γ2 (PPARγ2) and Lipoprotein lipase (LPL). Furthermore, runt-related transcription factor 2 (RUNX2), osteocalcin (OCN), cementum protein 23 (CP23) was done by using the LightCycler® TaqMan® Master (Roche). The LightCycler 2.0 with the light cycler 4.05 software was used to estimate the threshold cycles (Ct- value). For SYBR Green run protocol, the PCR was performed by using 20 µl of final reaction volumes starting with a pre-incubation step of 10 minutes at 95°C. A total of 45 cycles were executed for 10 seconds at 95°C for denaturation and an annealing temperature of 60-64°C for 5 seconds followed by an extension period of 20 seconds at 72°C. After the last cycle had finished, all products were denaturated for a melting curve analysis. The TaqMan run protocol starting with pre-incubation step at 95°C for 10 minutes followed by 45 cycles of amplification at an annealing temperature of 60°C.
For the studies of the characterization on PDLSCs and SCAPs no.2, and PDLSCs and SCAPs no.1B grown on PA gel by using self-made ODM (Dexamethasone) and StemPro® ADM as the differentiation medium, SYBR Green JumpStart Taq ReadyMix (Sigma-Aldrich) was used
Materials and Methods
Page | 32 to investigate GAPDH, Runx2, OPN, BMP2, PPARγ2 and LPL, and the LightCycler® TaqMan®
Master (Roche) was used to observe gene expression of CP23 and OCN. The StepOnePlus Real- Time PCR system with StepOneTM software v2.0.1 was used to estimate the Ct-value. For SYBR Green run protocol, the PCR was performed by using 15 µl of final reaction volumes starting with a pre-incubation step of 20 minutes at 95°C. A total of 40 cycles were executed for 3 seconds at 95°C for denaturation and an annealing temperature of 60-64°C for 30 seconds. After the last cycle had finished, all products were denaturated for melting curve analysis. The TaqMan run protocol starting with pre-incubation step at 50°C for 2 minutes and 95°C for 10 minutes followed by 40 cycles of amplification at an annealing temperature of 60°C.
Primer sequences or Roche probe numbers can be obtained from table 1. To determine all gene expressions, GAPDH was used as a housekeeping gene for normalizing each sample. The delta/delta-calculation-method as described by Winer et al. was used to investigate the relative gene expression (93). For each real time RT-PCR, a selected total RNA sample derived from cells grown in a standard cell culture medium on standard cell culture plates was used for the calibration (relative gene expression of one sample = 1)
2.2.11 Statistical analysis
The collections of data throughout this study were reported as mean + standard deviation or standard error of at least three samples (notice in result part). Student’s t test was used for statistical analysis and p-values less than 0.05 were considered significant.
Results
Page | 33
3. Results
3.1 Phenotype characterization of PDLSCs and SCAPs
Tooth no.1A and 1B were surgically removed from the same patient (Figure 1a, 1b), while tooth no.2 was obtained from a different person (Figure 1c). PDLSCs no.1A was isolated using the explant outgrowth method, while PDLSCs no.1B, PDLSCs no.2 and all SCAPs were obtained from the single cell isolation method (Figure 2a, 3a). Although all of PDLSCs are derived from the PDL, their isolation method and the tooth origin were different. All of PDLSCs showed similar proliferation rate in the first two days of in vitro culture. However, between day 3 and day 7 PDLSCs no.1A and 1B showed a higher proliferation rate than PDLSCs no.2 and PDLSCs no.1B
Tooth no.1A Tooth no.1B
Tooth no.2 PDL
Apical papilla
Dental follicle
a b
c
Figure1. Pictures of human third molars that have been surgically removed from 2 patients. (a,b) Teeth from the same person after the apical papilla and PDL tissue were dissected. (c) Tooth from the other person.
Results
Page | 34 proliferated better than PDLSCs no.1A on day 3 and day 5 (Figure 2b). On day 10 of cultures, all PDLSCs resulted in the plateau phase of cell culture (Figure 2b). Flow cytometry analysis can be used to analyze surface molecule expression of dental stem cells. In this study, all PDLSCs expressed high surface markers CD44, CD105, Nestin and CD90, but they were negative for CD146 and Stro-1 (Figure 2c). Colony forming unit-fibroblast (CFU-F) was the other method that could be used for stem cell characterization. We found that PDLSCs no.2 show a higher ability of CFU-F than PDLSCs no.1A and 1B (Figure 2d).
Figure2. Isolation of human PDLSCs from 3 teeth. (a1 - a3) PDLSCs no. 1A at day 6 which were isolated using explant outgrowth method, while PDLSCs no.1B and 2 at day 6 and day 10 which were isolated by single cell isolation method. (a4 - a6) Colony forming unit-fibroblast (CFU-F) at day 14. (b) The growth curve of PDLSCs was determined using CCK-8 at day 1, 2, 3, 5, 7, 10 and 14 respectively. (c) Flow cytometry analysis of PDLSCs; culture PDLSCs were positive for surface markers CD44, CD105, Nestin and CD90, and negative for CD146 and Stro-1. The percentage of positive cells is indicated. (d) CFU-F was evaluated by Coomassie staining after PDLSCs were cultured for 14 days. All values are mean + SD. (b,d) For statistical analysis, Student’s t test (n=4) was applied; #,*p<0.05 comparison of two groups.
Results
Page | 35 To compare with PDLSCs, the same experiments for the stem cell characterization were done with SCAPs. All SCAPs showed a similar proliferation rate over the first three days in vitro culture. However, on day 5 and day 7 SCAPs no.1A and 2 proliferated better than SCAPs no.1B.
On day 10 of culture, all of them reached the plateau phase (Figure 3b). All of the cells from apical papilla also showed the expression of surface markers CD44, CD105, Nestin and CD90 by flow cytometry analysis. However, SCAPs were negative for Stro-1, but SCAPs no.1A, 1B and 2 expressed CD146 at 31.1, 2% and 1.8% respectively (Figure 3c). Unlike PDLSCs, all SCAPs
Figure3. Isolation of human SCAPs from 3 teeth. (a1 - a3) SCAPs no. 1A, 1B at day 6 and SCAPs no.2 at day 10 which were isolated by single cell isolation method. (a4 - a6) Colony forming unit-fibroblast (CFU-F) at day 14. (b) The growth curve of SCAPs was determined using CCK-8 at day 1, 2, 3, 5, 7, 10 and 14 respectively. (c) Flow cytometry analysis of SCAPs; culture SCAPs were positive for surface markers CD44, CD105, Nestin, CD90 and CD146, and negative with Stro-1. The percentage of positive cells was indicated. (d) CFU-F was evaluated by Coomassie staining after SCAPs were cultured for 14 days. All values are mean + SD. (b,d) For statistical analysis, Student’s t test (n=4) was applied; *p<0.05 comparison of two groups.
Results
Page | 36 had a similar colony forming efficiency (Figure 3d).
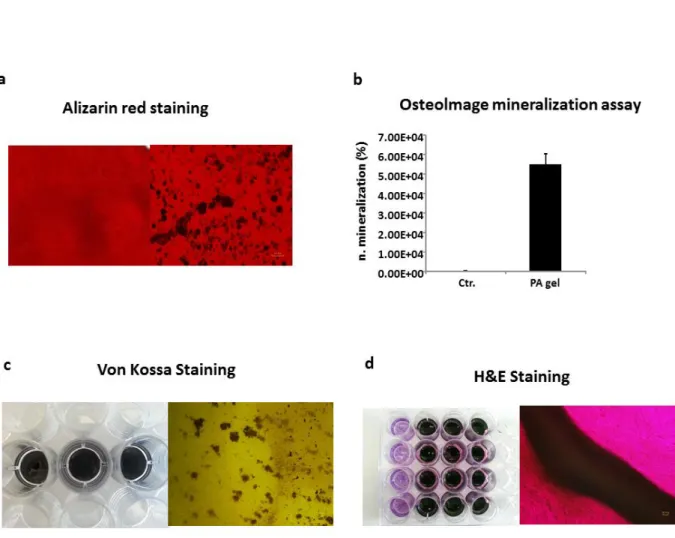
Figure4. (a) The osteogenic differentiation of PDLSCs was observed by ALP activity measurement at day 3 and day 7. Five biological replicates were done in the experiment. All values represent means + standard error (σ/√n). For statistical analysis, Student’s t-test (n=5) was applied; *p < 0.05 comparison of two groups. (b) The mineralization from osteogenic differentiation of PDLSCs was determined by alizarin red staining after cultivated in osteogenic induction medium for 28 days. (c) Quantification of alizarin staining at day 28 of differentiation. All values are means + SD. For statistical analysis, Student’s t-test (n=4) was applied; *p < 0.05 comparison of two groups.
3.2 Osteogenic differentiation of PDLSCs and SCAPs
The osteogenic differentiation potential of PDLSCs and SCAPs was further examined by ALP activity measurement, mineralization evaluation and osteogenic related markers expression.
The potential of differentiation of all SCAPs and PDLSCs was studied through cell cultures supplemented with StemPro® osteogenic differentiation medium in vitro. ALP activity test was performed on day 3 and day 7 by using cells cultured in a standard medium (DMEM) on day 0 as
Results
Page | 37 a control. Our results demonstrated that ALP activity of all PDLSCs and SCAPs on day 7 was significantly increased compared to day 3 and control on day 0 (Figure 4a, 5a). Next, alizarin red staining was used to determine the cluster of mineralization. All PDLSCs and SCAPs were positive for the staining with alizarin after 28 days of induction, which indicated calcium accumulation. Interestingly, both PDLSCs and SCAPs no.1B showed more mineralization nodules than the other cell lineages (Figure 4b, 5b). To prove this observation, alizarin quantification was done with a colormetric assay and measured at 540 nm (Figure 4c, 5c).
Figure5. (a) The osteogenic differentiation of SCAPs was observed by ALP activity measurement at day 3 and day 7.
Five biological replicates were done in the experiment. All values represent means + standard error (σ/√n). For statistical analysis, Student’s t-test (n=5) was applied; *p < 0.05 comparison of two groups. (b) The mineralization from osteogenic differentiation of SCAPs was determined by alizarin red staining after cultivated in osteogenic induction medium for 28 days. (c) Quantification of alizarin staining at day 28 of differentiation. All values are means + SD. For statistical analysis, Student’s t-test (n=4) was applied; *p < 0.05 comparison of two groups.
Results
Page | 38 OCN, Runx2 and OPN were used to determine the gene expression on day 7 and day 28 of all cells. As expected, all PDLSCs significantly increased the expression of all markers by qRT- PCR. For example, PDLSCs no.1A showed the upregulation of all markers on day 7 and day 28, while PDLSCs no.1B significantly increased the level of all markers expression on day 7.
However, PDLSCs no.2 upregulated OCN and Runx2 on day 7 and day 28, as well as OPN on day 28 (Figure 6). From the qRT-PCR results of SCAPs, all SCAPs demonstrated the upregulation of the expression of OCN and Runx2 both on day 7 and day 28 except for SCAPs no.1B and no.2 which significantly increased OCN expression only on day 7. However, SCAPs showed different
Figure6. Relative gene expression of osteogenic markers in PDLSCs. The total RNA was isolated from PDLSCs after 7 and 28 days in osteogenic differentiation medium. Primers were used for OCN, Runx2 and OPN. All values represent means + standard error (σ/√n). For statistical analysis, Student’s t-test (n=3) was applied; *p < 0.05 comparison of two groups.