disseminated cancer cells from the bone marrow of a transgenic mouse
model of breast cancer
Doctoral Thesis
Dissertation zur Erlangung des Doktorgrades der Naturwissenschaften (Dr.rer. nat.) Der Fakultät für Biologie und Vorklinische Medizin der
Universität Regensburg
Submitted by
Siva Lahiri Kanth Nanduri From
Hyderabad, India
Die Arbeit wurde angeleitet von: Prof. Dr. Christoph Klein
Vorsitzender: Prof. Dr. Richard Warth (Chair person)
Erstegutachter: Prof. Dr. Ralph Witzgall (1st PhD assessor)
Zweitegutachter: Prof. Dr. Christoph Klein (2nd PhD assessor)
Drittprüfer: Prof. Dr. Stephan Schneuwly (3rd examiner)
Table of Contents
Summary ... 1
1. Introduction ... 2
1.1. Metastasis and disseminated cancer cells ... 2
1.2.Molecular mechanisms involved in metastasis ... 3
1.3. Detecting circulating and disseminated cancer cells ... 5
1.4. In vitro culture of disseminated cancer cells ... 6
1.5. The BALB-neuT mouse model ... 7
Aim of the project ... 8
2. Methods ... 9
2.1. Mouse experiments ... 9
2.2. Cell culture methods ... 9
2.2.1. Processing patient bone marrow ... 9
2.2.2. Culturing bone marrow DCC of patients ... 10
2.2.3. Mammary tissue digestion and epithelial cell isolation... 10
2.2.4. Preparation of single cells from organoids ... 11
2.2.5. Isolating cells from murine bone marrow ... 12
2.2.6. Enrichment of bone marrow DCC ... 12
2.2.7. Sphere forming assay (SFA) ... 13
2.2.8. Preparation of poly-HEMA and low attachment plates ... 13
2.2.9. Methylcellulose preparation ... 13
2.2.10. General cell membrane labeling with PKH26 and CellVue® ... 14
2.2.11. Co-culture ... 14
2.2.12. Transwell assay ... 15
2.2.13. Conditioned medium preparation ... 15
2.3. Molecular methods ... 16
2.3.1. Immunocytochemical staining: Her2 staining on adhesion slides ... 16
2.3.2. Cytokeratin 8/18 staining on adhesion slides ... 16
2.3.3. Haematoxylin and eosin staining of paraffin embedded tumor tissue ... 17
2.3.4. Immunohistochemical staining of paraffin embedded tumor tissue ... 17
2.3.5. Isolation and amplification of mRNA from single spheres ... 18
2.3.6. Preparation of genomic DNA along with mRNA ... 18
2.3.7. PCR ... 18
2.3.8. Array CGH data analysis ... 19
2.3.8.1. Labeling of sample DNA (preparation for array CGH procedure) ... 19
2.3.8.2. Array comparative genomic hybridization ... 20
2.3.8.3. Processing and analysis of the aCGH data ... 20
2.3.8.4. Cluster analysis ... 21
2.3.9. Genomic DNA preparation ... 21
Materials: ... 21
Antibodies ... 21
Buffers and solutions... 22
Cell culture media ... 23
Cell lines ... 24
Consumables ... 24
Enzyme, growth factors and Development system ... 24
Equipment ... 26
Kits ... 27
Oligonucleotides and Primers ... 27
Software ... 28
List of Abbreviations ... 28
3. Results ... 30
3.1. Prostate bone marrow DCC and tumor cell culture ... 30
3.2. Identifying in vitro DCC culture conditions using BALB-neuT breast cancer mouse model ... 31
3.2.1. Establishing protocol for generating mammospheres ... 32
3.2.2. Increase in the cell density increases sphere number but not the frequency of sphere forming cells ... 33
3.2.3. Effect of hyper Interleukin-6 (HIL-6) on mammosphere formation... 34
3.2.4. GRO-α and HIL-6 on mammospheres generation ... 35
3.3. Mammary epithelial cells but not the freshly isolated fibroblasts generate spheres ... 37
3.4. In vitro propagation of murine bone marrow derived DCC ... 39
3.5. Effect of bone marrow cells on the sphere forming efficiency of epithelial cells . 41 3.5.1 Coculture of bone marrow cells with TMECs ... 41
3.5.2 Effect of BM conditioned medium on sphere forming ability of TMECs ... 43
3.6. Effect of mammary epithelial cells on bone marrow DCCs ... 45
3.6.1. Mammary epithelial cells induce proliferation in bone marrow DCCs ... 45
3.6.2. PCR to confirm the identity of TBM spheres ... 47
3.7. Effect of tumor cell secreted factors on TMECs ... 48
3.7.1 Transwell assay to test the effect of secreted factors on BM DCCs ... 48
3.7.2 Cytokeratin 8 and 18 staining of the transplanted bone marrow ... 51
3.7.3. EpCAM, Her2 and Sca-1 cells from the bone marrow have the ability to form spheres in a transwell assay ... 51
3.7.4. CK 8/18 staining of the BM-Tr of EpCAM, Her2 and Sca-1 fractions ... 53
3.7.5. PCR to confirm the identity of spheres from the BM of transplanted mice .. 54
3.8. In vivo tumorigenicity of spheres generated from the transwell assays ... 54
3.9. Generation of DCC cell lines ... 55
3.9.1. Establishing a method to generate cell lines in vitro from mammary epithelial cells of BALB-neuT mouse ... 56
3.9.2. Generation of cell lines from tumors derived from transplanted DCC spheres ... 58
3.10. Staining tumors and cells derived from in vivo transplanted spheres ... 59
3.10.1. Immunohistochemical staining of paraffin embedded tumors with CK8/18 and Her2 ... 59
3.10.2. CK8/18 and Her2 staining of tumor cells and cell lines on adhesion slides 60 3.11. Her2 transgene PCR of tumor cell and DCC cell lines ... 61
3.12. Genomic aberration of cell lines by array comparative genomic hybridization ... 61
3.13. Cluster analysis of all the cell lines based on the aCGH data ... 63
3.14. DCCs from BALB-neuT also form spheres in the presence of TMECs in a transwell setup ... 64
4. Discussion. ... 67
4.1. Mammosphere assay and bone marrow culture ... 67
4.1.1. Mammosphere assay ... 67
4.1.2. Bone marrow DCC culture ... 69
4.2. Functional and molecular characterization of the in vitro activated DCCs ... 72
6. References ... 75
7. Acknowledgements... 79
1
Summary
Metastasis is the major cause of death of cancer patients. Accumulating evidence suggest that metastatic dissemination is an early event. The presence of disseminated cancer cells (DCCs) in patients has been shown to increase the risk of disease recurrence. How the DCCs survive, the underlying factors or events that awaken DCCs are currently discussed and investigated and are fundamental to the understanding of cancer biology. This thesis explores the possibilities to propagate DCCs in vitro, and generate cell lines which could later be used for such functional studies.
At first, patient-derived prostate tumor tissue was used to identify in vitro conditions for propagating prostate tumor cells as spheres. Later these conditions were used to propagate bone marrow (BM)-derived DCCs from prostate cancer patients. Although the prostate tumor cells grew as spheres BM-DCCs failed to grow under these conditions. A similar observation was made in BALB-neuT mice, a breast cancer model. However, the sphere conditions for culturing mammary epithelial cells were first optimized with cytokines HIL-6 (hyper IL-6) and GRO-α (growth related oncogene α) which were shown to induce proliferation. In addition, DCC density was increased by enriching DCCs with antibodies against EpCAM, Her2 and Sca-1 (EHS). However, these conditions failed to initiate proliferation in DCCs. These results indicated that the conditions optimal for generating mammospheres from MEC were not optimal for DCC culture. Examining the effect of BM cells on primary tumor cells suggested that BM cells exerted a suppressive effect. Reduction in the sphere forming efficiency of tumor cells in medium conditioned by BM of normal or tumor bearing mice suggested a role for BM cell secreted factors in tumor cell growth suppression. On the other hand, primary tumor cells had a growth-promoting effect on BM-DCCs. Tumor cells were able to induce growth of DCC derived spheres in direct co-cultures through intercellular interactions and in transwells through secreted factors. The DCC derived spheres were tumorigenic in vivo and the tumor cells isolated from these tumors could further be expanded in vitro as cell lines. The tumors and the DCC cell lines expressed CK8/18 and Her2 and displayed an aberrant genomic profile. These cell lines could further be used to elucidate DCC biology.
2
1. Introduction
1.1. Metastasis and disseminated cancer cells
Metastasis is a leading cause of death in patients suffering from cancer. Cells from the primary tumor that disseminate to distant organs are thought to comprise metastatic founder cells which later develop into manifest metastasis. Studies have shown that the persistence of disseminated cancer cells (DCC) in the bone marrow of breast and prostate cancer patients predicted poor survival and an increased risk of disease relapse (Weckermann, Muller et al. 2001; Braun, Vogl et al. 2005). In a pooled study of patients diagnosed with breast cancer published recently by Janni and colleagues, 676 women diagnosed with early stages of breast cancer were followed for a median of 89 months with bone marrow (BM) aspirations performed 37 months after diagnosis (Janni, Vogl et al. 2011). The authors observed that at follow- up 15.5% (105) of total patients had DCCs and 8% of the total patients had metastasis. In patients with metastasis, 35% of them had DCCs in the BM. An increase of DCC frequency from 15.5% of total to 35% in metastatic patients suggests an enrichment of DCCs in patients with metastasis. This further suggests that DCCs contain a population of cells with a potential to metastasize and emphasize the importance of DCCs in later arising metastasis. Nevertheless, patients with DCCs in BM had a significantly shorter disease free or overall survival. A previous study on cytokeratin positive (CK+) DCCs in BM of breast cancer patients also made similar observations. (Bidard, Vincent-Salomon et al. 2008). Again the presence of DCCs correlated to poorer distant metastasis free and overall survival in the patients. Although DCCs originate from primary tumor there exists a genetic disparity between them. Studies comparing genomic aberrations between DCCs and matched primary tumors showed that DCCs were less aberrant than the primary tumors and they shared very few aberrations with them (Schmidt-Kittler, Ragg et al.
2003). Moreover, studies in both breast cancer mouse models and in human breast cancers have shown that metastatic dissemination of cancer cells happen early during tumor progression (Husemann, Geigl et al. 2008). The process of early dissemination has been suggested in a review through parallel progression model (Klein 2009). This model suggests that cancer cells disseminate early, and at the time of dissemination the DCCs carry few genetic aberrations compared to primary
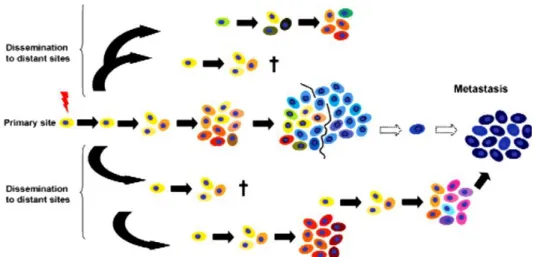
3 tumor. The DCCs then accumulate additional aberrations, independent of the genetic evolution of the primary tumor which later forms metastasis (figure 1). This early dissemination model could explain why many patients even after resection of the primary tumor and treatment develop metastasis years after surgery. Although cancer cell dissemination is an early and frequent event, successful metastatic initiation is accomplished only by a few cells at the distant metastatic site. In BM, about 1-10 DCCs per 2 million BM cells can be detected (Klein 2009). Although this number is very low, there could be thousands of DCCs when the whole bone marrow is considered. Still, only a few manifest metastases arise from these cells suggesting that metastatic initiation in most of the cells is inefficient.
Figure 1: Models explaining cancer cell dissemination.
Parallel progression model states that metastatic dissemination occurs at an early stage during the development of cancer and evolves along with the primary tumor at distant site and later forms overt metastasis even in the absence of primary tumor (Klein 2004).
1.2. Molecular mechanisms involved in metastasis
Metastatic dissemination is a multi-step process. First, the cells in the primary tumor must attain a migratory phenotype followed by invasion of the local vasculature, extravasation at the distant metastatic sites and finally colonize and adapt to the surrounding metastatic niche microenvironment before developing into manifest metastasis (figure 2) (Nguyen, Bos et al. 2009). For prostate and breast cancers the preferred site of dissemination is bone marrow. In mouse models, it has been shown that the prostate cancer cells home to bone marrow niches which are traditionally
4 occupied by the hematopoietic stem cells (Shiozawa, Pedersen et al. 2011). Although the factors involved in the niche formation are still unknown, chemokine factor CXCL12 (Stromal derived factor-1) which interacts through CXCR4 and CXCR7 receptors, was shown to act as a chemo attractant guiding the DCC to bone marrow metastatic niches in breast cancer (Mukherjee and Zhao 2013). Additionally, vascular endothelial growth factor (VEGF) in the niche microenvironment has been shown to play a role in tumor cell adhesion. (Shiozawa, Pedersen et al. ; Kaplan, Riba et al.
2005; Kaplan, Rafii et al. 2006). In the bone marrow, VEGFR1+ hematopoietic progenitor cells and osteoblasts are shown to initiate pre-metastatic niche formation (Kaplan, Riba et al. 2005; Kaplan, Psaila et al. 2007). Although the process of dissemination and the DCC niches in the bone marrow are known, the events that trigger the switch from quiescence to proliferation or the factors responsible for the activation of DCC in the distant metastatic niches years after curative surgery still remain elusive. Over the years, identifying factors responsible for the activation of DCC has become a challenge and the lack of success has hindered our understanding of these cells and events that lead to their activation. Although several chemokines (Viola, Sarukhan et al. 2012) and cytokines (Rao, Dyer et al. 2006; Culig 2011) have been shown to play a role in aiding tumor progression none were shown to have a direct impact on DCC activation.
Figure 2. Process of metastatic dissemination of cancer cells.
The cells in the primary tumor first gain a migratory phenotype and later invade the local vasculature. Once they reach a distant metastatic site the cells extravasate out of the
5 vasculature into the secondary organ, adapt to the surrounding microenvironment of the metastatic niche and later develop into manifest metastasis. (Figure adapted and modified from (Allan, Vantyghem et al. 2006-2007))
1.3. Detecting circulating and disseminated cancer cells
Epithelial markers like cytokeratins and epithelial cell adhesion molecule (EpCAM) are routinely used to identify and isolate DCC but they might not be efficient in capturing all the DCCs. The property of cancer cells to disseminate from the primary tumor site to the distant metastatic site is attributed to their ability to undergo epithelial-to-mesenchymal transition (EMT) (Hollier, Evans et al. 2009). Furthermore, recent studies have indicated that during EMT these disseminating cells down regulate EpCAM suggesting that these cells escape detection methods relying on these epithelial markers (Mikolajczyk, Millar et al. 2011; Gorges, Tinhofer et al. 2012).
Proliferative potential of CTC in the blood has been used as an alternative method to identify and isolate these cells on collagen adhesion matrix, in prostate cancer patients (Paris, Kobayashi et al. 2009). However, these patients already had metastasis implying that the DCCs were already activated and proliferating. It would be interesting to see if DCC from non metastatic patients also respond similarly. PCR based methods have also been employed in identifying both DCCs and CTCs in peripheral blood and BM of cancer patients. RT-PCR has been used to measure the mRNA for CK19, CK20 and mammoglobin for identifying breast cancer DCCs (Schoenfeld, Kruger et al. 1997; Berois, Varangot et al. 2000; Zhong, Kaul et al.
2000; Bossolasco, Ricci et al. 2002), PSA for prostate cancer DCCs (Halabi, Small et al. 2003) and CEA, MUC1, TIFF in addition to CK20 for gastric cancer DCCs (Dardaei, Shahsavani et al. 2011). The problem with RT-PCR based methods is the availability of DNA or mRNA in low amounts. Genomic and transcriptomic analysis of single DCCs have been established to identify tumor cells based on an aberrant genomic profile (Klein, Schmidt-Kittler et al. 1999; Klein, Seidl et al. 2002). This method overcomes the problem of low mRNA and DNA amounts encountered in the RT-PCR based methods but then, identification of DCCs is still dependant on epithelial markers (cytokeratins and EpCAM). However, another problem with PCR based methods is that the functional properties of the isolated DCCs cannot be evaluated. Since, only a few DCCs are capable of initiating metastasis analyzing their
6 functional capabilities is also important. Therefore, an in vitro model to study DCCs is essential.
1.4. In vitro culture of disseminated cancer cells
It has been a challenge over the years to propagate DCCs in vitro. This could be due to their presence in low numbers or because the conditions to propagate DCCs in vitro are still unknown. However, there have been made attempts to culture DCCs in vitro. In the studies published by Pantel and colleagues, cell lines were generated from DCCs isolated from the bone marrow of prostate, breast, colon esophageal and lung cancer patients. However, the possibility of generating DCC cell lines was achieved only after immortalizing the surviving DCCs with SV40 large T antigen (Pantel, Dickmanns et al. 1995; Putz, Witter et al. 1999; Hosch, Kraus et al. 2000).
SV40 large T antigen is known to interfere with the general cellular process of a cell.
It interacts with several cellular pathways to transform and immortalize the cells.
(Ahuja, Saenz-Robles et al. 2005). These cell lines, as the author states, were not assessed for any collateral effects caused by SV40 large T antigen induced transformation. SV40 large T antigen is shown to bind to the tumor suppressor proteins retinoblastoma family of tumor suppressors and p53 to transform the cells (Ahuja, Saenz-Robles et al. 2005). Therefore, the possibility of results from these cell lines in various experiments could be mediated via large T antigen and may be different to normal cells which do not contain the large T antigen. Thus, it is important to expand DCC in vitro without any induced transformation and immortalization.
DCCs from prostate cancer were shown to occupy hematopoietic stem cell niches in the bone marrow (Shiozawa, Pedersen et al. 2011). Moreover, recently in breast cancer also it has been shown that DCCs reside in perivascular niches (Ghajar, Peinado et al. 2013) and perivascular niches are shown to maintain hematopoietic stem cells (Ding, Saunders et al. 2012). This could suggest that the DCCs might share some similarities with the stem cells and therefore, may require different conditions to propagate them in vitro. In the last decade, in vitro culture techniques have been developed to culture stem/progenitor cells. In breast cancer, it has been shown that suspension or non adherent cultures enrich for stem/progenitor cells, grown as spheres called mammospheres (Dontu, Abdallah et al. 2003). Therefore, it
7 would be worthwhile to test these stem/progenitor enriching in vitro culture conditions and see if the bone marrow derived DCCs proliferate in these conditions.
1.5. The BALB-neuT mouse model
Since, patient BM derived DCCs are very rare and variable about 1-10 per 2 million BM cells (Riethdorf, Wikman et al. 2008), we looked at mouse models where DCCs have been reported to be lodging in the BM at a higher frequency. BALB-neuT is a transgenic mouse which develops breast cancers and is a commonly used mouse model to study breast cancer. Integrated into the genome of the mouse the construct consists of a MMTV LTR (Mouse mammary tumor virus, long terminal repeats) region which is transcriptionally active, the neuT oncogene and SV40 polyA recognition sequence (Muller, Sinn et al. 1988). The origin of the oncogene neuT is from the rat and is the corresponding homologue of human Her2. This gene contains a point mutation, at position 664 of the amino acid sequence valine is replaced with glutamine which induces neuroblastoma in the rat. This mutation is in the transmembrane region of the receptor and results in more than 100-fold increase in the receptor kinase activity. Moreover this mutant protein is phosphorylated to a higher degree when compared to the wild type protein (Bargmann and Weinberg 1988). The MMTV promoter responds to estrogen and progesterone and is activated at the onset of puberty in female mice. Disseminated cancer cells can be identified in the bone marrow of BALB-neuT by staining the bone marrow cells with cytokeratin 8/18 (CK8/18), a marker for epithelial cells. The DCCs in the bone marrow of the mice can be identified as early as week 4. The number of DCCs in the bone marrow of this mouse is between 4-20 cells per million bone marrow cells. DCCs were detected in the bone marrow even before tumor became palpable. In the transplanted mouse model, where the recipient wild type mice (BALB/c) received orthotropic transplants from their 3-4 week old transgenic siblings (BALB-neuT), DCCs were also detected. However, the number of DCCs detected in the transplanted mice in comparison to the BALB-neuT was lower. The reason could be due to the presence of 10 mammary glands in the transgenic mouse against 1 gland from the transgenic mouse in the wild type recipient (Husemann, Geigl et al. 2008).
Thus, BALB-neuT breast cancer mouse model seemed appropriate for studying DCCs in the current doctoral project.
8
Aim of the project
Disseminated cancer cells have been difficult to culture in vitro. Hence, the knowledge about these cells is limited. Although their persistence in patients even after surgery is associated with high risk of relapse, the reasons for their activation and the factors responsible for their activation is not known. The problems in evaluating DCCs are that they are rare, there are no reliable markers for identifying them and last but certainly not the least there are no in vitro models to elucidate them functionally. Therefore, knowing the conditions to expand them in vitro and availability of in vitro models are critical in further evaluating DCCs.
The aim of this project was to first identify conditions to propagate bone marrow derived DCC in vitro, then analyze the functional and molecular characteristics of the activated DCCs and finally expand them in vitro to generate cell lines. These cell lines could then serve as models for further understanding DCC biology.
9
2. Methods
2.1. Mouse experiments
All mouse experiments were performed at the animal facility of the University of Regensburg. The application to work with BALB/c and BALB-neuT mice for the research projects was approved by the Government of Upper Bavaria (Az.209.1/211- 2531-108/04).
2.2. Cell culture methods
2.2.1. Processing patient bone marrow
After obtaining informed consent from the patient, bone marrow aspirates were washed with Hanks buffer salt solution (HBSS) and centrifuged at 200xg for 10 min to remove fat and thrombocytes. The supernatant was discarded and cell pellet was resuspended in 9 ml of HBSS and slowly added on top of percoll 60% (6 ml) and centrifuged at 1000xg for 20 min, to remove erythrocytes and granulocytes. The interphase was transferred to a new 50 ml tube. The tube was filled with PBS and centrifuged at 500xg for 10 min. The pellet was resuspended in 2-10 ml PBS depending on the size of the pellet. Erythrocytes and leukocytes in the percoll fraction were counted. The cells were centrifuged at 500xg for 10 min, the pellet was resuspended in MACS buffer (90 µl/107 cells) and incubated with anti-CD11b (10 µl/107 leukocytes), anti-CD33 (5 µl/107 leukocytes) and anti-CD45 (5 µl/107 leukocytes) antibody conjugated to anti-APC on a roller for 15 min at 4° C. The cells were washed by adding 10 volumes of MACS buffer and centrifuged at 500xg for 5 min at 4° C. The supernatant was removed and the pellet was resuspended in MACS buffer (60 µl/107 cells) and incubated with anti-APC-beads (20 µl/107 leukocytes) and anti-Gly A beads (20 µl/107 erythrocytes) for 15 min on a roller at 4° C. The cells were washed with 10 volumes of MACS buffer and centrifuged for 5 min at 500xg.
The pellet was resuspended in 2 ml of MACS buffer, filtered through 40 µm mesh to remove cell clusters and then loaded onto the magnetic column already equilibrated with 3 ml MACS buffer. The tube was washed with 9 ml MACS buffer which was run
10 over the column in aliquots of 3 ml. The cells in the flow-through (11 ml) were counted.
2.2.2. Culturing bone marrow DCC of patients
After magnetic sorting, 200000 cells/ml were seeded in sphere medium (see materials, Media for prostate sphere medium) in a 6 cm dish and incubated for 4 weeks at 37° C, 5.5% CO2 and 7% O2. The culture dishes were replenished with 1 ml of fresh medium every week until the cultures were terminated. The bone marrow culture dishes were screened every week for spheres.
2.2.3. Mammary tissue digestion and epithelial cell isolation
The mice were killed by asphyxiation with CO2 or by cervical dislocation. Mammary glands were collected either from BALB/c or BALB-neuT in a 50 ml tube with PBS.
The tissue was minced with surgical blades to small pieces and digested in basal medium (DMEM/F12, 100 nM HEPES buffer, 10 mg/ml insulin, 0.5% BSA and 0.5x penicillin/streptomycin) with 200 U/ml collagenase, 10 ng/ml EGF and 200 U/ml hyaluronidase. The tissue was digested for 2-3 hours at 37° C in the incubator mixed every 1 hour. The digested tissue was transferred to a 50 ml tube. After a first centrifugation step of 1 min at 80xg to isolate the organoids the supernatant was collected into a new 50 ml tube and centrifuged at 200xg for 3 min to isolate mammary epithelial cells (MEC). Subsequently, the supernatant was transferred into a new 50 ml tube and centrifuged at 350xg for 4 min to isolate fibroblasts (figure 3).
The organoids were either frozen in a freezing medium containing 10% DMSO and 50% FCS in DMEM/F12 or further digested to isolate single cells.
11 Figure 3: Schematic representation of epithelial cell isolation from murine mammary glands.
The mammary tissue is minced with a scalpel to small pieces, enzymatically digested and afterwards epithelial cells are isolated by differential centrifugation at 200xg for 3 min. The isolated epithelial cells were later cultured in non-adherent serum-free conditions to generate mammospheres.
2.2.4. Preparation of single cells from organoids
Freshly isolated or frozen organoids were used for isolation of epithelial cells. If frozen, the organoids were first thawed and transferred into 15 ml tube with 4 ml of pre-warmed basal medium. The tube was centrifuged at 40xg for 2 min at room temperature (RT) and the supernatant was discarded. Fresh or thawed organoids were resuspended in 3 ml of trypsin-EDTA and incubated for 1 min at RT. The suspension was carefully and slowly mixed for 2 min with a 5 ml pipette along the tube wall avoiding formation of bubbles. Then, 5 ml of trypsin neutralizing solution (TNS) were added, incubated for 1 min and centrifuged at 300xg for 3 min at RT. The supernatant was discarded and the pellet was resuspended in 3 ml of freshly prepared dispase (5 mg/ml) and 200 µl of 1 mg/ml DNase solution. The suspension was mixed using a 5 ml pipette along the tube wall for 2 min. Additional 200 µl of DNase solution was added, if the solution was thick suggesting release of DNA, and mixed for another 1 min. The suspension was filtered through a 40 µm mesh to remove any large cell clusters. The flow-through was centrifuged at 300xg for 3 min
12 at RT. After washing in 5 ml of 1x PBS the pellet was resuspended in 2-5 ml of PBS (depending on the pellet size) and viable cells were counted on a Neubar chamber.
2.2.5. Isolating cells from murine bone marrow
Tibias and femurs were collected either from BALB/c or BALB-neuT in PBS or basal medium. The soft tissue surrounding the bones was removed. One of the bone ends was cut with scissors to expose the bone marrow. Using a 26G needle and 1 ml syringe the bone marrow was flushed out into a 50 ml tube. Alternatively, for some experiments the flushed bones were put into a mortar to break the bones using mortar and pestle. The broken bones were washed with 1x PBS to collect the remaining bone marrow cells after flushing. Afterwards, the cells were pooled and centrifuged at 200xg for 10 min. The supernatant was discarded and the pellet was resuspended in 9 ml of 1x PBS. The cell suspension was slowly and carefully overlaid onto 6ml of 65% percoll in a 15 ml tube to form a layer and centrifuged for 20 min at 1000xg to remove erythrocytes. The interphase was then carefully collected using a 5 ml pipette and transferred into a new 50 ml tube. The tube was filled up with 1x PBS and centrifuged for 10 min at 500xg for washing the cells. The cells were resuspended in 5 ml of 1x PBS and counted.
2.2.6. Enrichment of bone marrow DCC
The bone marrow cells were enriched for EpCAM, Her2 and Sca-1 (EHS) after density centrifugation. After counting, the cells were centrifuged for 10 min at 400xg.
Supernatant was discarded and the cell pellet was resuspended in MACS buffer (100 µl / 107 cells). Primary antibodies anti-EpCAM-bio (10 µg/ml), anti-Her2 (10 µg/ml) and anti-Sca-1-FITC (10 µl/107 cells)were added and incubated for 15 min at 4° C on a roller. After incubation, 10 volumes of MACS buffer were added and centrifuged for 10 min at 400xg. Supernatant was discarded and the pellet was resuspended in 4 volumes of MACS buffer containing anti-biotin, anti-IgG2a+b and anti-FITC magnetic microbeads and incubated for 15 min at 4° C on a roller. After incubation 10 volumes of MACS buffer was added and centrifuged for 10 min at 400xg. The procedure for sorting the cells on the columns is as explained in 2.2.1. All cells bound by magnetic
13 microbeads stick to the magnetic column and the rest flow though the column. After carefully transferring the column with positive fraction to a 15 ml tube, 5 ml of MACS buffer were added to the column and cells were flushed out into the tube. The negative fraction was again run through the column and the positive fraction collected in the tube with the 1st positive fraction.
2.2.7. Sphere forming assay (SFA)
Epithelial cells isolated from digested murine mammary glands or tumors were seeded under non adherent conditions in poly-HEMA-coated plates to generate spheres. The cells were seeded at a density of 50000 cells/ml for co-cultures in sphere medium (SM), with 10 ng/ml EGF, 10 ng/ml bFGF, 4 µg/ml heparin, 20 ng/ml hyper-IL-6, 5 ng/ml GRO-α and 1x B27 in basal medium. In experiments involving optimization or for studying the effect of conditioned medium on cells, the cells were seeded at a density of 10000 cells/ml. For control experiments only EGF, bFGF and heparin were added to the basal medium. The culture plates were incubated in a cell culture incubator at 37°C in atmosphere containing 5.5% CO2 and 7% O2.
2.2.8. Preparation of poly-HEMA and low attachment plates
To prepare coating solution, 2.4 g of poly-hydroxy-ethyl-methyl-acrylate (Poly-HEMA) were added to 20 ml of 95% ethanol and put on a shaker at 65° C to dissolve for ~8 hours. To the above dissolved poly-HEMA, 80 ml of 95% ethanol was added and mixed. The prepared solution could be stored indefinitely at 4° C. Poly-HEMA solution was added to the cell culture dishes at a final density of 0.8 mg/cm (w/v). The plates were dried overnight in a sterile hood with lids slightly opened. The poly-HEMA- coated plates can be stored indefinitely until use at +4°C.
2.2.9. Methylcellulose preparation
Medium with methylcellulose (MC) was prepared to culture bone marrow cells in vitro. Methocel was used as a thickening agent in sphere cultures to limit the lateral
14 movement and thereby aggregation of cells. A stock solution of 1% MC was prepared and diluted to 0.2% in sphere medium for culturing bone marrow cells. Briefly, 1 g of MC was added to 20 ml of boiling basal medium and mixed on a magnetic stirrer for 2 hours at 95° C. Eighty ml of cold basal medium was added and allowed to dissolve overnight at 4° C on a magnetic stirrer. The medium was collected into an ultracentrifuge tube and centrifuged for 30 min at 7500xg to remove any undissolved MC. The medium was transferred into a 50 ml tube leaving the pellet at stored at 4°
C. The medium with MC is stable for 4 weeks.
2.2.10. General cell membrane labeling with PKH26 and CellVue®
PKH26 (PKH) and CellVue (CV) are general cell membrane labeling dyes. PKH26 is visible under Cy3 and CV under Cy5 filter. Cells prepared from BM, MEC or cell lines were centrifuged at 400xg for 5 min in a 50 ml tube. The cells were washed once in 1x PBS or serum free medium to remove any traces of serum. The supernatant was discarded and the cell pellet was resuspended in 1 ml Diluent C. Immediately, before staining 1 µl of PKH or 2 µl of CV were added to 999 µl or 998 µl of Diluent C solution respectively. The dye solution was added to the cell suspension, mixed gently and incubated for 5 min. The staining reaction was stopped by adding 2 ml of 20% BSA for 1 min and centrifuged at 400xg for 10 min. After discarding the supernatant, the pellet was resuspended in medium containing BSA, transferred to a new 50 ml tube and centrifuged for 10 min at 400xg. The cells were washed 3 times with BSA containing medium to remove unbound dye and counted on a Neubauer chamber.
2.2.11. Co-culture
Mammary epithelial cells (MEC) isolated from BALB/c or BALB-neuT were cultured with BALB-neuT bone marrow cells enriched for EHS (see 2.2.6). The mammary epithelial cells were stained with CellVue and EHS-fraction with PKH26 (see 2.2.10).
The cells were seeded in a poly-HEMA-coated 6 cm dish in 5 ml sphere medium.
MECs were seeded at a density of 50000 cells/ml together with 200000 cells/ml of EHS and incubated at 37° C, 5.5% CO2 and 7% O2. The cultures were replenished with fresh medium every week until they were terminated.
15 2.2.12. Transwell assay
Transwell plates are cell culture dishes with a transwell insert. The insert has a microporous (0.4 µm) membrane which separates the dish in to upper (UC) and lower compartments (LC). The microporous membrane allows only soluble factors to pass through between the compartments (figure 4). In the UC 50000 cells/ml of MECs or 10000 cells/ml of cell lines were seeded. The cells in the UC were stained with PKH26. In the lower chamber 100000 cells/ml EHS cells were seeded in sphere medium containing 0.2% methylcellulose. The medium was changed once every week for the first two weeks and after the second week the medium was changed every third day. For screening or changing medium, the upper chamber was carefully removed and placed in a new petri dish with 5 ml basal medium. After screening or changing medium the upper chamber was carefully placed back in the transwell dish.
This was done to avoid any spillage of cells in the upper chamber while transporting the plates to the microscope or while changing the medium in the upper chambers.
Figure 4: Transwell assay experimental setup
The transwell assay is divided into an upper and a lower compartment by a microporous membrane. Transwells can be used to study the effect of two different cell types on each other. The pore size of the membrane used for the experiments in this study is 0.4 µm which allows only soluble factors to pass through the membrane. The upper chamber contains primary mammary cells or cell lines stained with PKH26 and the lower chamber contains BM cells enriched for EHS. MEC: Mammary epithelial cells.
2.2.13. Conditioned medium preparation
After density centrifugation, 200000 cells/ml of bone marrow cells from BALB/c, BALB-neuT or NSG mice were seeded in basal medium supplemented with EGF (5 ng/ml), bFGF (5 ng/ml), heparin (4 µg/ml) and B27. After 3 days the cultures were
16 collected in a 50 ml tube and centrifuged for 10 min at 1000xg to pellet the cells. The supernatant was sterile filtered through a 0.22 µm filter to remove any cells in the conditioned medium. The medium was used immediately or stored at -80° C until further use.
2.3. Molecular methods
2.3.1. Immunocytochemical staining: Her2 staining on adhesion slides
Bone marrow (BM) cells on the adhesion slides were taken out of -20°C and thawed for 20 min. Blocking solution (5% mouse serum in 1x TBS) was added to the slides to rehydrate the cells and to block unspecific binding of antibodies to the cells. After 20 min the blocking solution was discarded and primary antibody against Her2 (table 1) was added and incubated for 60 min. The primary antibody was discarded and the slides were washed 3 times for 3 min in 1x TBS. The slides were incubated with the secondary antibody (table 1) for 25 min and washed 3 times for 3 min each in 1x TBS followed by incubation with avidin-biotin complex (ABC) coupled with alkaline phosphatase (AB/AP system) for 25 min. Finally, the development system of the BCIP/NBT for alkaline phosphatase enzymatic substrate was added for 10 min. The slides were washed 3 times for 3 min and screened for Her2 positive cells. The positive cells were typically violet-to-black in color. TUBO, a tumor cell line derived from a murine primary mammary tumor of BALB-neuT which expresses Her2, was used as a positive control. For antibodies and concentrations used, please refer to table 1.
2.3.2. Cytokeratin 8/18 staining on adhesion slides
The procedure for CK8/18 staining of cells on adhesion slides is as explained in 2.3.1, except for the antibodies (table 1). TUBO cells express CK8/18 and were used as a positive control.
17 Table 1: List of antibodies used for immunocyto- and immunohisto chemical staining against CK8/18 and Her2.
Antigen Against Conjugate Source Isotype Conc. Product code c-erbB-2
(Her2-neu)
Mouse,Rat,
Human Rabbit IgG 5 µg/ml 29D8
IgG Rabbit Biotin Goat IgG 5.5 µg/ml D-111-065-144
Cytokeratin 8/18
Mouse,Rat, Human
Guinea
pig IgG 1:200 GP11
IgG Guinea pig Biotin Goat IgG 1.6 µg/ml D-106-065-003
2.3.3. Haematoxylin and eosin staining of paraffin embedded tumor tissue Paraffin embedded tumor tissue was cut into 5 µm sections onto a slide. The sections were deparfinized in Xylol for 10 min twice and rehydrated first in 100%
ethanol for 3 min and then in 80% ethanol for 3 min. The sections were washed in 1x PBS for 1 min thrice and incubated with hematoxylin for 45 sec. The slides were rinsed in tap water for a short duration and washed in tap water for 30 min in a glass cuvette. Eosin (0.1%)was added to the tissue sections and after 2 min they were washed with ddH2O for 1 min. The stained sections were dehydrated in 70% ethanol for 2 min, 100% ethanol for 2 min and finally in xylol for 15 min. Mounting gel was added to the tissue sections and a cover slip was placed carefully on the gel avoiding bubbles and were left to dry overnight.
2.3.4. Immunohistochemical staining of paraffin embedded tumor tissue Paraffin tissue sections were stained for CK 8/18 or Her2. Briefly, the paraffin slides were rehydrated as explained in 2.3.3. Antigen retrieval was performed by boiling the slides in microwave oven for 2 min and cooling for 2-3 min at RT and was repeated 5 times. After the slides were washed 3 times in 1x PBS for 1 min, they were incubated in 3% H2O2 and methanol for 30 min at RT to neutralize endogenous peroxidase activity. After washing thrice in 1x PBS for 1 min, tissue sections were blocked with 5% goat serum for 30 min. The sections were incubated with primary antibody (table
18 1) for 60 min and washed with 1x PBS 3 times for 1 min. After incubating with secondary Ab for 30 min, the slides were washed in 1x PBS once for 3 min and incubated with ABC-HRP for 30 min. The ABC-HRP was washed with 1x PBS 3 times for 3 min, DAB development system was added and incubated for 5 min. The slides were first washed 3 times in PBS, once in ddH2O for 2 min and counter-stained with haematoxylin for 3 mins. Haematoxylin was discarded and washed for 2 min first with ddH2O, then with tap water and again with ddH2O. The slides were dehydrated gradually in 80% and 100% ethanol for 3 min each and in xylol for 10 mins. Mounting gel was added to the slides and was left overnight to dry.
2.3.5. Isolation and amplification of mRNA from single spheres
The mammospheres from NMEC and TMEC cultures were picked with a 2 µl pipette tip in 1 µl volume of the medium using a microscope. For co-cultures, single PKH positive spheres were picked. The isolated spheres were added to a 4 µl lysis buffer with 0.4 µl tRNA and stored at -20° C.
Isolation and amplification of mRNA was performed as published. (Hartmann and Klein 2006).
2.3.6. Preparation of genomic DNA along with mRNA
Using Ampl1™ kit from Silicon Biosystems, genomic DNA was prepared from the supernatants collected during mRNA isolation from single cells.
2.3.7. PCR
To identify samples carrying the rat Her2 transgene, PCRs were performed on the genomic DNA isolated from spheres, tumor cells or cell lines. Transgene specific primers were added to the PCR reaction mixture along with the DNA to amplify the rat Her2 transgene.
The contents of the PCR reaction were as follows:
19 Primers used for amplification of Her2 transgene were:
2.3.8. Array CGH data analysis
The array-CGH (aCGH) was performed on Agilent microarrays and the data was analyzed using Agilent Workbench 6.5®. The aberration algorithm used was ADM-2.
2.3.8.1. Labeling of sample DNA (preparation for array CGH procedure) Test and reference DNA were labeled with SureTag DNA Labeling Kit (Agilent) according to the manufacturer’s instructions. Briefly, 1.5 - 2.0 µg of purified input DNA (WGA product of unamplified genomic DNA) was supplemented with 5 µl of Random Primer Mix and filled up with H2O to 31 µl. Samples were denatured at 95◦C for 10 or 3 min in the case of unamplified DNA and WGA products, respectively.
Sample tubes were transferred to ice and incubated for 5 min. The labeling reaction with exo-Klenow fragment consisted of: 31 µl of denatured template DNA, 10 µl of 5x
20 reaction buffer, 5.0 µl of 10x dNTP mix, 3.0 µl of Cy5-dUTP (test) or Cy3-dUTP (reference) and 1.0 µl of Exo(-) Klenow fragment. For all the experiments gender- matched test and reference samples were used. The labeling reaction was run at 37◦ C for two hours followed by inactivation at 65◦C for 10 min.
Labeled DNA was purified using Ultra 0.5 purification system (30 kDa – cut-off).
Briefly, DNA samples were supplemented with water to a total volume of 480 µl and applied on the purification column. Samples were centrifuged for 10 min at 14000xg.
Following removal of the flow-through 480 µl of H2O was applied on the column and samples were centrifuged again (10 min, 14000xg). Spin columns were removed from the spin column assembly, inverted and placed in fresh collection tube. DNA was collected by centrifugation for 1 min at 1000xg at room temperature. The quantity of purified DNA was assessed using Nano Drop ND-1000 instrument.
2.3.8.2. Array comparative genomic hybridization
Array CGH was performed on oligonucleotide-based SurePrint G3 Mouse CGH 4x180K microarray slides (design code: 027411) according to the protocol provided by the manufacturer (Agilent Technologies) with slight modifications. Hybridization mix was comprised of 5.0 µg of Mouse Cot1-DNA (Invitrogen), 11 µl of 10x Blocking Reagent (Agilent Technologies) and 55 µl of 2x Hi RPM hybridization buffer. The hybridization mix was mixed with 19 µl of test and reference DNA and applied on the array. Hybridization was carried out at 65°C for 24 h after which, they were washed twice for 2:30 min in Oligo aCGH/ChIP-on-Chip wash buffer 1 at room temperature, twice for 30 sec in Oligo aCGH/ChIP-on-Chip Wash Buffer 2 at 37◦ C. Washed slides were immersed in acetonitrile to remove all remaining traces of the wash buffers and were later scanned using an Agilent Microarray Scanner Type C.
2.3.8.3. Processing and analysis of the aCGH data
Microarray TIFF files were processed and quantified with the Agilent Genomic Feature Extraction Software (version 10.7). The resulting SHP files were imported and analyzed with Agilent Genomic Workbench Software (version 6.5 Lite or 7.0).
21 Aberrant regions were recognized using ADM-2 algorithm with a threshold set to 6.5.
To avoid detection of false positive aberration calls, aberration filters were applied to define the minimum log2 ratio (0.2 and 0.3 for unamplified DNA and WGA products, respectively) and the minimum number of probes in the aberrant interval (5 and 10 for unamplified DNA and WGA products, respectively).
2.3.8.4. Cluster analysis
Cluster analysis was performed using Euclidean distance based on the aCGH data of the cell lines. This clustering feature was provided in the Workbench 6.5® by Agilent.
2.3.9. Genomic DNA preparation
The genomic DNA was isolated using Qiagen QIAmp DNA mini kit according to the manufacturer’s instructions.
Materials:
Antibodies
Reagents Manufacturer
29D8 (anti-Neu/-HER-2) Cell signaling BA-9500 (anti-goat-IgG; Biotin) Vector Laboratories D-106-065-003 (anti-goat-IgG; Biotin) Dianova
D-106-165-003 (anti-goat-IgG; Cy3) Dianova D-111-065-144 (anti-rabbit-IgG; Biotin) Dianova DLN-12082 (anti-c-erbB-2/-HER-2/-neu) Dianova G8.8-Bio (anti-EpCAM; Biotin) Biolegend GP11 (anti-cytokeratin 8/18) Progen
Microbeads (anti-IgG2a+b) Miltenyi Biotech Microbeads (anti-biotin) Miltenyi Biotech Microbeads (anti-FITC) Miltenyi Biotech Sca-1- (anti-mouse Sca-1:FITC) Miltenyi Biotech
22 Buffers and solutions
Solutions Composition
20x SSC (Saline–Sodium Citrate) 0,3 M sodium citrate
3 M NaCl
70 % ethanol
70 ml 100% ethanol
30 ml water
85 % ethanol l
85 ml 100% ethanol
15 ml Water
Hematoxylin 2 g haematoxylin
0,4 g sodium iodate
100 g aluminium potassium sulfate
100 g chloralhydrate
2 g citric acid
Differentiative epitthelial medium RPMI medium without L-glutamine
10 % FCS
200 U/mL penicillin
200 U/mL streptomycin
2 mM L-glutamine
PBS (Phosphate Buffer saline) 8,5 mM Na2HPO4
2 mM KH2PO4 NaCl
150 mM NaCl
pH 7,4
PCR-buffer + dNTPs 100 mM Tris-HCl
500 mM KCl
10 mM MgCl2
1 mM of each nucleotide
TBE-buffer, pH 8,3 89 mM TRIS
89 mM boric acid
2 mM EDTANa2
TE-Puffer, pH 7,4 10 mM TRIS-HCl
1 mM EDTA
23 Cell culture media
Solutions Composition Final conc
Basal medium 500 ml DMEM/F12
5 ml HEPES buffer 100 nM
5 mlPen/Strep 1x
BSA 0.5%
500 µl Insulin 5 µg/ml
Sphere medium (primary culture) 48.8 ml basal medium
1 ml B27 1x
50 µl EGF 10 ng/ml
50 µl heparin 4 µg/ml
20 µl bFGF 10 ng/ml
25 µl GRO-α 5 ng/ml
10 µl HIL-6 20 ng/ml
Sphere medium (BM transwell) 38.8 ml basal medium
10 ml 1% metthylcellulose 0.2%
1 ml B27 1x
50 µl EGF 10 ng/ml
50 µl heparin 4 µg/ml
20 µl bFGF 10 ng/ml
25 µl GRO-α 5 ng/ml
10 µl HIL-6 20 ng/ml
Sphere medium (cell lines) 48.8 ml basal medium
1 ml B27 1x
50 µl EGF 10 ng/ml
50 µl heparin 4 µg/ml
20 µl bFGF 10 ng/ml
TUBO medium to 500 ml DMEM
100 ml FCS 20%
5 ml 2mM L-glutamine 1x
C3HT101/2 medium to 500 ml DMEM
25 ml FCS 5%
5 ml 2mM L-glutamine 1x
DCC cell line medium 500 ml RPMI 1640
24
50 ml FCS 10%
5 ml 2mM L-glutamine 1x
5 ml Pen/Strep 1x
Cell lines
Consumables
Product Manufacturer Catalog#
Adhesion slides Roth H8701
Filter (0.22 μm) Roth P666.1
Syringe needles (26G) Braun C7181
Cell culture plates Schubert and Weiss, OMNILAB FALC351007
Cell culture flasks Sarsted 831.810.302
Glass slides Langenbrinc 03-0001
6 well plates Greine 657160
Reaction tubes 1,5 ml CLN Gmb CLN-BÖT1.5
Reaction tubes 0,2 ml Abgen AB-0337
Transwell plates (10 cm) Cornin 3419
Enzyme, growth factors and Development system
Product Manufacturer Catalog #
2-Log DNA-Ladder 1kb NEB N32005
AB/AP-System DAKO AK-5000
AB/HRP-System DAKO PK-4000
Material Origin
TUBO Cell line from BALB-neuT primary tumor.
C3HT101/2
mouse embryonic fibroblasts (received from Prof. John Stingl, Cambridge University, Cambridge, UK)
Immortalised fibroblast
mouse fibroblasts (received from Prof. Robert Weinberg, Whitehead Institute, MA, USA )
NIH3T3 mouse embryonic fibroblasts
25
AB-Serum Bio-Rad 805315
Agarose Sigma-Aldrich A3038
B27 Invitrogen 17504-44
BCIP/NBT BioRad 1706432
bFGF Sigma-Aldrich F0291
BSA Roche 1071145001
CellVue® Sigma-Aldrich, MINICLATER-1KT
Collagenase Type I CellSystems biotech LS4196
DAB DAKO K3468
DEPC-H2O Invitrogen 750023
Diluent C Sigma-Aldrich CGDIL-6x10 ml
Dispase Invitrogen D4818
DMEM Pan-Biotech P04-03500
DMEM/F12 Pan-Biotech P04-41500
EGF Sigma-Aldrich E9644
Eosin Sigma-Aldrich 54802
Ethanol absolute J.T. Baker 8006
Ethidium bromide (1 %) Sigma-Aldrich E8751
Eukitt (Mounting gel) Sigma-Aldrich 03989-100ML Expand Long Template
Enzyme Mix Roche 11 759 060 001
FCS PAN Biotech P30-3702
Goat serum DAKO X0907
GRO-α RnDsystems 275GR
Hematoxylin Sigma-Aldrich MHS16
Heparin Sigma-Aldrich H3149
Hyaluronidase Type IV-S Sigma-Aldrich H4272
Igepal Sigma-Aldrich I3021-50ML
Insulin Sigma-Aldrich I9278
Isopropanol Fluka 59300-2.5ML
Levamasol Sigma-Aldrich L9756
L-Glutamin (200 mM) Pan-Biotech P04-80100
Matrigel BD Biosciences 356231
Methanol VW 1.06009.2500
26
Methyl cellulose Sigma-Aldrich M0512-100G
Mouse serum DAKO X0910
Mse I 50 U/μl New England Biolabs R0525M
OPA Plus Amersham Biosciences, 27-0901-02
Panscript Taq-
Polymerase PAN Biotec MB-30010250
Paraformaldehyde VW 104005
Penicillin/Streptomycin
(10 U/μL) Pan-Biotech P1-010
Percolll Amersham Biosciences 17089102
PKH26 Sigma-Aldrich MINI26-1KT
Polyhema Sigma-Aldrich P3932
Proteinase K Roche 03115828001
RPMI 1640 Pan-Biotech P05-17500
Sodium citrate Sigma-Aldrich 73894-100ML
T4 DNA Ligase Roche 10799009001
Tween 20 Sigma-Aldrich P9416
Xylol Roth 9713.3
Equipment
Instrument Manufacturer
Cell culture incubator Heraeus
Flourescence microscope Leica
Heat block thermo mixer 5436, Eppendorf
Inverted microscope Leica
Refrigerated centrifuge Eppendorf
Micromanipulator Microinjector 5242, Eppendorf MJResearch Peltier Thermal Cycler PTC-
200 Bio-Rad
Voltmeter EPS 200, Pharmacia Biotech
UV-screen INTAS
Video camera INTAS
27
Water bath Memmert
Centrifuge Eppendorf
Cytospin centrifuge Hettich
Dissection tools for mouse Heiland
Kits
Kits used Manufacturer
Ampli 1™ Silicon Biosystems
PKH26 general cell membrane labeling Sigma-Aldrich CelVue general cell membrane
labeling Sigma-Aldrich
QIAmp DNA mini kit Qiagen
SureTag DNA Labeling Kit Agilent technologies SurePrint G3 Mouse CGH 4x180K
microarray slides Agilent technologies
Oligonucleotides and Primers
All oligonucleotides and primers were manufactured by Metabion, Munich.
Primer Sequence
ddMse11 TAA CTG ACA G-ddC
Her2 AT 5’ CAG ATT GTC TCA CCA GGT G
Her2 AT 3’ CTC ATT GCT ATT CCA AAT GCC
Her2 GG 5’ GAG ACG CTC AAC CTC AA TTG
Her2 GG 3’ GGC ACT TGT TGG TCT GTA G
LIB1 AGT GGG ATT CCT GCT GTC AGT
Transgene 5’ (MTV) GTA ACA CAG GCA GAT GTA GG
Transgene 3’ (BRL) ATC GGT GAT GTC GGC GAT AT
28 Software
Product Manufacturer
Axiovision Ver.4.8 Carl-Zeiss GmbH
Graphpad® Graphpad software Inc.
Agilent Workbench 6.5 Agilent technologies
List of Abbreviations
In this work, internationally accepted chemical symbols and abbreviations of SI units (Système International d`Unités) were used.
Ab Anti body
bp Base pair
BCIP
5-Bromo-4-chloroindol-3-ol dihydrogen phosphate ester mono-p-toluidinium salt
BM Bone marrow
BM-Tr Bone marrow of transplanted mouse
BSA Bovine serum albumin
bFGF Basic fibroblast growth factor
cDNA Complementary deoxyribonucleic acid
aCGH Array comparative genomic hybridization
CM Conditioned medium
CK Cytokeratin
CSC Cancer stem cell
DCC Disseminated cancer cell
ddH2O Deionized distilled water
DNA Deoxyribonucleic acid
DMSO Dimethyl sulphoxide
EGF Epidermal growth factor
EpCAM Epithelial cell adhesion molecule
EHS EpCAM, Her2 and Sca-1 enriched
FCS Fetal calf serum
29
FITC Fluorescein isothiocyanate
GRO-α Growth related oncogene-alpha
HE Haematoxylin-Eosin
ICC Immunocytochemistry
IgG Immunoglobulin G
IHC Immunohistochemistry
HIL-6 Hyper-interleukin-6
MEC Mammary epithelial cells
MMTV Mouse-mammary tumor virus
MRD Minimal residual disease
NBM Normal bone marrow
NMEC Normal mammary epithelial cells
NSG
NOD scid IL2 receptor gamma chain knockout mouse
NSG BM NSG mouse bone marrow
PBS Phosphate buffer saline
PCR Polymerase chain reaction
PFA Para-formaldehyde
RKI Robert Koch Institute
RT Room temperature
Sca-1 Stem cell antigen-1
SDF-1 Stromal derived factor-1
SM Sphere medium
StM Standard medium
SV40 Simian Virus 40
TBM Tumor bone marrow
TBS Tris buffer saline
TMEC Tumor mammary epithelial cells
TW Transwell
UV Ultra violet
WT, wt Wild type
30
3. Results
The main aim of this study was to establish 1) in vitro culture conditions to propagate and expand bone marrow derived disseminated cancer cells (DCC) and 2) to establish in vitro DCC cell line model to study DCCs.
3.1. Prostate bone marrow DCC and tumor cell culture
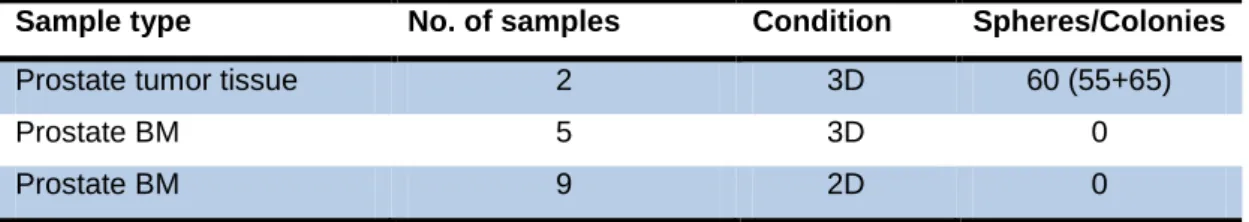
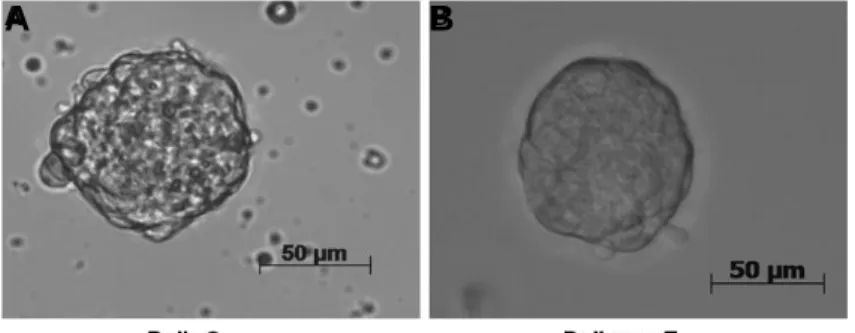
The first aim of my doctoral thesis was to identify and establish conditions to culture DCCs in vitro. I first tested the standard conditions, used in sphere culture to generate prostatospheres from tumor cells of prostate cancer patients. Single cells were isolated from the tumor tissues and seeded in basal medium (see materials buffers and solutions) supplemented with EGF, bFGF and B27 at a density of 10000 cells/ml. Cultures were observed for spheres after 7 days and spheres with a diameter of 50 µm and above were counted (figure 5). An average of 60 prostatospheres was counted in the sphere cultures. These conditions were then used to culture DCCs from the bone marrow (BM) of prostate cancer patients. DCCs from the BM of prostate cancer patients cultured in sphere conditions did not generate any spheres. We then cultured the patient BM in adherent conditions to see whether attachment could initiate growth in the DCCs. The cultures were screened for adherent colonies but this condition also failed to initiate growth in DCCs (table 2).
Although, in bone marrow 3D cultures there were some sphere-like structures they never grew beyond 20 µm even after 4 weeks in culture.
Figure 5: Bone marrow and prostate tissue of patients in culture.
A) Prostatosphere from single cells isolated from prostate tumor tissue of prostate cancer patients post surgery. 10000 cells/ml were seeded and cultured for 7 days and spheres > 50 µm were counted and B) sphere-like structure in the prostate cancer patient bone marrow cultures prostate cancer patients. The BM cells were cultured for 4 weeks at a density of 200000 cells/ml. Although sphere-like structures appeared in the BM cultures they never exceeded 20 µm.
31 Table 2: Bone marrow and tumor tissue of prostate cancer patients in culture.
Sample type No. of samples Condition Spheres/Colonies
Prostate tumor tissue 2 3D 60 (55+65)
Prostate BM 5 3D 0
Prostate BM 9 2D 0
3D cultures were screened for spheres and 2D cultures were screened for adherent colonies.
2D: adherent and 3D: non adherent or suspension cultures.
When the patient bone marrow was cultured the positivity of the sample for the DCCs or the number of DCCs in the positive samples was not known. So, in order to know the number of DCCs that went in to culture, patient BM was stained with EpCAM (epithelial cell adhesion molecule) or CK8/18 (cytokeratin 8 and 18) epithelial markers to identify the DCCs (table 3).
Table 3: EpCAM and CK8/18 status of patient BM samples.
Sample Id Condition EpCAM (per 106) CK 8/18 (per 106)
PC-272 2D n.a Negative
PC-277 2D Negative n.a
PC-280 2D n.a Negative
PC-284 2D n.a Negative
PC-298 2D n.a 1
PC-316 2D n.a 3
PC-324 2D n.a Negative
PC-325 2D n.a Negative
PC-326 2D Negative Negative
PC-816 3D 2 1
PC-826 3D 5 Negative
PC-831 3D 2 Negative
PC-838 3D 4 Negative
PC-901 3D 6 n.a
n.a=not assessed. 2D: adherent and 3D: non adherent or suspension cultures.
3.2. Identifying in vitro DCC culture conditions using BALB-neuT breast cancer mouse model
Patient bone marrow samples were highly variable with respect to the number of samples positive for DCCs and the number of DCCs per positive sample (table 3).
32 Moreover, there is variability between prostate cancer patients also . Thus, we used the BALB-neuT breast cancer mouse model. In BALB-neuT mice DCCs can be detected in bone marrow (BM) by cytokeratin 8/18 (CK8/18) staining from week 4 at a frequency of 1-10 per 5x10⁵ BM cells. The Workflow of the experiments involving BALB-neuT BM DCC culture is shown below in figure 6.
Figure 6: Workflow of the project.
Mammosphere assay was first established using mammary epithelial cells isolated from the mammary glands of normal or tumor tissue and was later optimized. The optimized conditions were then applied to the BM cells enriched for EpCAM, Her2 and Sca-1 from tumor bearing mice to culture DCCs in vitro. Since the DCCs failed to grow in mammosphere conditions the possible suppressive effect of BM cells on mammary cells was tested in coculture or monoculture. Eventually, the supportive effect of mammary epithelial cells was also tested in both mono- and coculture experiments. Spheres formed in coculture experiments were later characterized molecularly and functionally and then expanded in vitro to generate cell lines.
3.2.1. Establishing protocol for generating mammospheres
Formation of spheres from mammary epithelial cells (MEC) isolated from mammary glands of both normal (BALB/c, wild type) and transgenic (BALB-neuT) mice was first tested to establish a working protocol for generating mammospheres. Epithelial cells isolated from mammary glands of either BALB/c or BALB-neuT were cultured under non adherent conditions to generate spheres as mentioned in materials and methods (2.2.3). The cells were seeded standard sphere medium (StM) (see Materials for buffers and solutions) supplemented with growth factors EGF, bFGF, which are the
33 standard growth factors used for sphere culture, along with B27 supplement, a serum replacement used for the survival of cells under non adherent conditions (Liao, Zhang et al. 2007). The cells were cultured at a density of 10000 per ml for 7-10 days and subsequently spheres with a diameter of 50 µm and above were counted (figure 7). These basic conditions were subsequently modified.
Figure 7: Sphere forming assay.
Mammospheres from mammary epithelial cells isolated from A. BALB/c and B. BALB-neuT.
Spheres 50 µm in diameter or above were counted. Number of cells seeded for mammosphere generation was 10000 cells/ml in standard growth factors; EGF, bFGF along with B27 supplement, a serum replacement used in suspension cultures.
3.2.2. Increase in the cell density increases sphere number but not the frequency of sphere forming cells
To examine if increase in cell density increases the frequency of sphere forming epithelial cells, normal or tumor MEC was seeded at different cell densities. Cells were seeded at 10000, 25000, 50000 and 100000 cells/ml in 5 ml of StM, and spheres were counted after one week. The frequency of sphere forming cells per 1000 cells was higher at 25000 cells/ml for TMEC and 10000 cells/ml for NMEC (figure 8 A). The frequency of sphere forming cells decreased with the increase in cell density for both NMEC and TMEC. The reduction in the frequency of sphere forming cells was mainly due to the aggregation of cells at higher densities. As seen in figure 8B, with the increase in density the number of clusters also increased especially in TMEC sphere cultures. The cell clusters were more prominent at 100000 cells/ml (figure 8C). The number of clusters was highest at a density of 100000 cells/ml which may have resulted in the decrease of both the frequency of sphere forming cells and the number of spheres. The TMEC compared to NMEC produced more than twice the number of spheres in culture. These results indicate that cell density in cultures
A B