Bachelorarbeit
im Studiengang Umweltwissenschaften Zur Erlangung des Grades
Bachelor of Science (B.Sc.)
Seasonal biochemical composition of the pelagic
tunicate Salpa thompsoni
vorgelegt von: Laura Niemeyer
Betreuende Gutachterin: Prof. Dr. Bettina Meyer Zweiter Gutachter: Dr. Sven Rohde
Praktische Betreuung: Dr. Wiebke Weßels
Oldenburg, 15.04.2019
Table of contents
Table of contents ... I Abbreviations ... II Table of figures ... IV Zusammenfassung ... V Summary ... VI
1. Introduction ... 1
1.1 Salpidae ... 1
1.2 Salpa thompsoni Foxton, 1961 ... 3
1.3 Biochemical activity ... 4
1.4 Aims of my thesis ... 6
2. Material and Methods ... 7
2.1 Sampling area ... 7
2.2. Analytical work ... 8
2.2.1 Determination of protein content ... 9
2.2.2 Determination of total carbohydrate ... 9
2.2.3 Determination of glycogen ... 9
2.2.2 Enzyme analysis ... 10
2.3 Statistical analysis ... 12
3. Results ... 13
3.1 Does Salpa thompsoni show seasonal differences in biochemical activity? ... 13
3.1.1 Body composition ... 13
3.1.2 Salpa thompsoni: seasonal enzyme activity ... 14
3.2 Differ the two life history stages, aggregates and solitaries, in their biochemical composition and enzyme activity between seasons? ... 14
3.2.1 Biochemical body composition ... 15
3.2.2 Enzyme activity ... 16
4. Discussion ... 17
4.1 Seasonal effect ... 17
4.2 Life history effect ... 19
5. Conclusion and Outlook ... 21
References ... VII
Annex ... X
Danksagung ... XV
Eidesstattliche Erklärung ... XVI
Abbreviations
ANOVA Analysis of variance
°C Temperature in degree Celsius
DM Dry mass
EDTA 2,2‘,2“,2“‘-(Ethane-1,2-diyldinitrilo)tetraacetic acid
e.g. For example (exempli gratia)
E. superba Euphausia superba
et al. And others (et alii)
fig. Figure
g Gravitational acceleration
h Hour
HOAD 3-hydroxyl-CoA dehydrogenase
IKMT Isaac-Kidd Midwater Trawl
L Litre
m Metre
mm Mili-(10#$) metre
mbar Mili-(10#$) bar
mM Mili-(10#$) molar
MDH Malate dehydrogenase
µg Micro-(10#%) gram
µl Micro-(10#%) litre
µM Micro-(10#%) molar
µmol Micro-(10#%) mol
mU Mili-(10#$) U (specific activity)
nm Wavelength in nanometre
NADH Nicotinamide adenine dinucleotide
OAL Oral-atrial-length
PCA Perchlorid acid
pH Potentia Hydrogenii
PSU Practical salinity unit
RMT Rectangular Midwater Trawl
RV Research vessel
s Second (unit of time)
S. thompsoni Salpa thompsoni
TCA Tricarboxylic acid cycle
TRA Triethanolmine/HCL buffer
UV-Vis Ultraviolet visible light
Table of figures
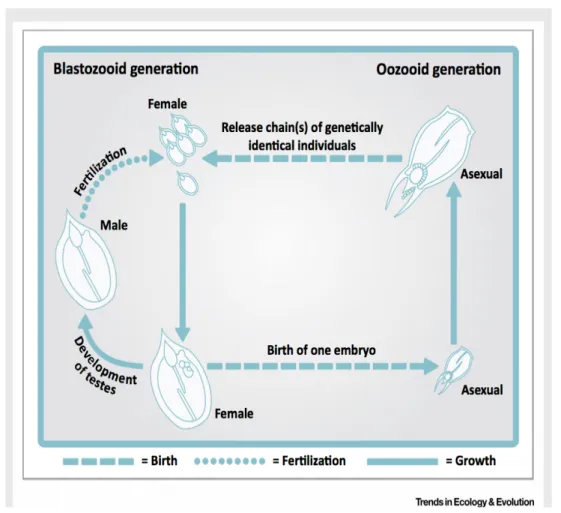
Figure 1: Life cycle of a salp (Thalia democratica), demonstrating asexual reproducing oozooid generations (solitaries) and sexual reproducing
blastozooid generations (aggregates) (Henschke et al., 2016). ... 3 Figure 2: Pathways of metabolites from stored energy storages (underlined). * indicates enzymes which were measured in the present study. ... 5 Figure 3: Location plot of Salpa thompsoni sampling sites in the Southern Ocean in summer (2012), autumn (2018) and winter (2016). Blue dots mark sampled stations. ... 7 Figure 4: A) Salpa thompsoni in solitary stage with white aggregate chain of genetically identical individuals. On the right underneath the chain the gut is shown in orange. Photo credit: Larry Madin, © Woods Hole Oceanographic Institution. B) Salpa thompsoni in solitary stage. Arrows on the right show oral- atrial-length, M numbers indicate body muscle bands (Loeb and Santora, 2012). ... 8 Figure 5: Glycogen pellets under nitrogen stream in laboratory with extractor fan. ... 10 Figure 6: A) Total proteins, B) total carbohydrate and C) glycogen content in S. thompsoni over summer, autumn and winter. * indicates significant
difference, p < 0.05. ... 13 Figure 7: Seasonal activity (summer, autumn and winter) of A) catabolic
enzyme HOAD and B) anabolic enzyme MDH in mU/mg protein in S.
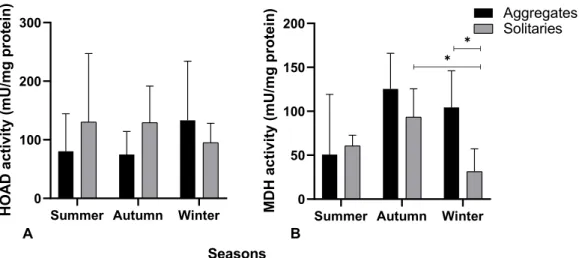
thompsoni. ... 14 Figure 8: A) Total proteins, B) total carbohydrate and C) glycogen content in S. thompsoni over summer, autumn and winter with main focus on differences between both reproductive stages. * indicates significant difference between aggregate and solitaries, p < 0.05. ... 15 Figure 9: Seasonal activity (summer, autumn and winter) of A) catabolic
enzyme HOAD and B) anabolic enzyme MDH in mU/mg protein in S.
thompsoni with main focus on life history stage differences. * indicates
significant differences, p < 0.05. ... 16
Zusammenfassung
Salpen sind pelagische Tunikaten, die weltweit in den Meeren zu finden sind. Sie ernähren sich herbivor in dem sie die Nährstoffe aus dem Wasser filtern und sich zeitgleich durch den Ausstoß des Wassers vorwärts bewegen. Aufgrund ihrer Filtriereigenschaften sind sie in der Lage effizient kleine Nährstoffpellets in größere schnell sinkende Pellets zu verarbeiten, die den an der Meeresoberfläche gebundenen Kohlenstoff auf den Meeresboden transportieren. Es hat sich gezeigt, dass insbesondere die Salpenart Salpa thompsoni (Foxton, 1961) durch den genannten Transport von Nährstoffen auf den Meeresboden eine wichtige Schlüsselfunktion in der Versorgung von benthischen Lebewesen einnimmt. Die stetig steigende Erderwärmung und der damit einhergehende Rückgang des antarktischen Meereises zeigen Korrelationen mit abnehmenden Krillbeständen und steigenden Salpenpopulationen. Desweiteren wurde ein Eindringen der Salpen in südlichere Habitate beobachtet. Dennoch ist generell noch nicht geklärt, inwieweit Salpen auf saisonale und temperaturbedingte Veränderungen reagieren und ob oder wie sie überwintern. Im Zuge dieser Bachelorarbeit gilt es zu klären, inwieweit sich der Stoffwechsel der Salpa thompsoni im Übergang von Sommer zu Winter verändert.
Dazu wurden Salpen auf ihre biochemische Zusammensetzung untersucht, die im Sommer 2012/2013, im Winter 2016 und im Herbst 2018 in der Antarktis gefangen und unmittelbar nach Vermessung eingefroren wurden. Anhand von durchgeführten Laboranalysen können saisonale Veränderungen in den Energiereserven in Form von Proteinen, Gesamtkohlenhydraten, Glykogen und in den metabolischen Enzymen Malate dehydrogenase (MDH) sowie 3-hydroxyl-CoA dehydrogenase (HOAD) nachgewiesen werden. Insbesondere der Glykogen Gehalt in den S. thompsoni Proben zeigt einen signifikanten Anstieg von Sommer zu Winter. Der Fokus der zweiten Forschungsfrage beruht auf dem Unterschied der beiden Lebensstadien der Salpen und deren biochemischen Körperzusammensetzung. Salpa thompsoni, wie alle Tunikaten, kommen entweder als asexuell reproduzierende Einzeltiere (Oozoide) vor oder im Kettenzusammenschluss (Blastozoide), die sich sexuell fortpflanzen. Die Ergebnisse der Laboranalysen ergeben, dass es sowohl saisonale Unterschiede innerhalb der beiden Stadien aber auch signifikante Unterschiede zwischen den beiden Lebensstadien gibt. Auffällig sind die Ergebnisse der gemessenen MDH Aktivität im Winter, die signifikant höhere Werte für Blastozoide zeigen im Vergleich zu den Oozoiden. Zusätzlich zeigen sich innerhalb der Oozoide signifikant sinkende Werte von Herbst auf Winter, welches auf eine metabolische Verlangsamung im Winter schließen lässt.
Summary
Salps are pelagic tunicates, which have been observed in marine habitats worldwide.
They are omnivorous filter feeders filtering water for nutrition while swimming by contracting their circular muscle bands and pumping water trough their oral siphon.
By filtering water for nutrition salps produce large, fast-sinking pellets, which are dense and rich in carbon, nitrogen, phosphorous and trace elements. Next to their significant role in the marine biological pump by exporting particulate carbon from surface waters to the seafloor, it has been shown that especially the salp species Salpa thompsoni (Foxton, 1961) is considered to be an important link between surface production and benthic communities.
Continuous global warming and the accompanied decrease of sea ice cover in the Antarctic Ocean have been correlated to decreasing krill stocks and increasing salp populations. Furthermore, a southward shift in the distribution of S. thompsoni has been observed. However, it is still unknown how salps perform during seasonal and temperature related changes. Therefore, the first aim of my thesis is to compare possible seasonal differences in biochemical composition of S. thompsoni over the change from summer to winter. Salpa thompsoni specimen were collected in austral summer 2012/2013, in winter 2016 and in autumn 2018 in the Antarctic waters. On board of the research vessels, the salp samples were sorted and the body length was measured. Afterwards the salps were snap frozen immediately until further processing in the home institute. By analysing the energy stores (total body protein, carbohydrate and glycogen) and specific activities of the key enzymes 3-hydroxyacyl-CoA dehydrogenase (HOAD) and malate dehydrogenase (MDH) seasonal differences in body composition can be detected. Especially analysis of glycogen content in S. thompsoni specimen show a significant increase from summer to winter month.
The second part of my thesis addresses the differences in biochemical activity between both life history stages. The life cycle of Salpa thompsoni, and for all tunicates characteristic, involves two life history stages with asexual reproducing oozoids (solitaries) and the sexual reproducing blastozooids (aggregates). The results show seasonal differences within each life history stage as well as significant differences between aggregates and solitaries. Noteworthy is the MDH activity in winter, where aggregates have higher activity compared to solitaries. Additionally, solitary specimen show significant decreasing values from autumn to winter, suggesting a metabolic slow-down in winter.
1. Introduction 1.1 Salpidae
Salpidae are barrel-shaped, gelatinous marine zooplankton belonging to the subphylum Tunicata. Their cellulose-like polysaccharide based “tunic”, that encloses their body, is name giving and characteristic for all members of the subphylum
‘Tunicata’ (Deibel and Lowen, 2012).Their cellulose-like polysaccharide based “tunic”, that encloses their body, is name giving and characteristic for all members of the subphylum ‘Tunicata’. This unique body composition results in the high water content of approximately 95 % of wet weight of these animals (Acuña, 2001; Dubischar et al., 2011), creating their transparent appearance. There are 48 known species of salps with different forms and sizes, ranging from 0.5 – 190 mm (Henschke et al., 2016).
Salps can form dense swarms and have been observed in marine habitats like coastal, shelf and oceanic regions mostly associated with upwelling events or slope water intrusions linked to the occurrence of large phytoplankton blooms (Roughan and Middleton, 2002), the food source of salps.Salps, however, are prey organism of at least 202 known predators including fish, turtles, crustaceans and coral species. Salps are omnivorous filter feeders filtering water for nutrition while swimming by contracting their circular muscle bands and pumping water trough their oral siphon. While the water is passing through the body, particles from < 1 µm to 1 mm get trapped in the mucous net and then moved toward the esophagus (Sutherland et al., 2010). This is unique compared to other zooplankton species like copepods and krill that are generally limited to particles from 5 – 60 µm. While filter feeding is common strategy of marine plankton, salps have the highest filtration rate of all marine zooplankton, 15.3 mL* s-1 (Sutherland and Madin, 2010). Besides their high filtration rate, salps produce large, fast-sinking pellets up to 2,700 m day-1 (Iversen et al., 2016). These pellets are dense and rich in carbon, nitrogen, phosphorous and trace elements (e.g. Ca und Mg) (Andersen, 1986). Next to their significant role in the marine biological pump by exporting particulate carbon from surface waters to the seafloor, it has been shown that especially the salp species Salpa thompsoni (Foxton, 1961) is considered to be an important link between surface production and benthic communities.One special characteristic of salps is their life cycle that shows two life history stages (Fig. 1). On the one hand there exist sexually reproducing sequential hermaphroditic blastozooids (hereafter referred to as aggregates) and on the other hand asexually reproducing oozooids (hereafter referred to as solitaries). Mostly in spring, when temperature and food conditions are good, a solitary individual produces a stolon by asexual budding
(Iguchi and Ikeda, 2004). After strobilation of chains with genetically identical individuals (aggregates), the aggregates, which are born female, grow and give birth to one embryo after fertilization. This embryo is the start of the next solitary generation.
After the release of the embryo, female aggregates become male with the ability to fertilize further female aggregates, before dying shortly thereafter (Henschke et al., 2011). Although aggregate specimen only produce one offspring per individual, the reproduction of solitaries allows exponentially population growth. During spring and summer, solitaries release up to four chains, each with ~ 200-300 aggregate individuals, before dying. The number of aggregates per chains increases with solitary size. At the end of their life, each solitary might have produced up to 900 aggregate salps (Foxton, 1966). This life cycle involves the formation of dense salp swarms through asexually reproducing solitaries when food and temperature conditions are favorable (spring to autumn), while the sexual reproduction of aggregates maintains the genetic variability (Allredge, A.L. and Madin, L.P., 1982; Godeaux, J.E.A. et al., 1998, cited after Henschke et al., 2016; Loeb and Santora, 2012).
Figure 1: Life cycle of a salp (Thalia democratica), demonstrating asexual reproducing
oozooid generations (solitaries) and sexual reproducing blastozooid generations (aggregates) (Henschke et al., 2016).
1.2 Salpa thompsoni Foxton, 1961
Salpa thompsoni is one of the most prominent and abundant metazoan filter feeders in the Southern Ocean (Pakhomov et al., 2002). S. thompsoni shows a diel vertical migration in the water column. They are mainly concentrated between the surface and midwater layers across a temperature range of -1.5 °C and +2.0 °C with most abundance in the near of the warmer thermocline (> 0 °C) (Pakhomov et al., 2011).
Their migration to the subsurface layer starts at midday when the solar radiation is largest and ends in the phytoplankton-rich and rather bright layer at 30 – 120 m. During the night, salps move closer to the surface to feed more phytoplankton consisting mostly of diatoms (Metfies et al., 2014), while avoiding potential visual predators (Nishikawa and Atsushi, 2001).
The occurrence of Salpa thompsoni blooms in the Antarctic ecosystem can increase the grazing pressure on the daily primary production due to their fast asexual reproduction cycle.
Although S. thompsoni is usually distributed in lower and “warmer” Antarctic latitudes, in the realm of 45-55 °S (Foxton, 1966), a significantly southward shift of the population has been recorded in recent decades. This southward shift is associated with warm tongues of water penetrating south, intruding into areas generally dominated by Antarctic krill (e.g. Euphausia superba) (Atkinson et al., 2004). The presence of S.
thompsoni in krill dominated areas causes not only the competition with other zooplankton grazers like E. superba, but also adds a substantial predation pressure by consuming eggs and larval stages of other zooplankton (Loeb et al.1997; Huntley et al., 1989). E. superba is a keystone species in the Southern Ocean for higher trophic levels such as fish, squid, whales and seabirds (Everson, 2000). A possible decline in krill stock could have drastic effects on the pelagic food web due to the relative low energetic value of salps, compared to krill, for higher tropic levels (Dubischar et al., 2012). But climate change along with ocean warming and sea ice decline are more affecting a decline in krill densities. It is, however, unclear whether salp populations are able to survive in cooler high latitude waters for extended periods of time because of their hypothesized negative reproductive response to low temperatures and scarcity of food.
1.3 Biochemical activity
To understand how S. thompsoni will possibly perform under further ocean warming or further intrusion into colder regions, it is necessary to understand their physiological limits. Analysing the effect of naturally changing parameters such as seasonal variability, will give first insights into the response mechanism of S. thompsoni.
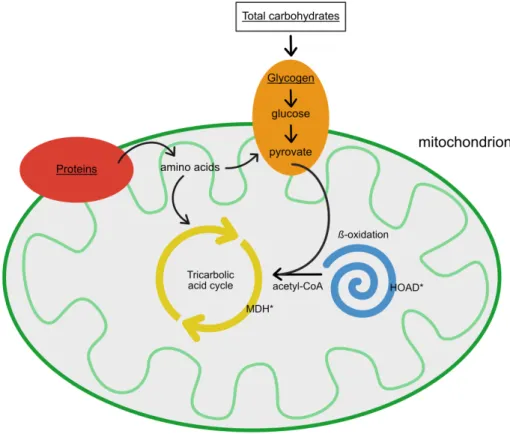
Analysis of different energy stores like total carbohydrates, glycogen and protein content can give information about metabolic processes over the seasons. Glycogen as energy storage is fast available for muscle activity and other body functions and is therefore depleted, before substantial amounts of other energy stores will be used (Vinagre and da Silva, 1992). Additionally, studies in crustaceans showed that next to their function in muscles, proteins can also be catabolised in addition to glycogen, when vast amounts of energy are required. Besides analysing the energy stores, it is useful to focus on involved pathways and thus accompanying activities of specific enzymes, giving insight into the timing of metabolic adjustment (Fig. 2).
Enzymes that are representative of important catabolic and anabolic pathways include 3-hydroxyacyl-CoA dehydrogenase (HOAD) and malate dehydrogenase (MDH) (Auerswald et al., 2009). The catabolic key enzyme HOAD catalyzes fatty acids in the
third step of ß-oxidation. The resulting acetyl-CoA is essential for further processing in the tricarboxylic acid cycle (TCA), which is a central metabolic pathway. Additionally, HOAD is proxy for lipid degradation and thus inversely related to the activity of the anabolic enzymes. The anabolic enzyme MDH catalyzes reactions in energy metabolism and in the TCA, directly. The MDH also shows high positive correlation with oxygen consumption and shuttles electrons between the cytosole and mitochondria (Freese et al., 2017; Meyer et al., 2010; Teschke et al., 2007).
Figure 2: Pathways of metabolites from stored energy storages (underlined). * indicates enzymes which were measured in the present study.
1.4 Aims of my thesis
In contrast to large amount of data about the biochemical composition of crustaceous zooplankton and their response to climate change, little is known about the pelagic tunicate S. thompsoni.
The aims of my thesis are therefore to compare possible seasonal differences in biochemical composition of S. thompsoni by analysing the energy stores (total body protein, carbohydrate and glycogen) and specific activities of the key enzymes 3- hydroxyacyl-CoA dehydrogenase (HOAD) and malate dehydrogenase (MDH).
I will address my aims by answering the following questions:
1. Does Salpa thompsoni show seasonal differences in biochemical activity?
2. Are there any differences in biochemical activity between both life history stages?
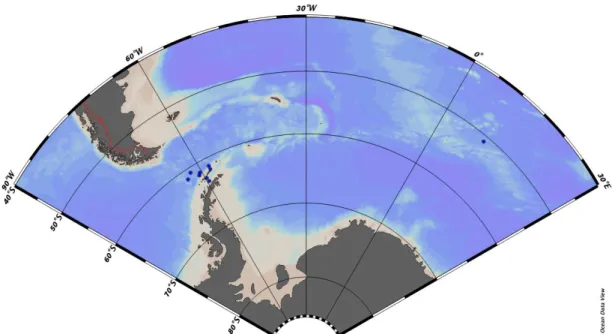
2. Material and Methods 2.1 Sampling area
Figure 3: Location plot of Salpa thompsoni sampling sites in the Southern Ocean in summer (2012), autumn (2018) and winter (2016). Blue dots mark sampled stations.
Salpa thompsoni specimens were collected during three research expeditions in Antarctic waters in austral summer 2012, winter 2016 and in autumn 2018. The study area extended from the Western Antarctic Peninsula to the Northern Lazarev Sea (Fig.
3). On board RV Polarstern (2012/2018), samples were either collected with a Rectangular Midwater Trawl (RMT 8+1) in 2012 or with an Isaac-Kidd Midwater Trawl (IKMT), in 2018. The sampling locations in 2016 were accessed by icebreaker Nathaniel B. Palmer and salps were caught by using an IKMT. Information about abiotic environmental parameters are summarized in Table 1.
Table 1: S. thompsoni demographic surveys from 2012, 2016 and 2018. n = number of salp samples.
n Season Area Date Depth
(m)
Temp (°C)
Salinity (PSU)
5 summer Lazarev Sea 18.01.2012 ~ 300 2,23 34,52
14 summer Lazarev Sea 27.01.2012 0-200 0,27 34,68
10 autumn South Shetland Island - North 04.04.2018 0-170 1,45 34,36
1 winter AMLR West 18.08.2016 0-170 -0,99 34,18
3 winter Elephant Island 15.08.2016
19.08.2016 0-170 -1,72 34,33
3 winter AMLR South 26.08.2016 0-170 -1,73 34,47
1 winter AMLR South 27.08.2016 0-171 -1,23 34,33
1 winter Gerlache 10.08.2016 0-170 -1,56 34,35
2.2. Analytical work
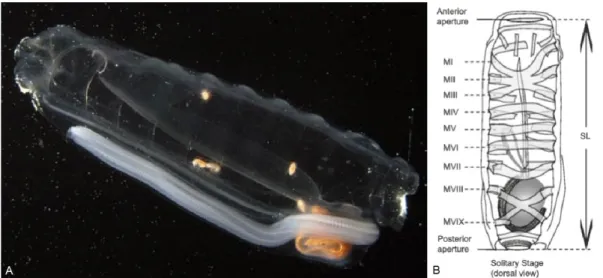
On board, salps were sorted into the two reproductive stages, solitary and aggregate stage and the oral-atrial-length (OAL, Fig. 4 B) was measured. Afterwards salps were snap frozen in liquid nitrogen and preserved at -80 °C until further processing at the home institute (Alfred-Wegener Institute, in Bremerhaven). Back in the laboratory, salps were thawed to determine the fresh weight and developmental stage in more detail according to the morphological characteristics of the embryo growth inside an aggregate body or of the stolon inside a solitary body. Before further processing, the organic parts, the gut and aggregate chains from solitary specimen (Fig. 4 A) and the gut and embryo, from aggregate specimen, respectively, were removed.
Subsequently, each salp was rinsed with distilled water to wash out remaining sea water and any organic particles. After refreezing in liquid nitrogen, the salps were placed in a pre-weighed falcon tube and their fresh weight was measured with a Sartorius CP224S electro-balance.Each salp was ground with a mortar, which was cooled with liquid nitrogen, to a homogeneous powder. Samples were freeze-dried at -55 °C and 0.95 mbar for 24 h and the dry weight was measured once all samples were lyophilized. For enzyme activity assays, total protein as well as total carbohydrate content, a solution of 1 mg dry mass (DM)/ml of ground freeze dried salp powder in 0.01 mol L-1 TRIS(HCL (pH 7.5) was prepared. For each sample, aliquots for the respective assays were prepared and stored in the freezer (-20 °C). The remaining tissue samples were stored in a desiccator for the analysis of glycogen content. All subsequent work was processed on crushed ice to keep it under controlled temperature.
Figure 4: A) Salpa thompsoni in solitary stage with white aggregate chain of genetically identical individuals. On the right underneath the chain the gut is shown in orange. Photo credit:
Larry Madin, © Woods Hole Oceanographic Institution. B) Salpa thompsoni in solitary stage.
Arrows on the right show oral-atrial-length, M numbers indicate body muscle bands (Loeb and Santora, 2012).
2.2.1 Determination of protein content
Proteins were measured with the spectrophotometer NanoDrop™ 2000 (Thermo Fisher Scentific, USA). A sample volume of 2 µl was used for each measurement using the buffer as blank.
2.2.2 Determination of total carbohydrate
Total carbohydrate content was adjusted according to Clarke et al. (1992), Dische et al. (1962) and Dubois et al. (1956). Aliquots with 50 µl homogenate were supplemented with 283 µl water, 667 µl trichloracetic acid (15%) and heated at 99 °C for 30 min by using a thermomixer comfort (Eppendorf®, Germany). To avoid high pressure during the incubation, a small hole was placed with a sharp needle in the lid. The tubes were weight before and after the incubation to calculate weight loss due to evaporation. After centrifugation (5804 r, Eppendorf® centrifuge, Germany) at 10000 ×g for 10 min at 2
°C, the duplicates of 400 µl of the supernatant were mixed with 10 µl phenol solution (80 %) and 1 ml highly concentrated sulfuric acid. The solution was mixed and heated for 10 min at 95 °C. After cooling, the absorbance was read in UV semi micro cuvettes (BRAND®, Germany) at 485 nm (Varian Cary® 50 UV-Vis spectrophotometer, Agilent Technologies, USA). A calibration curve was prepared using glucose standards (0 – 40 µg) under addition of phenol solution and sulfuric acid. Afterwards standards were treated similar to samples; mixed and heated for 10 min at 95 °C. Due to specific absorbance, measured at 485 nm, a calibration curve was generated.
2.2.3 Determination of glycogen
Glycogen content was determined according to the method described by Auerswald et al. (2009). Tissue samples were analyzed for glycogen content by precipitation processes over three days. Overnight mixtures were kept cold (2 °C) and centrifuged at every following day for 20 min at 2 °C and 4,500 ×g (Eppendorf® centrifuge, 5804 r, Germany) before further processing. Samples (1 mg dry weight) were boiled with 500 µl of potassium hydroxide (0.4 mol L-1) for 30 min at 99 °C by using a thermomixer comfort (Eppendorf®, Germany). Cooled samples were transferred into 15 ml tubes and mixed with 5 ml ethanol and stored overnight. The supernatant was carefully removed before pellets were dried for ten minutes. Followed by resuspension in 500 µl of 5 % perchloric acid (PCA). After 10 min of incubation, samples were centrifuged for 20 min at 2 °C and 4,500 ×g. The supernatant was transferred into a new tube and the extraction method with PCA repeated by adding 500 µl PCA. Both PCA extracts
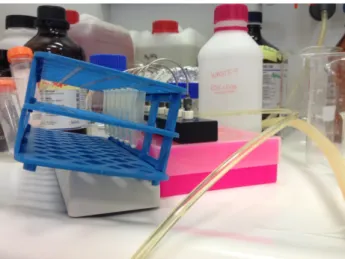
were combined and 100 µl sodium sulfate and 2,570 ml of ethanol were added. The ethanol-PCA extract was stored at 2 °C overnight. Pellets were dried under nitrogen stream for about 30 min (Fig. 5) after the supernatant was removed. The precipitate was redissolved in570 µl water. 500 µl of the solution were transferred and carefully mixed with 1,000 µl anthrone-reagent (0.2 % anthrone in concentrated sulfuric acid).
Final mixtures were heated for 30 min at 90° C (Thermomixer comfort, Eppendorf®, Germany) and cooled down afterwards. The spectrophotometric measurements were performed in UV semi micro cuvettes (BRAND®, Germany) with a Varian Cary® 50 UV-Vis spectrophotometer (Agilent Technologies, USA) at 620 nm. A calibration curve was prepared using nine different glycogen (0 – 50 µg glucose) standards, which were also mixed with 500 µl anthrone-reagent and heated with samples.
Figure 5: Glycogen pellets under nitrogen stream in laboratory with extractor fan.
2.2.2 Enzyme analysis
Activities of two different metabolic enzymes were measured in order to assess potential differences in anabolic and catabolic pathways in salps during summer, autumn and winter and their life history stages. Prior to each enzyme assay, sample extracts were centrifuged for 10 min at 2 °C and 10,000 ×g (5804 r, Eppendorf®, Germany). The change in absorbance was recorded photometric in enzyme specific period at 25 °C and 340 nm wavelengths with a Synergy HTX Multi-Mode Reader (BioTeK Instruments, USA) and the software KC4 3.4 Rev 21. For each biochemical analysis, samples were measured as triplicates.
2.2.2.1 Determination of 3-hydroxyl-CoA dehydrogenase activity (HOAD; EC 1.1.1.35) 3-hydroxyacyl-CoA dehydrogenase activity analyses were modified after Auerswald and Gäde (1999). Instead of using UV semi micro cuvettes, transparent costar® 96- well-plates (Corning Incorporated, USA) were used with a total sample volume of 200.1 µl per well. In each well 6.7 µl of nicotinamide adenine dinucleotide (NADH; 9 mM) and 6.7 µl homogenate were carefully placed apart from each other and mixed with 180 µl pre-warmed triethanolamine/HCL (TRA) buffer (107 mM, pH 7.0, supplemented with 5.35 mM EDTA). Finally the reaction was started with the addition of 6.7 µl acetoacetyl- CoA (12 mM). The kinetic reaction curve was measured for 8 min. HOAD activity was calculated as mU/mg protein using the extinction coefficient 340 for NADH 6.31 mmol L-1 cm-1.
2.2.2.2 Determination of malate dehydrogenase activity (MDH; EC 1.1.1.37)
Malate dehydrogenase (MDH) activity was determined according to Teschke et al.
(2007). The assay volume for HOAD was adjusted to be measured using 96-well plates as well. First three reagents; 6.7 µl of nicotinamide adenine dinucleotide, reduced form (NADH, 7.0 mmol L-1) and 6.7 µl of homogenate were placed separated in each well.
Complemented with 180 µl of pre-warmed reaction buffer (0.1 mol L-1 potassium phosphate, pH 7.0). The reaction was started with 6.7 µl of oxalacetate (12 mmol L-1).
The kinetic reaction curve was measured for 10 min. MDH activity was expressed as U/mg protein using the extinction coefficient & 340 for NADH 6.31 mmol L-1 cm-1. The tissue specific activity (mU/mg protein) for HOAD and MDH was calculated as followed:
()*+. -+./0/.1 2/45 )67.*/8 = ∆;
∆<.∗ >?@ABCCB
& ∗ < ∗ >DEFGHB∗ IJKFKLBMEC
& = extinction coefficient {mmol L-1 * ml * cm-1}
>?@ABCCB = total volume {ml}
>DEFGHB = total sample volume {ml}
< = cuvette diameter {cm}
IJKFKLBMEC = protein concentration in homogenate {mg/ml}
2.3 Statistical analysis
Statistical analysis and figures were generated with the Graph Pad Prism software (Version 8). Prior to statistical analysis all data were assessed for significant outliers with Graph Pad calculator (α = 0.05) (https://www.graphpad.com/quickcalcs/).
Subsequently data were tested for normal distribution using the Shapiro-Wilk test.
Brown-Forsythe and Welch’s ANOVA were used for normal distributed data to assess overall seasonal differences. For non-normally distributed data, the non-parametric Kruskal-Wallis test was used. To clarify significant differences between the seasons both test were followed by post hoc tests. Games-Howells’s multiple comparisons test was used for normal distributed data and Dunn’s multiple comparison test for non- parametric. To compare between both life history stages within each season, Welch’s t test and non-parametric Mann-Whitney test were performed for normally distributed and non-normally distributed data, respectively. When the p value was lower than 0.05, the results were considered as statistically significant.
3. Results
3.1 Does Salpa thompsoni show seasonal differences in biochemical activity?
Seasonal differences in biochemical body composition and enzyme activity of S. thompsoni specimen were determined by analyzing the body content (% of dry mass (DM)) of total proteins, total carbohydrates and glycogen as well as the specific metabolism ratio (mU/mg protein) of the anabolic enzyme Malate dehydrogenase (MDH) and the catabolic enzyme 3-Hydroxyacyl-CoA Dehydrogenase (HOAD). Values are given in means ± standard deviation.
3.1.1 Body composition
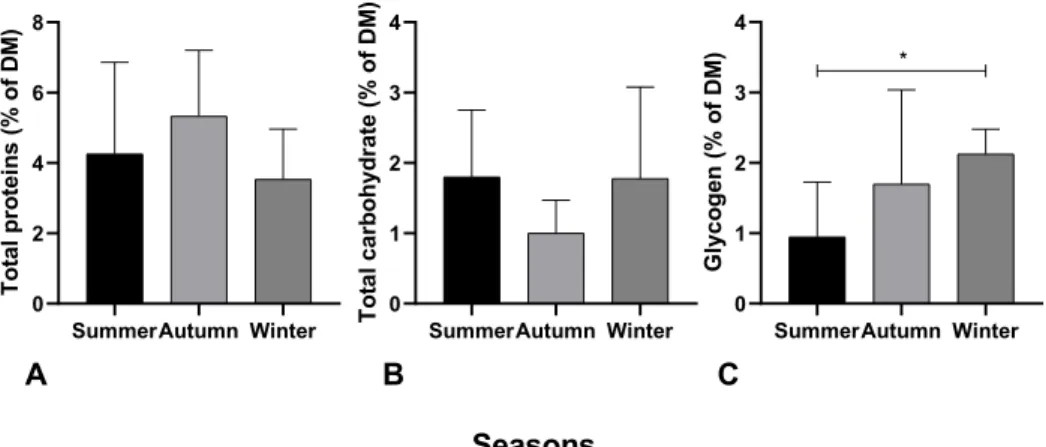
Total protein content varied slightly over season in all collected S. thompsoni samples, increasing from 4.6 % ± 2.6 in summer to up to 5.3 % ± 1.9 in autumn and then decreasing to 3.5 % ± 1.4 in winter (Fig. 6 A). The seasonal effect was, however, not significant. In summer and winter S. thompsoni, total carbohydrate content was similar, 1.8 % ± 0.9 and 1.8 % ± 1.3, respectively. In autumn samples the total carbohydrate content was slightly lower with 1.0 % ± 1.3 (Figure 6 B).
Analysis of glycogen content showed interesting results in seasonal development.
Glycogen content of summer salps of 0.9 % ± 0.8 increased to 1.7 % ± 1.3 in autumn and further up to 2.1 % ± 0.3 in winter. Glycogen content differed significantly (p = 0.0013) in summer and winter salps (Figure 6 C).
Figure 6: A) Total proteins, B) total carbohydrate and C) glycogen content in S. thompsoni over summer, autumn and winter. * indicates significant difference, p < 0.05.
SummerAutumn Winter 0
2 4 6 8
Total proteins (% of DM)
SummerAutumn Winter 0
1 2 3 4
Total carbohydrate (% of DM)
SummerAutumn Winter 0
1 2 3 4
Glycogen (% of DM) *
A B C
Seasons
3.1.2 Salpa thompsoni: seasonal enzyme activity
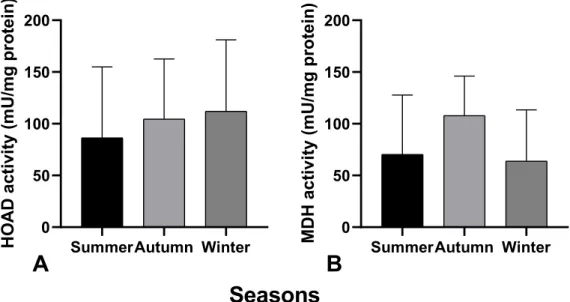
HOAD activity in S. thompsoni showed a similar seasonal trend to glycogen, increasing from 84.3 mU/mg protein ± 68.3 in summer over 104.5 mU/mg protein ± 58.0 in autumn to 112.0 mU/mg protein ± 69.0 in winter (Fig. 7 A). MDH activity analysis showed similar seasonal development compared to total protein analysis with highest trend value in autumn and lowest in winter. In summer samples MDH activity was about 70.4 mU/mg protein ± 57.4. This activity almost tripled in autumn 108.0 mU/mg protein ± 38.1. In winter, MDH activity decreased again to 63.9 mU/mg protein ± 49.6. No significant seasonal effect on HOAD and MDH activity in S. thompsoni was detected.
Figure 7: Seasonal activity (summer, autumn and winter) of A) catabolic enzyme HOAD and B) anabolic enzyme MDH in mU/mg protein in S. thompsoni.
3.2 Differ the two life history stages, aggregates and solitaries, in their biochemical composition and enzyme activity between seasons?
In order to address this question, the previously described data set was reanalyzed with separated data sets for aggregates and solitaries. The analysis focused on metabolic differences between both life history stages over the sampled seasons.
SummerAutumn Winter 0
50 100 150 200
HOAD activity (mU/mg protein)
SummerAutumn Winter 0
50 100 150 200
MDH activity (mU/mg protein)
Seasons
A B
3.2.1 Biochemical body composition
Total protein content (% of DM) showed different seasonal trends for solitaries and aggregates (Fig. 8 A). Total protein content of summer aggregates, 4.5 % ± 2.7 increased slightly in autumn up to 4.9 % ± 1.5 and decreased again in winter samples (4.3 % ± 1.7). In summer and winter the protein content of solitaries was lower than in summer aggregates, 2.7 % ± 1.7 and 2.9 % ± 0.9, respectively. In autumn, however, total protein content increased up to 7.3 % ± 4.3 in solitaries, which is about 2.5 % higher than in aggregates. Although solitaries showed clearly higher protein content in autumn the total average of protein content was still higher for aggregates (4.6 ± 2.0) than for solitaries (4.3 ± 2.3), over all seasons.
Figure 8: A) Total proteins, B) total carbohydrate and C) glycogen content in S. thompsoni over summer, autumn and winter with main focus on differences between both reproductive stages. * indicates significant difference between aggregate and solitaries, p < 0.05.
In winter, the total carbohydrate content for solitaries was two-fold higher (2.0 % ± 0.00) than in summer and autumn, 1.0 % of dry mass, whereas aggregate of S. thompsoni showed the opposite trend, total carbohydrate content was twice as high in summer (1.9 % ± 1.00) compared to autumn and winter.
The glycogen content was highest in summer solitaries (3.3 % ± 4.9), but lowest in aggregates (1.0 % ± 0.8). In autumn, the glycogen content in aggregates was significantly, four fold higher (p = 0.011), than in solitaries, 4.0 % ± 3.1 and 1.0 ± 0.6, respectively (Fig. 8 C). In winter, both, solitary and aggreagte had an equal glycogen content (2.0 % ± 0.0).
Summer Autumn Winter 0
5 10 15
total proteins (% of DM)
Summer Autumn Winter 0
1 2 3 4
Total carbohydrate (% of DM)
Summer Autumn Winter 0
2 4 6 8 10
Glycogen (% of DM) Aggregates Solitaries
✱
Seasons
A B C
3.2.2 Enzyme activity
Both life history stages showed no seasonal differences in HOAD activity between summer and autumn but solitaries showed a higher activity in these seasons than aggregates (Fig. 9 A aggregates: 130.4 mU/mg protein ± 116.7 and 129.3 mU/mg protein ± 62.2, solitaries: 80.5 mU/mg protein ± 64.0 and 74.8 mU/mg protein ± 39.4, respectively). In winter HOAD activity increased in aggregate specimen (133.1 mU/mg protein ± 101.0) and declined in solitaries (95.2 mU/mg protein ± 33.0). In general, solitary salps (118.3 mU/mg protein ± 70.6) showed higher HOAD activity than aggregate salps (96.1 mU/mg protein ± 68.1).
Figure 9: Seasonal activity (summer, autumn and winter) of A) catabolic enzyme HOAD and B) anabolic enzyme MDH in mU/mg protein in S. thompsoni with main focus on life history stage differences. * indicates significant differences, p < 0.05.
The seasonal effect on enzyme activity in aggregate and solitary Salpa thompsoni was more pronounced in MDH than in HOAD with the highest activity in autumn for both life history stages. In aggregates, MDH activity was lowest in summer (72.6 mU/mg protein ± 38.5), increased to 125.4 mU/mg protein ± 40.5 in autumn and declined again in winter (104.4 mU/mg protein ± 41.6). MDH activity in solitaries raised from 60.8 mU/mg protein ± 11.9 in summer to 93.5 mU/mg protein ± 32.1 in autumn and decreased significantly (p = 0.02) in winter (31.4 mU/mg protein ± 25.9). In winter, aggregates had a significantly (p = 0.03) higher MDH activity than solitary specimen.
Overall, aggregate salps showed higher MDH activity than solitaries, 302.41 mU/mg protein and 185.72 mU/mg protein, respectively (Fig. 9 B).
Summer Autumn Winter 0
100 200 300
HOAD activity (mU/mg protein)
Summer Autumn Winter 0
50 100 150 200
MDH activity (mU/mg protein) Aggregates Solitaries
✱
✱
Seasons
A B
4. Discussion
The first aim of this study was to compare possible seasonal differences in biochemical composition of S. thompsoni by analysing the energy storages (total body protein, carbohydrate and glycogen) and specific activities of the key enzymes 3-hydroxyacyl- CoA dehydrogenase (HOAD) and malate dehydrogenase (MDH). Additionally, the results were assessed separately to clarify possible differences in biochemical composition between both life history stages, which was the second aim of this thesis.
4.1 Seasonal effect
Total protein content varied slightly but not significant over the season in all collected S. thompsoni samples, with increasing body protein content from summer 4.6 % ± 2.6 to autumn 5.3 % ± 1.9 and lower values in winter 3.5 % ± 1.4. The seasonal dynamics of body protein suggest that S. thompsoni accumulate energy reserves in summer and autumn in preparation for winter, when phytoplankton abundances and temperature are lower in the winter month. Furthermore higher protein content in summer and autumn compared to winter could be explained by higher physiological activity in general. Data from Batta-Lona et al. (2016) showed an upregulation of genes associated with sexual reproduction in summer salps compared to spring samples.
Suggesting more sexual reproduction in summer due to higher water temperature.
On the other hand Dubischar et al. (2011) found slightly higher seasonal protein values with an increasing trend from summer to winter. However, the higher body protein content compared to this study might be related to the fact that salps from Dubischar et al. (2011) still contained their guts, whereas in this study guts were removed from animals precisely to avoid possible impact of the dense packed nutrition on the protein analysis.
Also noteworthy is that the higher body protein content in data from Dubischar et al.
(2011) might be related to the time when the salps were sampled. In this study the summer salps were sampled in the middle and at end of January whereas in the study of Dubischar et al. (2011) they were already collected in December, which was maybe still influenced by earlier phytoplankton spring blooms. The collection of winter salps in the study of Dubischar et al. (2011) took place in July and August while our samples were collected from the 10th until the 27th of August resulting in a possible utilisation of proteins for overwintering in this study.
The total carbohydrate content showed no significant change over the seasons and was in a similar range than shown in Dubischar et al. (2011). However, salps in this present study showed similar content of 1.8 % in summer and winter samples with a slightly lower content in autumn at 1.0 ± 1.3. Salp collections from Dubischar et al.
(2011) showed the highest total carbohydrate content in summer of 2.8 % ± 1.5 and similar results in autumn and winter at ~ 2.0 %. Thereby, the very low sample size (n values) within their data in summer (n = 4) and especially in winter (n = 1) for Salpa thompsoni specimen must be mentioned and at once questioning the representative quality of their results. However, seasonal trends for total carbohydrate content from this study showed similarities with lipid analysis from Dubischar et al. (2011). Further it might be noteworthy that in this present study all biochemical analyses were performed on the entire data set meaning that data for body composition and enzyme activity were obtained for each salp. That means after all biochemical analysis it was possible to compare the same individuals with almost same n values, except for statistical outliers. Due to the sample processing in Dubischar et al. (2011), it can be suggested that in their study different animals were used for different analysis.
The glycogen content in S. thompsoni increased significantly twofold from summer to winter and might be an energy storage for overwintering. Although Gaill (1980) already proved glycogen content in Tunicates, no data for salps and especially S. thompsoni on glycogen content analysis are published. The majority of previous studies focused on the total body lipids as energy reserve.
The seasonal HOAD activity measurements, which are a proxy for the activity of lipid utilisation in S. thompsoni increased slightly but not significant from summer to winter, suggesting that lipids were used during the winter season when food availability is at its lowest level.
The MDH activity almost doubled from summer to autumn and decreased in winter to activity levels lower than in summer (summer: 70.4 mU/mg protein ± 57.4, autumn:
108.0 mU/mg protein ± 38.1, winter: 63.9 mU/mg protein ± 49.6). Due to the knowledge that MDH can be used as proxy for overall metabolism (Freese et al., 2017) a metabolic slowdown in winter can be suggested. A year-round study on the copepod species Calanus glacialis from the Arctic showed similar seasonal patterns for MDH activity (Freese et al., 2017). Characteristic for this species, showing dormancy in winter, is a reduced MDH activity by half in winter compare to spring.
4.2 Life history effect
With respect to the two life history stages in the life cycle of Salpa thompsoni, results in biochemical analysis for aggregate and solitary specimen were considered separately, allowing to highlight the different energy requirements for sexual and asexual reproduction, respectively.
In line with published data from previous studies, S. thompsoni solitaries and aggregates showed different seasonal trends in total protein content (% of DM) in this study. Solitaries and aggregates had the highest total protein content in autumn and comparable low levels in summer and winter. Aggregates, however, showed a slightly higher protein levels overall (Fig. 8 A). Published data by Dubischar et al. (2006), showed a similar trend in autumn when solitary salps had a significant (p < 0.001) higher total protein content (7.7 ± 1.8) than aggregate specimen (4.4 ± 1.6).
The total carbohydrate content in solitaries was similar in summer and autumn at 1 % but increased twofold in winter (2 % ± 1.6). Aggregates, on the other hand, had the highest carbohydrate content in summer (1.9 % ± 1.0), which decreased to half the amount in autumn and winter (1 %). The amount of carbohydrates in autumn for both life stages was in a similar range than published data by Dubischar et al. (2006), 0.9 %
± 0.8 for aggregates and 0.8 % ± 0.3 for solitaries. The glycogen content was significant higher in aggregates in autumn (4.0 % ± 3.08) than in solitaries (1.0 ± 0.63), suggesting that this energy source are differently used in both life stages.
On the other hand, it could be further suggested that due to the decreasing trend in glycogen content from solitary specimen from summer to autumn, which is still known as reproduction time (Henschke and Pakhomov, 2018), it could be possible that solitary specimen utilize their glycogen energy during reproduction or even shift this energy reserves into the strobilated aggregate chains for better survival. This could go along with the significant high results of glycogen content in aggregate specimen in autumn. Auerswald et al. (2009) published data about a starvation experiment with E. superba in which the biochemical composition was analysed during starvation of up to 18 days. E. superba was collected at the begin of summer, when feeding season just had begun and the energy reserves were still low. In this study the glycogen content declined significant in the whole animal by about 30 % during the first 10 days of starvation. Thereafter, levels stabilize, suggesting a level that ensures short-term mobility. This thesis from Auerswald et al. (2009) could also explain the lower results in this study for both life history stages of S. thompsoni in winter, where both showed glycogen content of 2.0 % ± 0.0.
Considering the resutlts of body composition parameteres in the two life history stages of S. thomposoni, it becomes clear that the resources are used differently over season.
Years with high salp abundances are correlated with the population structure of S. thompsoni, when larger amounts of older oozoids survived the winter, leading to a stronger exponential growth of salp individuals in spring (Henschke et al., 2018). Due to the higher abundance in winter months and their better performance under lower temperatures compared to aggregates it is believed that solitaries are the overwintering stages despite a reduced asexual reproduction in winter (Chiba et al., 1999; Henschke and Pakhomov, 2018). A higher total carbohydrate content in winter solitaries might indicate the greater importance of total carbohydrate as energy storage for this life history stage, strengthening the hypothesis of solitaries being the dominant overwintering stage. While on the other hand glycogen might have been depleted in autumn solitaries after a successful reproductive season in summer and parts of the glycogen storage might have been transferred to the aggregate generation.
The results on the enzyme activities show a seasonal and a life history stage effect.
Solitary and aggregate specimen showed no seasonal differences between summer and autumn in HOAD activity, but the activity was higher in solitaries than in aggregate stages. Only in winter, HOAD activity increased in aggregates and declined in solitaries. However, the seasonal difference is not significant. Nevertheless, it is still worthnoting that HOAD activity as proxy for lipid utilisation showed higher activity in winter aggregates compared to solitaries. This could indicate their physiological limitation to lower temperature causing stress accompanying with consumption of lipids as energy store. Data from Dubischar et al. (2006) underline this thesis with lower lipid results of 5.7 % ± 4.4 for aggregates than for solitary specimen with 6.8 % ± 2.3, in autumn. In line with this hypothesis are the results of MDH activity. The MDH activity was significant (p = 0.02) reduced in solitaries from autumn (93.46 mU/mg protein ± 32.12) to winter (31.43 mU/mg protein ± 25.86) and had significant (p = 0.03) lower activity levels compared to aggregates in winter. MDH as proxy for overall metabolism and indicator for oxygen consumption, showed lower MDH activity in winter solitaries and significant higher activity for aggregates. Due to this it can be suggested that solitary specimen might be able to slow down their metabolism in winter, whereas aggregates are significantly stressed under lower temperature underlined by energy consumption and higher MDH activity. Data from Weßels et al. (2018) suggest that aggregates are more resilient towards higher temperature than solitary specimen. In contrast to this higher temperature resistance and underlining the hypothesis of solitary specimen being the overwintering stage, observations of aggregate salps with failed embryos in autumn showed significant correlation with decreasing temperature and chlorophyll a (Henschke & Pakhomov, 2018).
5. Conclusion and Outlook
This study highlights the seasonal differences in biochemical activity from summer to winter in the pelagic tunicate Salpa thompsoni. The glycogen content, in previous studies neglected, showed a significant increase in S. thompsoni specimen from summer to winter. In my opinion glycogen as energy storage and its fast availability for muscle activity and other body functions should be further investigated in the future (Vinagre and da Silva, 1992). It would be interesting to know how the glycogen content changes under increased environmental stress (e.g. temperature). HOAD activity showed a seasonal increasing trend and might indicate the utilisation of body lipids, which were not investigated in this study. To address this question, future studies should combine HOAD activity and lipid content analyses. The MDH activity was lowest in winter, suggesting a metabolic slow-down in winter according to lower temperatures and phytoplankton abundance.
Furthermore, differences in biochemical composition between both life history stages of S. thompsoni have been shown. With the higher MDH activity of aggregate specimen in winter compared to solitaries and the increased number of failed embryos in autumn identified in previous studies (Henschke and Pakhomov, 2018), it can be suggested that aggregates are less resistant to lower temperatures during the winter month. Therefore, it can be further hypothesized that the significant decreasing of MDH activity in solitary specimen from autumn to winter is a sign of dormancy in winter.
These results support the hypothesis of Pakhomov et al. (2018) of solitary specimen being the overwintering stage of S. thompsoni.
For further research, it would be interesting to analyse data from spring samples to complete the annual metabolic cycle. This could give new information on the biochemical activity of S. thompsoni in response to warmer temperatures and phytoplankton spring blooms after winter depression.
Assuming future global ocean warming accompanied by decreases of the Antarctic sea-ice, it can be suggested that Salpa thompsoni populations shift further into the southern habitats, where other marine zooplankton species are located. Due to their ability of fast exponential reproduction rates this could cause an increasing pressure on the daily primary production affecting other omnivorous zooplankton species.
References
Acuña, J.L., 2001. Pelagic Tunicates: Why Gelantinous? Am. Nat. 2001. Vol. 158, pp. 100–107
Andersen, V., 1986. Effect of temperature on the filtration rate and percentage of assimilation of Salpa fusiformis Cuvier (Tunicata: Thaliacea). Hydrobiologia 137, 135–140.
Andersen, V., Nival, P., 1986. A model of the population dynamics of salps in coastal waters of the Ligurian Sea. J. Plankton Res. 8, 1091–1110.
Auerswald, L., Gäde, G., 1999. The fate of proline in the African fruit beetle Pachnoda sinuata. Insect Biochem. Mol. Biol. 29, 687–700.
Auerswald, L., Pape, C., Stübing, D., Lopata, A., Meyer, B., 2009. Effect of short- term starvation of adult Antarctic krill, Euphausia superba, at the onset of summer. J.
Exp. Mar. Biol. Ecol. 381, 47–56.
Atkinson, A., Siegel, V., Pakhomov, E.A., and Rothery, P. (2004). Long-term decline in krill stock and increase in salps within the Southern Ocean. Nature 432, 100–103.
Chiba, S., Ishimaru, T., Hosie, G.W., Wright, S.W., 1999. Population structure change of Salpa thompsoni from austral mid-summer to autumn. Polar Biol. 22, 341- 349.
Clarke, A., Holmes, L.J., Gore, D.J., 1992. Proximate and elemental composition of gelatinous zooplankton from the Southern Ocean. J. Exp. Mar. BioL EcoL, 155 (1992) 55-68.
Deibel, D., and Lowen, B. (2012). A review of the life cycles and life-history
adaptations of pelagic tunicates to environmental conditions. ICES J. Mar. Sci. 69, 358–369.
Dische, Z., Pallavicini, H., Kavasaki, N., Smirnow, N., Cizek, L.J., Chien, S., 1962.
Influence of the Nature of the Secretory Stimulus on the Composition of the Carbohydrate Moiety of Glycoproteins of the Submaxillary Saliva’. Archives of Biochemistry and Biophysics, Volume 97, Issue 3, June 1962, Pages 459-469.
Dubischar, C.D., Pakhomov, E.A., Bathmann, U.V., 2006. The tunicate Salpa
thompsoni ecology in the Southern Ocean. II. Proximate and elemental composition.
Mar. Biol. 149, 625–632.
Dubischar, C.D., Pakhomov, E.A., Harbou, L., Hunt, B.P.V., Bathmann, U.V., 2012.
Salps in the Lazarev Sea, Southern Ocean: II. Biochemical composition and potential prey value. Mar. Biol. 159, 15–24.
Dubois, M., Gilles, K.A., Hamilton, J.K., Rebers, P.A., Smith, F., 1956. Colorimetric Method for Determination of Sugars and Related Substances. Anal Chem 28:350- 356.
Everson, I., 2000. Krill : biology, ecology, and fisheries. Blackwell Science, Oxford ; Malden, MA.
Foxton, P., 1966. The distribution and life-history of Salpa thompsoni Foxton with observations on a related species, Salpa gerlachei Foxton. Discovery Reports Vol.
XXXIV, pp. 1-116, text-figs, 1-42 July, 1966.
Freese, D., Søreide, J.E., Graeve, M., Niehoff, B., 2017. A year-round study on metabolic enzymes and body composition of the Arctic copepod Calanus glacialis:
implications for the timing and intensity of diapause. Mar. Biol. 164, 3.
Gaill, F., 1980. Glycogen and Degeneration in the Pyloric Gland of Dendrodoa grossularia (Ascidiacea, Tunicata). Cell Tissue Res. 208, 197-206 (1980).
Gili, J.-M., Rossi, S., Pagés, F., and Orejas, C. (2006). A new trophic link between the pelagic and benthic systems on the Antarctic shelf. Mar Ecol Prog Ser 322: 43–
49, 2006.
Henschke, N., Everett, J., Baird, M., Taylor, M., Suthers, I., 2011. Distribution of life- history stages of the salp <i>Thalia democratica<\i> in shelf waters during a spring bloom. Mar. Ecol. Prog. Ser. 430, 49–62.
Henschke, N., Everett, J.D., Richardson, A.J., Suthers, I.M., 2016. Rethinking the Role of Salps in the Ocean. Trends Ecol. Evol. 31, 720–733.
Henschke, N., Pakhomov, E.A., 2018. Latitudinal variations in Salpa thompsoni reproductive fitness. Limnol. Oceanogr. 0.
Huntley, M.E., Sykes, P.F., and Marin, V. (1989). Biometry and trophodynamics of
<Emphasis Type="Italic">Salpa thompsoni</Emphasis> foxton (Tunicata: Thaliacea) near the Antarctic Peninsula in austral summer, 1983–1984. Polar Biol. 10, 59–70.
Iguchi, N., Ikeda, T., 2004. Metabolism and elemental composition of aggregate and solitary forms of Salpa thompsoni (Tunicata: Thaliacea) in waters off the Antarctic Peninsula during austral summer 1999. J. Plankton Res. 26, 1025–1037.
Iversen, M.H., Pakhomov, E.A., Hunt, B.P.V., van der Jagt, H., Wolf-Gladrow, D., Klaas, C., 2016. Sinkers or floaters? Contribution from salp pellets to the export flux during a large bloom event in the Southern Ocean. Deep Sea Res. Part II Top. Stud.
Oceanogr.
Loeb, V.J., Santora, J.A., 2012. Population dynamics of Salpa thompsoni near the Antarctic Peninsula: Growth rates and interannual variations in reproductive activity (1993–2009). Prog. Oceanogr. 96, 93–107.
Loeb, V., Siegel, V., Holm-Hansen, O., Hewitt, R., Fraser, W., Trivelpiece, W., and Trivelpiece, S. (1997). Effects of sea-ice extent and krill or salp dominance on the Antarctic food web. Nature 387, 897–900.
Metfies, K., Nicolaus, A., Von Harbou, L., Bathmann, U., Peeken, I., 2014. Molecular analyses of gut contents: elucidating the feeding of co-occurring salps in the Lazarev Sea from a different perspective. Antarct. Sci. 26, 545–553.
Meyer, B., Auerswald, L., Siegel, V., Spahić, S., Pape, C., Fach, B.A., Teschke, M., Lopata, A., and Fuentes, V. (2010). Seasonal variation in body composition,
metabolic activity, feeding, and growth of adult krill Euphausia superba in the Lazarev Sea. Mar. Ecol. Prog. Ser. 398, 1–18.
Nishikawa, J., Atsushi, T., 2001. Diel vertical migration of the tunicate Salpa thompsoni in the Southern Ocean during summer.Polar Biol (2001), Volume 24, Issue 4, pp 299–302.
Nishikawa, J., Naganobu, M., Ichii, T., Ishii, H., Terazaki, M., and Kawaguchi, K.
(1995). Distribution of salps near the South Shetland Islands during austral summer, 1990?1991 with special reference to krill distribution. Polar Biol. 15.
Pakhomov, E.A., Froneman, P.W., Perissinotto, 2002. Salp/krill interactions in the Southern Ocean:spatial segregation and implications for the carbon flux. Deep-Sea Research II 49 (2002) 1881–1907.
Pakhomov, E.A., Hall, J., Williams, M.J.M., Hunt, B.P.V., Stevens, C.J., 2011.
Biology of Salpa thompsoni in waters adjacent to the Ross Sea, Southern Ocean, during austral summer 2008. Polar Biol. 34, 257–271.
Sutherland, K.R., and Madin, L.P. (2010). A comparison of filtration rates among pelagic tunicates using kinematic measurements. Mar Biol 157:755–764.
Sutherland, K.R., Madin, L.P., and Stocker, R. (2010). Filtration of submicrometer particles by pelagic tunicates. PNAS, August 24, 2010, vol. 107, no. 34, 15129–
15134.
Teschke, M., Kawaguchi, S., and Meyer, B. (2007). Simulated light regimes affect feeding and metabolism of Antarctic krill, Euphausia superba. Limnol. Oceanogr. 52, 1046–1054.
Vinagre, A.S., and da Silva, R.S.M. (1992). Effects of starvation on the carbohydrate and lipid metabolism in crabs previously maintained on a high protein or
carbohydrate-rich diet. Camp. Biochem. Physiol. Vol. 102A, No. 3, pp. 579-583, 1992.
Weßels, W., Auerswald L., Michael K., Meyer B. (2018). Estimating adaptive capacities of Salpa thompsoni facing Southern Ocean warming.
Internet:
(https://www.graphpad.com/quickcalcs/grubbs1/).
Annex
Tab.2: Total protein content in mg/ml and in % of S. thompsoni. * indicates significant outlier (α = 0.05), proven with outlier test after Grubbs
(https://www.graphpad.com/quickcalcs/grubbs1/).
Sample Code Season Life stage Total proteins (mg/ml)
Total proteins (%)
AMLR16_0875 winter AGG 0..04 3,5
AMLR16_0912 winter AGG 0.05 5,1
AMLR16_0970 winter AGG 0.02 2,3
AMLR16_1474 winter AGG 0.06 6,2
AMLR16_0224 winter SOL 0.03 3,1
AMLR16_0567 winter SOL 0.03 3.2
AMLR16_1429 winter SOL 0.02 2.2
AMLR16_1431 winter SOL 0.04 4.3
AMLR16_1449 winter SOL 0.02 1.9
PS112_S1294 summer AGG 0.04 3.6
PS112_S1333 summer AGG 0.07 7.3
PS112_S1341 summer AGG 0.04 3.5
PS112_S1342 summer AGG 0.05 5.3
PS112_S1346 summer AGG 0.05 4.6
PS112_S1169 summer SOL 0.07 7.2
PS112_S1386 summer SOL 0.04 3.9
PS112_S1388 summer SOL 0.08 7.5
PS112_S1400 summer SOL 0.15* 15.1*
PS112_S1402 summer SOL 0.03 2.9
AGK_3.1 autumn AGG 0.07 7.0
AGK_7.1 autumn AGG 0.10 10.3
AGK_7.2 autumn AGG 0.06 5.9
AGK_8.1 autumn AGG 0.08 7.5
AGK_11.1 autumn AGG 0.07 6.8
AGK_11.2 autumn AGG 0.07 6.5
AGK_56.1 autumn AGG 0.02 1.9
AGK_56.2 autumn AGG 0.01 0.8
AGK_56.3 autumn AGG 0.02 2.2
AGK_56.4 autumn AGG 0.02 2.3
AGK_56.5 autumn AGG 0.02 2.0
AGK_56.6 autumn AGG 0.04 3.9
AGK_56.7 autumn AGG 0.04 3.6
AGK_56.8 autumn SOL 0.05 4.6
AGK_56.9 autumn AGG 0.02 2.1
AGK_56.10 autumn AGG 0.02 2.1
AGK_56.11 autumn SOL 0.02 2.3
AGK_56.12 autumn SOL 0.01 1.3
AGK_56.13 autumn AGG 0.06 5.6
AGK_56.14 autumn AGG 0.07 6.5
Tab.3: Total carbohydrate content in µg/µl and in % of S. thompsoni.
Sample Code Season Life stage Total carbohydrate
(µg/µl)
Total carbohydrate
(%)
AMLR16_0875 winter AGG 0.30 0.6
AMLR16_0912 winter AGG 1.50 3.0
AMLR16_0970 winter AGG 0.45 0.9
AMLR16_1474 winter AGG 0.45 0.9
AMLR16_0224 winter SOL 0.52 1.0
AMLR16_0567 winter SOL 0.21 0.4
AMLR16_1429 winter SOL 1.09 2.2
AMLR16_1431 winter SOL 1.99 4.0
AMLR16_1449 winter SOL 1.26 2.5
PS112_S1294 summer AGG 0.32 0.6
PS112_S1333 summer AGG 0.66 1.3
PS112_S1341 summer AGG 0.40 0.8
PS112_S1342 summer AGG 0.94 1.9
PS112_S1346 summer AGG 0.02 0.0
PS112_S1169 summer SOL 0.48 1.0
PS112_S1386 summer SOL 0.27 0.5
PS112_S1388 summer SOL 0.73 1.5
PS112_S1400 summer SOL 1.66 3.3
PS112_S1402 summer SOL 0.35 0.7
AGK_3.1 autumn AGG 0.51 1.0
AGK_7.1 autumn AGG 0.30 0.6
AGK_7.2 autumn AGG 0.65 1.3
AGK_8.1 autumn AGG 0.64 1.3
AGK_11.1 autumn AGG 1.56 3.1
AGK_11.2 autumn AGG 1.06 2.1
AGK_56.1 autumn AGG 1.48 3.0
AGK_56.2 autumn AGG 1.62 3.2
AGK_56.3 autumn AGG 1.50 3.0
AGK_56.4 autumn AGG 1.51 3.0
AGK_56.5 autumn AGG 0.27 0.5
AGK_56.6 autumn AGG 1.45 2.9
AGK_56.7 autumn AGG 0.33 0.7
AGK_56.8 autumn SOL 0.72 1.4
AGK_56.9 autumn AGG 0.39 0.8
AGK_56.10 autumn AGG 0.40 0.8
AGK_56.11 autumn SOL 0.44 0.9
AGK_56.12 autumn SOL 1.09 2.2
AGK_56.13 autumn AGG 0.35 0.7
AGK_56.14 autumn AGG 1.29 2.6
Tab.4: Gycogen content in µg and in % of S. thompsoni. * indicates significant outlier (α = 0.05), proven with outlier test after Grubbs (https://www.graphpad.com/quickcalcs/grubbs1/).
Sample Code Season Life stage Glycogen (µg) Glycogen content (%)
AMLR16_0875 winter AGG 23.63 1.8
AMLR16_0912 winter AGG 19.84 1.7
AMLR16_0970 winter AGG 40.32 3.3
AMLR16_1474 winter AGG 16.77 2.0
AMLR16_0224 winter SOL 27.11 2.0
AMLR16_0567 winter SOL 22.58 1.7
AMLR16_1429 winter SOL 21.83 1.5
AMLR16_1431 winter SOL 4.52 0.3
AMLR16_1449 winter SOL 26.24 1.8
PS112_S1294 summer AGG 29.08 1.8
PS112_S1333 summer AGG 67.43 4.7
PS112_S1341 summer AGG 28.79 2.1
PS112_S1342 summer AGG 29.17 2.0
PS112_S1346 summer AGG 116.57 8.6
PS112_S1169 summer SOL 17.95 1.3
PS112_S1386 summer SOL 11.61 0.9
PS112_S1388 summer SOL 9.19 0.8
PS112_S1400 summer SOL 25.06 2.1
PS112_S1402 summer SOL 10.15 0.7
AGK_3.1 autumn AGG 40.20 3.1
AGK_7.1 autumn AGG 12.00 0.9
AGK_7.2 autumn AGG 10.41 0.9
AGK_8.1 autumn AGG 4.95 0.4
AGK_11.1 autumn AGG 9.06 0.7
AGK_11.2 autumn AGG 19.05 1.5
AGK_56.1 autumn AGG 11.48 0.9
AGK_56.2 autumn AGG 27.34 2.1
AGK_56.3 autumn AGG 9.78 0.8
AGK_56.4 autumn AGG 15.27 1.2
AGK_56.5 autumn AGG 14.79 1.2
AGK_56.6 autumn AGG 3.57 0.2
AGK_56.7 autumn AGG 1.43 0.1
AGK_56.8 autumn SOL 8.97 0.7
AGK_56.9 autumn AGG 17.49 1.2
AGK_56.10 autumn AGG 5.11 0.4
AGK_56.11 autumn SOL 2.30 0.4
AGK_56.12 autumn SOL 6.32 9.0*
AGK_56.13 autumn AGG 9.26 0.8
AGK_56.14 autumn AGG 5.22 0.6