CRUISE SUMMARY REPORT
Go West: Sea-ice association of Polar cod and its prey in the western Arctic Ocean
R/V Sikuliaq, Cruise No. SKQ201923S,
November 7 - December 2, 2019, Nome, Alaska (USA) – Dutch Harbor, Alaska (USA)
Franz Mueter, Hauke Flores, Ron ten Boer, Michiel van Dorssen, Lorena Edenfield, Apasiri Klasmeier, Kristina Kunz, Sarah Maes, Alexei
Pinchuk, Jared Weems, Nadezhda Zakharova
Table of Content
Page
1 Summary 3
2 Research objectives 4
3 Narrative of the Cruise 6
4 Preliminary Results 12
4.1 Overview 12
4.2 Underway data 13
4.3 Oceanography and water/plankton sampling with CTD/Rosette 16
4.4 Mesozooplankton sampling 18
4.5 Macrozoopklankton and fish sampling 19
4.5.1 Overview 19
4.5.2 Macrozooplankton and under-ice fauna 20
4.5.3 Fish 22
4.6 Zooplankton respiration 27
4.7 Ice stations 29
5 Data and Sample Storage /Availability 31
6 Participants 32
7 Station List SKQ201923S 33
8 Acknowledgements 35
9 References 35
Title picture credit: John Guillote
1 Summary
Polar cod (Boreogadus saida), a key fish species in Arctic marine ecosystems, may be particularly susceptible to changing sea-ice habitats. It has been proposed that parts of the population get entrained with the growing sea ice in autumn, but how this happens and what proportion of the population becomes ice-associated is not known. The overall goal of the Go-West expedition was to test the hypothesis that entrainment of young Polar cod into the sea-ice habitat in the Chukchi and Beaufort seas during autumn is significant, and hence sea-ice association is an important survival strategy for Polar cod.
During expedition SKQ201923S with RV Sikuliaq (06 November – 02 December 2019), we sampled Polar cod and its prey in the ice-water interface layer along with high resolution profiles of sea-ice and surface water properties with a Surface and Under-Ice Trawl (SUIT). We recorded backscatter of fish and zooplankton in the water column with the Sikuliaq’s EK80 echosounder, and sampled pelagic communities with two midwater trawls (Methot trawl and IKMT) and vertical zooplankton nets (CalVET and ring net). A conductivity-temperature—depth probe equipped with a rosette water sampler (CTD) sampled vertical profiles of temperature, salinity and fluorescence and was used to collect water samples for the analysis for chlorophyll a concentration, nutrient concentrations, trophic biomarkers and harmful algae (HAB).
During four ice stations, we sampled the sea ice for the same parameters (except nutrients), and performed hyperspectral light measurements needed to derive ice algae biomass from hyperspectral profiles obtained from a sensor mounted on the SUIT. In addition, we performed respiration measurements on abundant zooplankton prey species of Polar cod. Altogether, we completed 11 SUIT stations (1 in open water, 10 under ice), 4 ice stations and 3 midwater trawls. All SUIT deployments were succesful, expanding Sikuliaq’s capability of advanced scientific operations in ice-covered waters. Polar cod were caught at all SUIT stations, totalling 153 fish. Most fish appeared to be first-year juveniles between 6 and 8 cm in size, pending age determinations. Fish abundance increased with increasing ocean depth, sea-ice draft and abundance of the ice amphipod Onisimus spp.. The mesozooplankton community in the upper 50 m was dominated by the copepod Metridia longa. Respiration experiments indicated that Metridia and, surprisingly, Calanus glacialis from shelf stations were in an active metabolic state.
Chlorophyll a concentrations were low (< 0.5 mg m-3) in the water column. Conversely, visual inspection of ice core filters indicated that ice algal biomass had already begun to accumulate in the autumn sea ice.
The trophic relationships between ice algae, zooplankton and sea-ice fauna and Polar cod will be analyzed in detail based on hundreds of biological samples, including diet and trophic biomarker samples.
Investigations of otolith microchemistry and population genetics studies on each sampled fish will help elucidate their origins and migration patterns. Preliminary results of this expedition support our hypothesis that juvenile Polar cod associate with sea ice in autumn and show that prey is available to sustain them at the onset of winter.
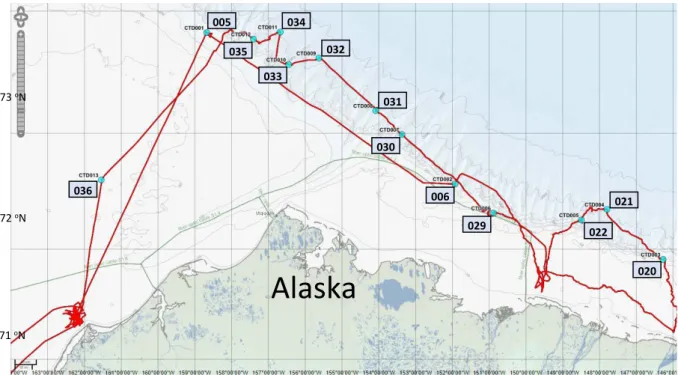
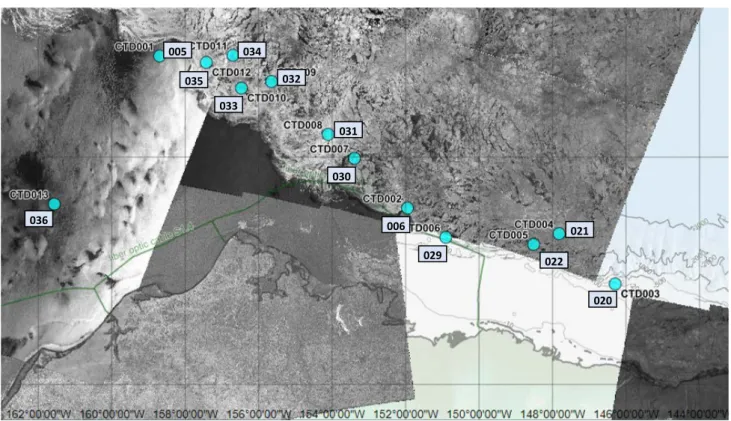
Figure 1.1. Working area and track chart of R/V Sikuliaq, Cruise SKQ201923S with fishing stations and ship CTD station numbers indicated.
2 Research Objectives
The overall goal of this project was to test the hypothesis that entrainment of young Polar cod into the sea-ice habitat in the Chukchi and Beaufort seas during autumn is significant, and hence sea-ice association is an important survival strategy with positive effects on recruitment to the adult population the following summer. We combined sampling of juvenile Polar cod and their prey with a Surface and Under-Ice Trawl (SUIT) at the ice-water interface with midwater trawls, high resolution profiles of sea-ice properties and hydroacoustic profiles of the water column to examine direct and indirect dependencies of Polar cod populations in the Pacific Arctic on sea ice. CTD casts and vertical mesozooplankton nets sampled the physical and biological state of the ocean and the prey field. The main objectives were to:
1) Identify sea-ice habitats favorable for Polar cod in terms of physical properties, ice algal biomass and prey composition
The distribution of Polar cod, sympagic fauna and zooplankton in relation to each other and in relation to environmental parameters in the under-ice habitat were investigated using a SUIT equipped with an environmental sensor array measuring water column properties, such as temperature, salinity and pelagic chlorophyll concentration, ice thickness profiles, and hyperspectral profiles for estimating ice algal biomass (Lange et al. 2016).
2) Test for the presence of deep scattering layers in the underlying water column
In addition to sampling the under-ice fauna, the presence of deep scattering layers along much of the cruise track were documented using the ship’s EK80 echo sounder. Where significant scattering layers were detected, we attempted targeted hauls using two types of midwater trawls, a Methot Net and an Isaac-Kidd Midwater Trawl (IKMT) to investigate the species composition and size distribution of fish and other organisms in these layers.
However, ice conditions at most sites prevented us from using a midwater trawl to sample pelagic organisms.
Alaska
72 oN
71 oN 73 oN
005
006 021
020 033
032
031 030
029 022
036
035
034
3) Quantify the carbon flux between sea ice, plankton, and Polar cod and assess the pre-winter condition of Polar cod
Under-ice sampling and habitat mapping in the field will be followed with diet studies on fish and prey species, and the analysis of trophic biomarkers, which allow quantifying the relative contribution of sea ice-derived versus phytoplankton-derived carbon to the carbon budget of Polar cod and its prey (Kohlbach et al. 2016, 2017). The energetic status (lipid density and lipid classes, and fatty acid composition) of Polar cod will be quantified in the laboratory to assess their condition prior to winter, relative to habitat characteristics and to benchmarks established in laboratory studies (Copeman et al. 2017).
4) Study the connectivity between central Arctic under-ice populations and shelf-based spawning populations
The field survey covering under-ice habitats over the deep basin will be combined with existing samples from the Chukchi Sea and Beaufort Sea shelves to provide unprecedented data on the spatial connectivity of juvenile populations residing under central Arctic sea ice with adult populations on the shelf. To test our hypothesis that juvenile Polar cod originating from the central Arctic sea ice contribute significantly to the recruitment of the shelf-based populations, the origin of sampled fish will be examined using population genetics and state- of-the-art otolith analyses.
A secondary objective of the project was to enhance the capacity of the research community in the Pacific Arctic, and of R/V Sikuliaq specifically, to conduct studies that require sampling the biological community under seasonal sea ice. In spite of challenging ice conditions, this objective was met during the cruise.
European collaborators familiar with the operation of the SUIT worked closely with the ship’s officers and crew to train everyone on how to effectively deploy, fish and retrieve the SUIT. A manual with standard operating procedures for the SUIT will be developed in collaboration with the crew to document SUIT operations for the future.
Overall, the project met the objectives for field work, although we completed one less fishing station than originally proposed (11 stations fished with the SUIT out of 12 proposed). The sampling design during the cruise was highly adaptive by necessity due to changing and unpredictable ice conditions and because the project shared ship time with the CODA project. The model of sharing ship time with another project that was operating in similar locations close to the advancing ice edge was a net benefit to GO-WEST and contributed to its success as it allowed us to share transit times and logistical support, as well as allowing for periods of rest between more intensive fishing activities.
3 Narrative of the Cruise
A brief summary of all activities performed during the course of the expedition is provided in Table 3.1.
We note that activities for the two projects on board, CODA and GO-WEST, were not always divided on a day-by-day basis. This means that activities for both projects were sometimes performed on the same time, with only the major activity listed in Table 3.1. A detailed record of the scientific activities during the active sampling period (09-24 November 2019) is given below.
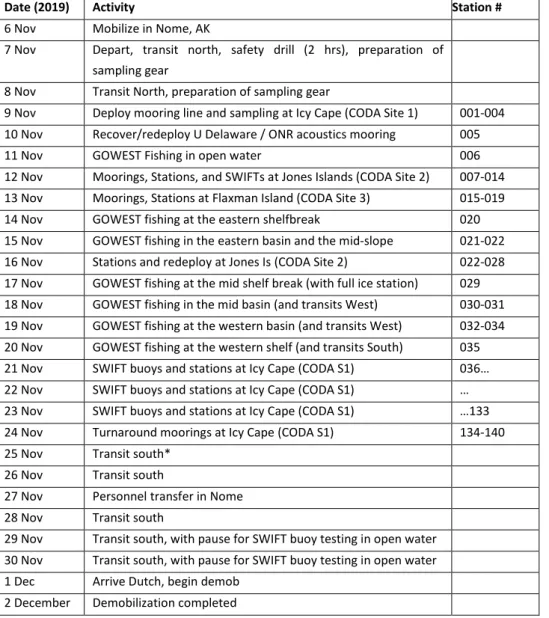
Table 3.1: Cruise dates, activities, and stations.
Date (2019) Activity Station #
6 Nov Mobilize in Nome, AK
7 Nov Depart, transit north, safety drill (2 hrs), preparation of sampling gear
8 Nov Transit North, preparation of sampling gear
9 Nov Deploy mooring line and sampling at Icy Cape (CODA Site 1) 001-004 10 Nov Recover/redeploy U Delaware / ONR acoustics mooring 005
11 Nov GOWEST Fishing in open water 006
12 Nov Moorings, Stations, and SWIFTs at Jones Islands (CODA Site 2) 007-014 13 Nov Moorings, Stations at Flaxman Island (CODA Site 3) 015-019
14 Nov GOWEST fishing at the eastern shelfbreak 020
15 Nov GOWEST fishing in the eastern basin and the mid-slope 021-022 16 Nov Stations and redeploy at Jones Is (CODA Site 2) 022-028 17 Nov GOWEST fishing at the mid shelf break (with full ice station) 029 18 Nov GOWEST fishing in the mid basin (and transits West) 030-031 19 Nov GOWEST fishing at the western basin (and transits West) 032-034 20 Nov GOWEST fishing at the western shelf (and transits South) 035 21 Nov SWIFT buoys and stations at Icy Cape (CODA S1) 036…
22 Nov SWIFT buoys and stations at Icy Cape (CODA S1) … 23 Nov SWIFT buoys and stations at Icy Cape (CODA S1) …133
24 Nov Turnaround moorings at Icy Cape (CODA S1) 134-140
25 Nov Transit south*
26 Nov Transit south
27 Nov Personnel transfer in Nome 28 Nov Transit south
29 Nov Transit south, with pause for SWIFT buoy testing in open water 30 Nov Transit south, with pause for SWIFT buoy testing in open water 1 Dec Arrive Dutch, begin demob
2 December Demobilization completed
* The return transit began early to account for an adverse weather forecast.
9 Nov 2019, Stations 001-004: CODA S1 mooring deployments at Icy Cape
The first set of stations was conducted at Icy Cape. No sea ice was present and the winds were moderate.
The GO-WEST project used the ring net to obtain a zooplankton sample for physiological experiments (respirometer).
10 Nov 2019, Station 005: ONR mooring work
The ONR acoustics mooring was recovered exactly at the given position, after collecting a calibration profile with the ship’s CTD. Water samples were taken at multiple depths for analyzing nutrients, chlorophyll, algal toxins (harmful algal blooms, HAB), trophic biomarkers and environmental DNA for the GO-WEST project. All CTD components appeared intact and in good condition. The ring net was deployed to sample zooplankton for respirometry. The new mooring was rigged and deployed at the same position later that day.
11 Nov 2019, Station 006: GO-WEST open water testing
A first trial run with the full sequence of events planned for each fishing station was conducted in open water along the slope just east of Barrow Canyon outside the ice (Fig. 3.1). This sampling event served as a trial run for both deploying the SUIT off R/V Sikuliaq and determining the work flow for sample processing. The SUIT caught one Polar cod in open water on its first deployment. The full sequence of planned sampling events at GO-WEST fishing stations was executed, consisting of a ship’s CTD cast with water sampling, a Calvet Net sample, calibration of the SUIT CTD, SUIT fishing, and midwater fishing (Methot Net). The Methot net was fished obliquely from the surface to 200 m to determine the composition of backscatter in the upper 200 m, which was characterized by moderate backscatter at lower frequencies in the upper 100 m (likely reflecting juvenile fish) and multiple layers of relatively strong backscatter near 100 m, likely reflecting zooplankton (Fig. 3.2). Fishing was followed by an exploratory transit into the leading edge of the offshore sea ice, traveling overnight to the CODA S2 site.
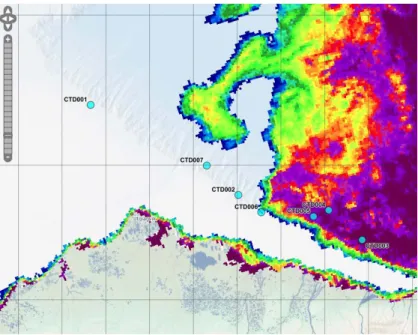
Figure 3.1. Ice conditions during Station 006 (CTD 002).
Figure 3.2: Acoustic backscatter at station 006 at 18, 38, 760, 120, and 200 kHz (from left to right), where an oblique Methot trawl sample was obtained from the surface to 200 m. Note different y-axis scales.
12 Nov 2019, Stations 007-014: CODA S2 mooring recoveries /deployment at Jones Islands 13 Nov 2019, Stations 015-019: CODA S3 mooring recovery / deployment at Flaxman Island 14 Nov 2019, Station 020: GO-WEST fishing at western shelf break
The full sampling protocol was executed at station 020 along the outer shelf in approximately 165 m of water and in near 100% ice cover, mostly consisting of young grey ice floes up to 30 cm thick with some moderate ridges. The SUIT was deployed for the first time in ice. Deployment was challenging due to limited open water and rapid freezing. As a result, the two nets mounted to the SUIT collected a large amount of ice that was melted using the ship’s fire hose. The fish net of the SUIT caught 9 young Polar cod.
0 500 1000 1500 2000
-100-80-60-40-200
Time (Seconds)
Depth (m)
Start (UTZ): 2019-11-17 00:24:09
Station: 020
-0.50.00.51.01.52.0 Ascent/Descent rate (m / sec
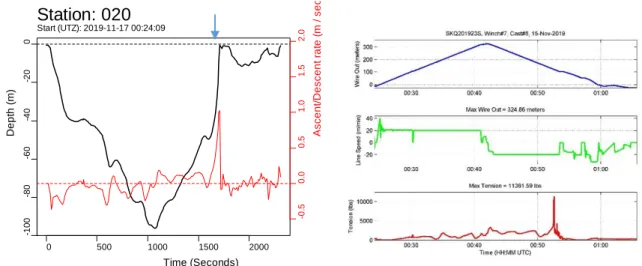
Figure 3.3. Depth profile of the Methot net from deployment through retrieval and ascent/descent rate (left) and winch data including tension, line speed and wire out for Methot haul at station 020. Note spike in ascent rate approximately 1700 sec into the tow. The blue arrow indicates the sudden spike in wire tension recorded in the winch record (left panel).
The SUIT haul was followed by a midwater trawl in a semi-open lead using the Methot net after clearing ice with the ship’s thrusters in the deployment and haul-out areas. Unfortunately, the net possibly caught some ice during deployment, behaving somewhat erratically during the tow in spite of consistent speed of the ship and wire. During haul-back, the net started rising to the surface very rapidly with approximately 130 m of wire out (30 m in 30 seconds, see Figure 3.3). As soon as it surfaced, the net caught a large amount of ice, leading to a spike in wire tension at ~11,000 lbs. The ship came to a stop immediately and retrieved the net, but the frame was damaged beyond repair, with moderate damage to the net.
15 Nov 2019, Station 021-022: GO-WEST fishing at western basin (deep site)
After transiting overnight to the deep basin, we sampled two fishing stations at approximately 2400 m over the lower slope (station 021) and 1300 m in the mid-slope region (station 022). The full range of gears was employed at station 021, including a ring net to collect zooplankton for respirometry. Ice conditions at the station were dominated by young grey ice approximately 20-30 cm thick. The first SUIT deployment was aborted because the net did not shear properly when it entered brash ice along the edge. The second, successful SUIT haul over the outer slope resulted in a catch of 31 Polar cod, the largest catch of Polar cod in the SUIT to date. The SUIT haul was followed by midwater fishing with the IKMT in a mostly open lead. Following fishing, we occupied an ice station using the man basket to collect ice cores for collecting trophic biomarker and harmful algae samples.
After transiting to the mid-slope station (022), we repeated the standard sequence of deployments without the ring net and without midwater trawling, because open water to deploy the IKMT was not available. The SUIT haul resulted in the catch of another 7 Polar cod. After the second fishing station we transited to CODA site S2 overnight.
16 Nov 2019, Stations 022-028: CODA S2 mooring redeployments at Jones Islands 17 Nov 2019, Station 029: GOWEST fishing and ice station
After a night-time transit we started with an early morning GO-WEST fishing station (029) near the shelfbreak (~200 m). The area was dominated by young ice floes of approximately 15-25 cm thickness with some recently open leads that had some Nilas and some open areas that were actively freezing while we were on station. Following the CTD and zooplankton sampling, but prior to deploying the SUIT, we set up a large ice station on the portside of the ship with a gangway to a 20-40 cm thick floe. Over about 4.5 hours, the RAMSES hyperspectral sensor was deployed under the ice with an L-arm, and a total of 10 ice cores were taken and sectioned on the ice in preparation for melting and filtering. The material on the filters will be used for calibrating the hyperspectral light sensor (RAMSES) mounted on the SUIT (total chlorophyll), take samples for biomarkers, and test for HABs. We experienced significant drift to the west- southwest into shallower water while on station. After the ice station was completed the SUIT was deployed in the same area under an ice floe of similar thickness.
18 Nov 2019, Stations, 030-031: GOWEST fishing in the mid shelf
We sampled two GO-WEST fishing stations in the mid-shelf region at about 1500 m (Station 030) and 1900 m (Station 031). Both areas were dominated by thinner young grey ice (10-20 cm) with significant amounts of Nilas between floes. The ice was thinning notably as we proceeded westward along the slope.
We obtained several additional ice cores using a man basket to collect organic matter for measuring biomarkers and testing for harmful algae. After completing the ice station, we cleared a small area
(‘runway’) for deploying the SUIT, but the first deployment was unsuccessful as the SUIT did not dive under the ice and was pulled along the ice edge in brash ice. We likely did not have enough wire out when entering the ice because of the short approach to the ice edge. For the second attempt, we entered an open lead that was actively spreading and deployed the net while traveling along the main axis of the lead before conducting a sharp starboard turn into the ice floe. At station 030, the greatest number of Polar cod of the entire expedition was caught, totaling 37 fish. Station 031, further down the slope, yielded 18 Polar cod.
19 Nov 2019, Stations, 032-034: GOWEST fishing at deep stations
We continued transiting towards the west, keeping a minimum distance of 70 miles from Utqiagvik as requested by the community. After an overnight transit we started fishing at a deep station on the lower slope in ~ 2550 m of water (032), followed by a station in the mid-slope region (033, ~1550 m) and a final station 034 at ~ 2000 m. All three stations were characterized by very young, grey ice approximately 10-15 cm thick with 10-20% Nilas between the thicker floes. All stations required some clearing of ice prior to deployment using the ship and the ship’s thrusters, although some small pockets of open water were present. Most deployments were successful with a relatively short ‘runway’, but one aborted SUIT haul at station 034 could be attributed to the lack of a clearly worked out deployment and communications plan (scientist on bridge to winch) and a very short ‘runway’. We caught 6 Polar cod at station 032, 2 at station 033, and 19 at station 34.
Figure 3.4. GO-WEST sampling stations (station numbers in boxes) sampled between Nov 10 and Nov 20, 2019, with ESA Sentinel-1 images taken 2019/11/19 around 17:00 to 18:00 UTC, and earlier Radarsat images (background). Stations 032-034 correspond to CTD009, CTD010 and CTD011.
005
006 021
020 033
032
031 030
029 022
036
035
034
20 Nov 2019, Station 035: GOWEST fishing at shelf break
Final day of fishing for the GO-WEST project. The ice becomes thinner as we transit overnight towards the shelf break. We stop at approximately 1000 m depth over the mid-shelf region in a pool with some open water and frazil ice with an adjacent ice floe about 10-15 cm thick. The open pool of water makes for a relatively easy deployment. This concludes the fishing portion of the cruise, except for opportunistic ring net deployments to collect zooplankton for respirometry experiments. Station 035 yielded 19 Polar cod in the SUIT.
20 Nov – 30 Nov 2019: After the GO-WEST sampling was concluded on 20 November, we used the remaining days to dismount sampling gear and laboratories, pack, for preliminary data analysis and for drafting this cruise report.
24 Nov 2019, Stations 134-140: CODA S1 mooring turnarounds and CalVET nets (GO-WEST)
4 Preliminary Results
4.1 Overview
The GO-WEST project successfully occupied a total of 11 fishing stations and two additional oceanography stations (Table 4.1). A full sampling sequence at each station included the ship’s CTD and rosette water sampling (CTD911), a quantitative zooplankton sample (CalVET Net), a hand-held CTD cast for calibration (SUIT CTD), a zooplankton sample for respirometry (Ring Net), a Surface and Under-Ice Trawl sample (SUIT) and a midwater trawl sample (Methot or IKMT). Midwater trawls were obtained at only three stations because of the lack of open water, which also led to extensive damage to the Methot frame on its second deployment, making it unusable for further trawls (see cruise narrative). To obtain estimates of acoustic backscatter in the upper 300 m of the water column, the ship’s EK80 was run continuously throughout the cruise as conditions allowed.
In addition to the fisheries stations, we obtained two opportunistic CTD / oceanography stations at the site of an Office of Naval Research (ONR) acoustics mooring along the Chukchi Slope (CTD 001, Fig. 1.1) and at the site of the UAF long-term Chukchi Ecosystem Observatory (CTD013, Fig. 1.1). GO-WEST sampling objectives for oceanographic sampling focused on characterizing 1) water column properties during the formation of sea ice, 2) shelf-slope-basin dynamics, and 3) comparisons of the Chukchi Sea slope and Beaufort Sea slope environments. Water samples were filtered and preserved for later lab analyses, including nutrient and chlorophyll a concentrations, trophic biomarker analysis. In this analysis, the fatty acid composition and isotopic fractionation of fatty acids from ice algae and phytoplankton is used to trace the relative composition of these two carbon sources in animals at different trophic levels. A small part of the sampling was not related to GO-WEST, but aimed to honour long-time collaborations of the UAF. This external sampling comprised eDNA samples and samples to screen for the detection of harmful algae blooms (HAB) in the water and in sea ice (see section 4.2, 4.6). The external sampling was performed opportunistically, and needed no extra time from the GO-WEST time budget.
Zooplankton samples from the upper water column and from under-ice samples were processed and preserved for analysis of species composition and abundance as descibed in section 4.3, additional biological samples of zooplankton and fish samples for biomarkers, energetics, and genetic analyses were processed and preserved as described in sections 4.4. A ring net was deployed opportunistically before and after the main sampling period to obtain zooplankton samples for respirometry experiments.
Onboard experiments with a respirometer to measure the oxygen consumption of selected zooplankton species at ambient water temperatures are summarized in section 4.5.
Four ice stations conducted during this cruise provided essential background data for various objectives of Go-West. We sampled chlorophyll cores to estimate the ice algae standing stock biomass as an indicator of the carrying capacity of the ecosystem during autumn. The majority of these chlorophyll cores were taken in combination with hyperspectral light measurements that will be used to estimate ice algae chlorophyll during SUIT hauls from hyperspectral profiles collected by the RAMSES sensor mounted on the SUIT (Lange et al. 2016). Furthermore, we collected ice cores for trophic biomarker analysis and HAB in sea ice (see section 4.6).
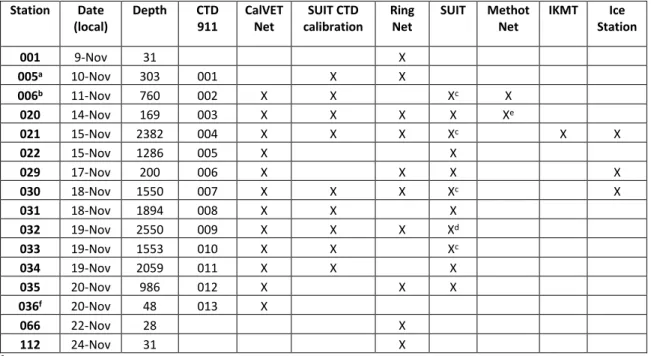
Table 4.1. Fishing and CTD/oceanography stations sampled by GO-WEST during cruise SKQ201923S.
Station Date
(local) Depth CTD
911 CalVET
Net SUIT CTD
calibration Ring
Net SUIT Methot
Net IKMT Ice Station
001 9-Nov 31 X
005a 10-Nov 303 001 X X
006b 11-Nov 760 002 X X Xc X
020 14-Nov 169 003 X X X X Xe
021 15-Nov 2382 004 X X X Xc X X
022 15-Nov 1286 005 X X
029 17-Nov 200 006 X X X X
030 18-Nov 1550 007 X X X Xc X
031 18-Nov 1894 008 X X X
032 19-Nov 2550 009 X X X Xd
033 19-Nov 1553 010 X X Xc
034 19-Nov 2059 011 X X X
035 20-Nov 986 012 X X X
036f 20-Nov 48 013 X
066 22-Nov 28 X
112 24-Nov 31 X
a ONR mooring site (trial CTD and filtration); b Open water SUIT trial; c One aborted attempt; d Two aborted attempts; e Methot net frame badly damaged; f Chukchi Ecosystem Monitoring (CEO) mooring site
4.2 Underway data Methods
While travelling in open water deeper than 20 m, or while operating in light ice conditions, the centerboard, which houses the EK80 unit, was lowered for measuring acoustic backscatter using continous wave (CW) signals at pulse rate of 1.024 ms and powers of 1000 W at 18 kHz, 2000 W at 38 kHz, 750 W at 70 kHz, 250 W at 120 kHz and 150 W at 200 kHz. In heavier ice conditions, the centerboard was put in a flush position or retracted , resulting in some gaps in the acoustic record. All acoustic data were archived for later analysis. A full calibration was completed August 5, 2019 and calibration files have been archived. Screenshots of acoustic backscatter at 18, 38, 70, 120 and 200 kHz were taken every 30 min and archived for visual inspection (Fig. 4.1). Other underway data relevant to the GO-WEST project were collected over much of the cruise track, including depth from the ship’s EM302 sounder, temperature and salinity below the surface at 4 m from the ship’s thermosalinograph (Fig. 4.2), Photosynthetically Active Radiation (PAR) from the ship’s radiometer, and wind speed and direction.
Preliminary results
Backscatter in the water column was typically characterized by a diffuse layer of backscatter at all frequencies, but often more pronounced at 18 and 38kHz in the upper 100 m. At many stations, distinct layers of backscatter were also evident at lower and/or higher frequencies, suggesting aggregations of fish and/or zooplankton. Due to heavy ice cover, we were unable to obtain targeted midwater trawl samples for validating the composition of backscatter, but given that juvenile Polar cod dominated the catch in all surface and midwater trawls, it is reasonable to assume that much of the backscatter at 38kHz reflects juvenile Polar cod. An oblique Methot sample from the surface to 200 m depth at station 006 caught juvenile Polar cod and large numbers of euphausiids in an area with moderate backscatter in the upper 100 m and multiple layers of backscatter at 100-200 m (upper panels in Fig. 4.1).
Figure 4.1. Two example screenshot of acoustic backscatter (EK80) at 18, 38, 760, 120, and 200 kHz (from left to right). Each panel in a screenshot (row) represents the same 30-min interval (x-axis), but vertical scales can differ among panels. Note distinct layers of backscatter at 120 and 200kHz around 100 m depth in the upper rows and diffuse layers of backscatter at 38kHz in both examples.
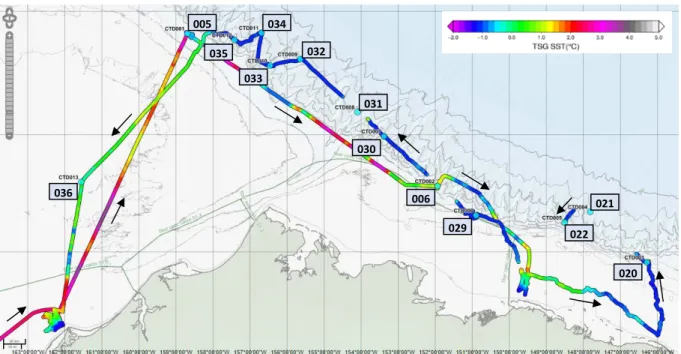
Figure 4.2. Underway sea-surface temperature from November 9 – Nov 22 covering the period of GO- WEST sampling with CTD locations and direction of travel indicated.
Station 006
Upper slope north of Utqiavik
005
006 021
020 033
032
031 030
029 022
036
035
034
Figure 4.3.
Underway data from ship’s EM302 sounder (Depth, top panel),
thermosalinograph (temperature and salinity), spectral radiometer (PAR) and MET station (wind speed, bottom panel). Red vertical lines indicate the start times for 11 SUIT hauls.
Underway measurements along the cruise track are summarized in Figs. 4.2 and 4.3. Gaps in the record are due to equipment failures or when the presence of heavy ice required the centerboard to be raised.
Near-surface temperatures were still remarkably warm (1-4 °C) while transiting along the Chukchi Sea shelf to the ONR mooring site (CTD001) and remained similarly high until the ship first encountered ice along the Beaufort slope to the east of station 006 (CTD002). Temperatures thereafter remained largely below -1°C except when traveling in open water on the Beaufort shelf between the shorefast ice and the advancing ice edge. Temperatures on the Chukchi shelf had cooled to less than 1°C by the end of the GO- WEST sampling on November 21 (return track in Fig. 4.2).
4.3 Oceanography and water / plankton sampling with CTD/Rosette Methods
GO-WEST oceanographic sampling was conducted with the shipboard CTD Rosette (Seabird911 CTD/sensor package and 24 12L Niskin bottles) at 13 stations from November 10-20, 2019 (Table 4.1).
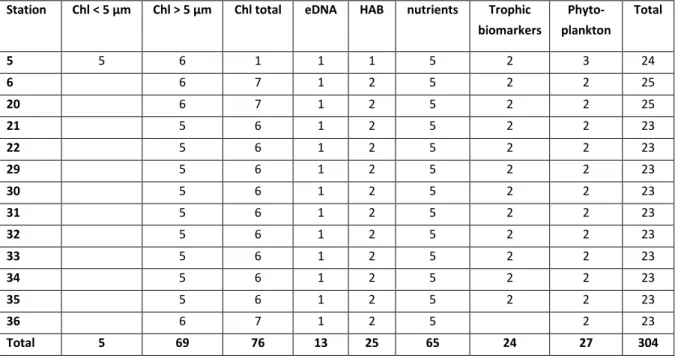
Casts were generally the first event at GO-WEST stations, lasting approximately 45 minutes from deployment to recovery. Casts were conducted to 300m depth or 3-5 meters from the seafloor at shallower locations. CTD sensor data were recorded throughout the cast and batch processing was done immediately upon recovery. Niskin bottle water samples were taken at predetermined depth strata during the upcast: bottom, secondary chlorophyll maximum, just below the pycnocline, chlorophyll maximum, and surface. Two bottles were triggered at each depth. Water samples were collected and/or filtered following the NOAA-AFSC-FOCI protocols for later laboratory analysis of nutrients (n=65; Calvin Mordy, JISA, University of Washington), total chla (n=76, GF/F filter, Lisa Eisner, NOAA-AFSC, Seattle), size- fractionated >5µm chla (n=69), and 10% buffered formalin preserved samples (n=27; Jeanette Gann, NOAA-AFSC, Juneau). Additional samples were filtered for Harmful Algal Bloom detection (HABs) using GF/F filters and microscopic samples preserved in Lugol solution (n=25; Kathy Lefebrve, NOAA-NWFSC), for biomarker analysis of Particulate Organic Matter (POM) using GF/F filters (n=24; Hauke Flores, AWI), and for eDNA analyses using 0.2μm filters (n=13; Andres Lopez, UAF).
Preliminary results
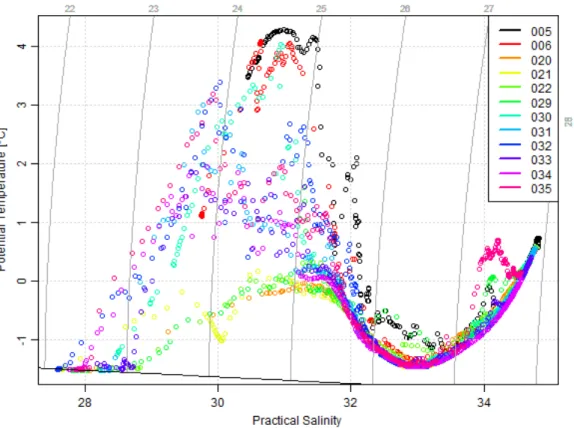
The water column structure was typically characterized by highly stratified water masses with very similar surface and deep waters across the region, but considerable differences at intermediate densities (Fig.
4.4). Surface waters (~0-30 m) generally had low temperatures (0 to -1.5°C) and low salinities (27-29) due to strong atmospheric cooling at the surface prior to and during the cruise and generally high freshwater runoff in the region (Fig. 4.4). In spite of low light levels, moderate production appeared to be occurring in the surface layer as evident in chlorophyll concentrations up to 0.25 mg m-3 at many stations. Eastern Beaufort Sea surface waters were especially cold with the thickest, oldest sea ice covering the Beaufort Sea by mid-November. Below the pycnocline (20-35m), remnants of warmer waters from the summer with significant heat content remained at depths of about 30-70m. This summer layer was characterized by warmer but highly variable temperatures (1-4°C) and higher salinities (30-32). Below this warmer layer, a cold (<0°C), more saline (31-33) mixed Arctic water layer extended down to ~200m depth, overlaying a warmer (>0°C), highly saline (33-34) layer of Atlantic deep water that impinges on the Chukchi and Beaufort Sea slopes. This water originates in the North Atlantic and circulates around the Arctic Basin and may provide a warm-water ‘refuge’ for adult Polar cod, as suggested by the layer of strong backscatter around 200 m and deeper along portions of the cruise track and previously observed in the Canadian Beaufort Sea (Benoit et al. 2014).
Figure 4.4. Temperature-salinity plots for all CTD stations occupied in the outer shelf, slope, and basin region (Table 4.1)
Figure 4.5. Temperature, salinity, chlorophyll fluorescence and oxygen profiles at station 020 near the Beaufort Sea shelf break at 169 m.
In addition to the fishing stations, we conducted oceanographic sampling at Station 36 (CTD0013), the final GO-WEST station on the northern Chukchi Sea Shelf at the location of the UAF-CFOS Chukchi Ecosystem Observatory (CEO) mooring site at 48m depth (Dr. Seth Danielson, UAF). It was characterized by a well-mixed surface layer of cool water (0°C) to 35m, with a warmer benthic boundary layer extending 10m above the bottom. All samples were taken at the station with the exception of POM filters for biomarkers.
Table 4.2. Overview of samples taken with the CTD rosette by sampled parameter. Chl = Chlorophyll a concentration; eDNA = environmental DNA, HAB = harmful algae.
Station Chl < 5 µm Chl > 5 µm Chl total eDNA HAB nutrients Trophic biomarkers
Phyto- plankton
Total
5 5 6 1 1 1 5 2 3 24
6 6 7 1 2 5 2 2 25
20 6 7 1 2 5 2 2 25
21 5 6 1 2 5 2 2 23
22 5 6 1 2 5 2 2 23
29 5 6 1 2 5 2 2 23
30 5 6 1 2 5 2 2 23
31 5 6 1 2 5 2 2 23
32 5 6 1 2 5 2 2 23
33 5 6 1 2 5 2 2 23
34 5 6 1 2 5 2 2 23
35 5 6 1 2 5 2 2 23
36 6 7 1 2 5 2 23
Total 5 69 76 13 25 65 24 27 304
4.4 Mesozooplankton sampling
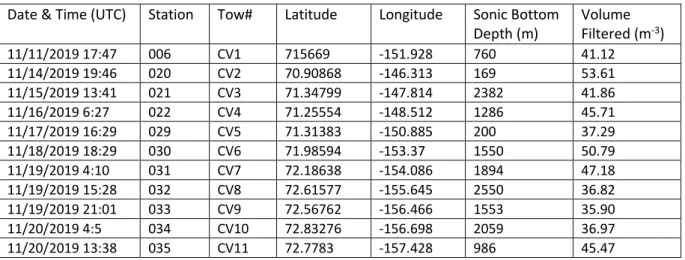
Mesozooplankton was sampled at each station with a 25-cm diameter CalVET system (CalCOFI Vertical Egg Tow) having 150-µm mesh nets (Table 4.3). Each net was equipped with General Oceanics flowmeters in the mouth of the net to monitor volume filtered. The net was fished vertically from approximately 100 m depth to the surface. The samples were preserved in a 10% formalin/borax/sea water solution for later analysis. In addition, a 0.5-m diameter, 150-µm mesh ring net was deployed at 10 stations to collect live animals for respiration measurements (see Section 4.5 for details). The contents of the samples were examined visually and under the microscope for preliminary assessment of zooplankton composition and distribution.
Zooplankton appeared more abundant at shallower (<300 m) stations located on the Chukchi-Beaufort shelf. Small (<1.5 mm total length) copepods Pseudocalanus spp. numerically predominated, while larger (>2.5 mm total length) copepods Calanus glacialis and chaetognaths Parasagitta elegans apparently comprised most of the biomass. The population of Calanus glacialis, a foundation species in the Arctic food web, consisted mostly of late copepodite stages C4-C5; however, occasional adult individuals were also present. Large lipid droplets were evident in all C. glacialis individuals, indicating good feeding conditions during previous months. Contrary to the widely accepted belief, C. glacialis copepods appeared actively moving and feeding, showing no signs of seasonal diapause on the shelf. Larger zooplankton
Table 4.3. Summary of CalVET tows.
Date & Time (UTC) Station Tow# Latitude Longitude Sonic Bottom
Depth (m) Volume Filtered (m-3)
11/11/2019 17:47 006 CV1 715669 -151.928 760 41.12
11/14/2019 19:46 020 CV2 70.90868 -146.313 169 53.61
11/15/2019 13:41 021 CV3 71.34799 -147.814 2382 41.86
11/16/2019 6:27 022 CV4 71.25554 -148.512 1286 45.71
11/17/2019 16:29 029 CV5 71.31383 -150.885 200 37.29
11/18/2019 18:29 030 CV6 71.98594 -153.37 1550 50.79
11/19/2019 4:10 031 CV7 72.18638 -154.086 1894 47.18
11/19/2019 15:28 032 CV8 72.61577 -155.645 2550 36.82 11/19/2019 21:01 033 CV9 72.56762 -156.466 1553 35.90
11/20/2019 4:5 034 CV10 72.83276 -156.698 2059 36.97
11/20/2019 13:38 035 CV11 72.7783 -157.428 986 45.47
retained by the nets were juvenile hyperiids (Themisto libellula), euphausiids (Thysanoessa raschii and T.
inermis) and mysids (Neomysis rayii, Acanthomysis pseudomacropsis). Numerous juvenile (<0.5mm) hydrozoan jellyfish were also encountered in the samples.
In contrast to the outer shelf stations, zooplankton collected over deeper slope and basin areas appeared substantially less abundant. While the community was numerically dominated by small Pseudocalanus spp. and Oithona spp. copepods, the bulk of the biomass appeared to be attributable to larger Metridia longa. The M. longa population consisted of late C5 copepodites and adult females. While single, large Calanus hyperboreus females occasionally occurred in the samples, virtually no C. glacialis copepodites were found. The omnivorous M. longa undergoes diel migrations to feed on phyto- and microzooplankton in the surface layer, while C. glacialis and C. hyperboreus descend to greater depth in autumn until the following spring. Thus, in the deep areas, M. longa appears the most likely prey for planktivorous predators during Arctic fall and winter. Surprisingly, a few specimens of typically nearshore and neritic mysids (N. rayii) were found in the vertical tows indicating far reaching cross-shelf transport of coastal water towards the basin.
4.5 Macrozoopklankton and fish sampling 4.5.1 Overview
Macrozooplankton and fish were sampled at the ice-water interface using the SUIT and throughout the upper 100-200 m using a midwater trawl (Methot or IKMT). The SUIT was equipped with a fish net with a mesh size of 7mm and a mesozooplankton net with a mesh size of 300 μm. The SUIT was successfully deployed at 11 stations, but ice conditions prevented us from sampling the water column with a midwater trawl at all but 3 of those stations (Table 4.1). A variety of environmental data were collected at each station using environmental sensors attached inside the SUIT (Table 4.4). SUIT sensors included an altimeter (Tritech PA500) to measure distance to ice, a hyperspectral sensor (RAMSES, TRiOS) to measure optical properties of the ice during daytime hauls, a CTD (Sea and Sun) to measure depth, temperature, salinity and chlorophyll a concentration, and an Acoustic Doppler Current Profiler (ADCP, Nortek Aquadopp) to measure speed through water and estimate volume filtered. Ice draft was estimated from
Table 4.4. Sensor data during SUIT hauls and sea ice properties as noted by observers on the bridge. SUIT sensor data are mean values for the duration of the trawltime between the start of shearing and the beginning of recovery. Sea ice properties were taken from the ASSIST log entry closest in time to SUIT hauls. Daytime codes: D =day; N = night; T = twighlight. Chl a = chlorophyll a concentration. Ice type codes: FYI = first-year ice < 70 cm; YG-1 = young grey ice 10-15 cm thick; YG-2 = young grey ice 15-30 cm thick
SUIT sensor data Ship sea-ice
observations (ASSIST) Station Depth Day-
time SUIT
distance SUIT
speed SUIT
area SUIT volume Ice
draft Tem-
perature Sal. Chl a Ice conc. Ice
type Thick- ness
[m] [m] [m s-1] [m2] [m3] [cm] [°C] [mg m-3] [%] [cm]
006 760 D 2201 1.27 4401 8803 n.a. 0.82 28.15 0.64 0 n.a. n.a.
020 169 D 1454 0.85 2908 5816 39.56 -1.53 27.63 0.59 100 YG-2 30
021 2382 T 1254 0.83 2508 5017 35.52 -1.51 27.26 0.51 100 YG-2 25
022 1286 N 1920 1.26 3841 7682 28.18 -1.53 27.77 0.50 100 FYI 35
029 200 T 1082 0.59 2163 4327 14.21 n.a. n.a. 0.45 100 YG-2 25
030 1550 D 1996 1.48 3993 7986 23.93 n.a. n.a. 0.46 90 YG-1 16
031 1894 N 1559 0.93 3117 6234 19.56 -1.53 27.53 0.55 60 YG-1 10
032 2550 T 815 n.a. 1630 3259 20.55 -1.51 n.a. 0.52 90 YG-1 10
033 1553 D 591 0.81 1182 2364 11.22 -1.52 26.89 0.54 100 YG-1 10
034 2059 N 1405 0.86 2810 5621 50.90 -1.52 27.02 0.46 100 YG-1 15
035 986 N 1622 0.89 3243 6487 40.73 -1.52 27.76 0.54 70 YG-1 20
the depth measured by the CTD’s pressure sensor and the distance of the SUIT to the ice derived from altimeter data. Ice conditions during each SUIT haul were also characterized based on hourly ice observations conducted from the ship’s bridge throughout the period when the ship was operating in or near the ice (Table 4.4). Additional environmental data are available from the ship’s data archive, including SAR images of ice cover at each SUIT haul that were typically taken within a few hours before or after the haul. All biological samples from both SUIT nets and from the midwater nets were immediately processed on board and preserved for later laboratory analyses in the US and Europe.
4.5.2 Macrozooplankton and under-ice fauna Methods
Macrozooplankton caught in the SUIT net were immediately identified to the lowest taxonomic level possible and counted. Macrozooplankton specimens were stored frozen for later analysis in the US and Europe (Table 4.5). Clione limacina, Gammarus wilkitzkii and several other macrozooplankton species were sampled for trophic biomarker analysis and stored at -80°C (Table 4.6). Mesozooplankton from the SUIT’s 300 µm mesh net was preserved in formaldehyde for later taxonomic analysis in the US and Europe. Abundant samples were split with a folsom zooplankton splitter, and 50% of the catch were size- fractionated (2000, 500, 150 µm) and stored in petri dishes at -20°C.
Preliminary results
We caught macrozooplankton in open water and under the sea-ice at 11 stations. Sampling at station 006 was conducted in open water, all other stations were sampled under the sea ice. On the continental shelf
(Station 020, 029), macrozooplankton abundance was low. Interestingly, at station 20 Gammurus wilkitzkii was the most abundant organism, while it appeared in low density at station 21 in the basin. The stations on the continental slope (006, 022, 030, 033, 035) were characterized by varying densities of macrozooplankton. Station 022, 030 and 033 had low densities of macrozooplankton, while stations 006 and 035 had high densities of macrozooplankton and ice amphipods. At station 006, where no ice was present, the highest densities of Themisto spp. and Hyperiidae occurred. These species were absent from most other ice-covered stations. At the deep water stations (021, 031, 032, 034), the highest densities of macrozooplankton were found. Clione limacina comprised a high fraction of the total abundance at stations 031 and 032, but was absent at station 021. Interestingly, Neomysis rayii was present in high densities at stations 031 and 034. Neomysis rayii is a mysid living in coastal waters and not known to be associated with the under ice habitat. In addition, amphipods of the family Podiceridea were found under the sea ice at these stations. These benthic, tube-building amphipods have not been reported under the sea ice. These neritic species so far offshore in the under-ice habitat were possibly advected with Bering Sea water intruding into the central Arctic Ocean. The species composition of the two Methot trawls differed markedly from that of the SUIT samples, and between the two Methot trawl stations (Fig. 4.6 b).
Unlike the ice-covered SUITstations, euphausiids (Thysanoessa) and amphipods constituted a significant proportion of the community sampled by the Methot trawl. At station 006, a large number of sycophozoan jellyfish heavily dominated the catch in terms of biomass. This pattern was not evident at Station 020 in the ice, where amphipods dominated the catch composition in terms of abundance.
Altogether 341 macrozooplankton specimens were sampled for further analysis in the home laboratories, including dietary, taxonomic and genetic studies (Table 4.5). From these, we sampled 48 specimens for trophic biomarker analysis (fatty acid composition, compound-specific stable isotope analysis, IP25) (Table 4.6). These analyses
a) b)
Figure 4.6. a) Catch per unit effort (CPUE) of macrozooplankton species caught with SUIT at each station; b) relative composition of macrozooplankton species sampled with the Methot trawl and station 006 and 020.
Table 4.5. Number of macrozooplankton samples taken from the IKMT, Methot and SUIT trawls by preservation type.
IKMT Methot SUIT Total
Station -20°C Formal- dehyde
100 % EtOH
-20°C -80°C Formal- dehyde
100 % EtOH
-20°C -80°C Formal- dehyde
6 3 46 2 5 3 14 2 75
20 13 10 2 3 9 5 2 44
21 2 1 2 32 7 2 46
22 14 1 1 16
29 1 2 3 1 7
30 3 40 2 45
31 22 5 2 29
32 8 1 1 10
33 4 2 1 7
34 1 25 4 30
35 1 24 6 1 32
Total 2 1 3 59 12 7 14 194 36 13 341
Table 4.6. Numbers of samples taken for trophic biomarker analysis from macrozooplankton species at each station (SUIT, Methot trawl and IKMT combined)
Sta- tion
Aphe- rusa glacialis
Clione lima-
cina
Eusi- rus holmii
Gam- marus wilkitzkii
Hyperi- idae
Metri- dia longa
Onisi- mus spp.
Themisto libellula
Thysano -essa inermis
Thysano -essa raschii
Other taxa
To- tal
006 1 1
020 3 5 3 2 2 15
021 3 3 6
022 1 1
029 1 1 2
030 1 1 2
031 1 1 3 5
032 1 3 4
033 1 1 2
034 1 3 4
035 1 1 2 1 1 6
Total 1 10 2 13 1 3 3 3 2 2 8 48
4.5.3 Fish Methods
We successfully captured fish at the ice-water interface and in the water column using the SUIT and two midwater trawls. A total of 170 juvenile Polar cod, ranging from 1 to a record 38 fish per station were captured and processed (Table 4.7). Most fish were measured (TL, SL), weighed and processed for subsampling of tissue samples immediately after retrieval. Tissue samples from Polar cod included finclips for population genetic analyses, stomachs for diet analysis, hind guts for microbiome analysis, muscle
tissue for trophic biomarker analysis, and otoliths for age determination, field metabolic rate and migration analyses (Table 4.8).
Preliminary results
Of three midwater trawls, only the first Methot trawl at station 006 in open water caught any fish, including one Arctic sandlance and 18 Polar cod. The only fish besides Polar cod that were captured in the SUIT nets were one Arctic sandlance and 5 threespined sticklebacks in the open water haul (Station 006).
The capture of stickleback, which typically prefer fresh and brackish water, at a station almost 50 miles offshore at the shelfbreak was unexpected. All SUIT hauls that were conducted under ice caught only Polar cod, zooplankton and ice amphipods (Table 4.7, Fig. 4.6a).
The spatial distribution of Polar cod standardized catches did not show an obvious east-west gradient, with similar densities in the Beaufort and Chuckchi Seas (Fig. 4.7). Similarly, sizes and weights did not show a strong spatial pattern, but abundance and mean weight were positively correlated (r = 0.581, p = 0.061), implying that larger fish occurred at stations with higher densities. Mean size and weight across stations ranged from 61-79 mm and 1.4 to 3.4 g. Over 80% of indiviudals were between 60 and 85 mm, with an overall range from 42 to 142 mm (Fig. 4.8).
Figure 4.7: Catch-per-unit-effort (CPUE in numbers per average volume filtered) and mean weight (g) of Polar cod (Boreogradus saida) at 11 SUIT fishing locations occupied during the cruise.
Exploratory analyses (Fig. 4.10) suggest an increase in catch per-unit-effort of Polar cod with older, thicker ice from the shelf towards the basin, as evident in positive relationships with depth and average ice draft of the SUIT haul, both of which are statistically significant at the 95% confidence level (Fig. 4.9). CPUE also declined with the average Chlorophyll concentration. There was no apparent relationship between Polar cod CPUE and light levels (‘Daytime’) or between Polar cod CPUE and salinity or temperature. An intriguing relationship was the strong positive relationship between the CPUE of Polar cod and the abundance of Onisimus spp. (R2 = 0.56; p = 0.008), which is a potential prey species, but may also compete with Polar cod for similar prey.
Table 4.7. Number of fish caught in SUIT and Methot hauls by station and species.
Station Gear Ammodytes hexapterus
(Arctic sandlance) Boreogadus saida
(Polar cod) Gasterosteus aculeatus (Threespined stickleback)
006 Methot 1 18 0
006 SUIT 1 1 5
020 SUIT 0 9 0
020 Methot 0 0 0
021 SUIT 0 31 0
021 IKMT 0 0 0
022 SUIT 0 7 0
029 SUIT 0 2 0
030 SUIT 0 37 0
031 SUIT 0 18 0
032 SUIT 0 6 0
033 SUIT 0 2 0
034 SUIT 0 21 0
035 SUIT 0 19 0
Total Method 1 18 0
Total SUIT 1 152 5
Total All 2 170 5
Table 4.8. Numbers of tissue samples taken from polar cod specimens for various purposes.
Station FIN CLIP GONAD HIND GUT LIVER MUSCLE OTOLITH L STOMACH Total
006* 18 18 18 18 18 18 108
020 6 6 6 6 6 6 36
021 26 8 26 15 17 26 25 143
022 7 6 3 3 7 7 33
029 2 1 1 2 2 2 10
030 37 24 3 3 23 25 115
031 17 8 3 3 8 7 46
032 6 6 3 3 6 6 30
033 2 1 2 2 2 2 11
034 21 4 3 3 4 4 39
035 18 2 3 3 3 3 32
Total 160 8 102 60 63 105 105 603
Figure 4.8: Length-frequency distribution of 169 measured B. saida at 11 stations along the Chukchi Sea and Beaufort Sea slopes.
a) b)
Figure 4.9. Relationships between catch numbers of Boreogadus saida and (a) depth and (b) ice thickness. Negative binomial regression fits (blue lines with 95% confidence bands), suggest a significant increase in catch numbers from the shelf towards the deep basin (R2=0.31, p=0.017) and with increasing ice thickness (R2=0.40, p=0.0013). The regression model scales catch numbers by sampling effort (surface area sampled by SUIT).
Figure 4.10. Polar cod abundance (CPUE, ind. ha-1) versus (a) ice draft, (b) chlorophyll a concentration, (c) salinity, (d) ocean depth and (e) abundance of the ice amphipod Onisiumus spp., and comparative box plots of (f) Polar cod CPUE at different light regimes (D=day, N=night, T=twighlight), (g) length distribution at each station, and (h) length compositions from the Methot net at station 006 versus those from SUIT at all stations.
a) b)
c) d)
d) e)
g) h)
4.6 Zooplankton Respiration Methods
At ten stations (Table 4.9), a ring net (0.5m diameter, 150 µm mesh size) was hauled vertically from 50 m depth or, at shallower stations, from near the sea floor to the surface. The ring net was deployed twice in order to increase the sample size of zooplankton organisms per station. The organisms were pre-sorted according to condition, species and stage in a temperature-controllewd room (3-5°C) and briefly stored in filtered seawater (GFF filter, 25 mm). The individuals then were transferred into a sensor dish plate (PreSens, Regensburg, Germany) comprising 24 compartments (wells) for the measurement of individual respiration (Fig. 4.11). Up to 20 specimens were placed in the respiration setup, while at least four wells remained empty for the detection of bacterial respiration. After sealing, the plate was submerged in a glycol solution in a flow-through chamber connected to a Polystat pump chiller (Cole-Parmer, Vernon Hills, IL) and the assembly was placed on top of a sensor dish reader (PreSens, Regensburg, Germany). The measurement temperature was maintained at -1.0°C (except during preliminary trials). Accordingly, the wells were filled with pre-aerated filtered station water at -1.0°C right before sealing. All respiration measurements were performed in the dark and lasted for 13 – 25h.
Preliminary results
In these on-board experiments, we focused predominately on juvenile Calanus glacialis (Stages IV and V) and Metridia longa (stage V juveniles and adult females), because these species’ appeared to be most dominant by biomass and therefore are an important component of the Arctic food web. In addition, preliminary experiments showed that a body length of approximately 5 mm was most suitable for the detection of a respiratory signal in a water body of 5 ml volume.
This study aimed to reveal the spatial variability in the metabolic rate of dominant zooplankton species in the Beaufort and Chukchi Sea in November, covering water masses from shallow near-shore (experiment no 7 and 8) to deep-water sites (experiment no 2 and 5), including a variety of ice conditions. The results will be examined in relation to standing stock biomasses of phyto- and mesozooplankton that were recorded during this cruise. Further, the existing hypothesis that Calanus glacialis goes into a diapause in shelf-habitats during winter months was tested by comparing its metabolic rate between nearshore and offshore sites. As a third objective, metabolic rates of Metridia longa obtained in the field with the aid of a new respiration setup were compared to the few published data available from traditional approaches.
The final calculation of body weight specific rates of O2 consumption that are considered as a proxy for metabolic rate require the land-based determination of individual dry weight. To that end, specimens used in the experiments were individually frozen in pre-weighed aluminum foil for weighing in the laboratory.