1
Supplementary Information.
Metallophores associated with Trichodesmium erythraeum colonies from the Gulf of Aqaba
Martha Gledhill1*, Subhajit Basu2,3, and Yeala Shaked2,3
1. GEOMAR Helmholtz Centre for Ocean Research, 24148 Kiel, Germany
2. The Fredy and Nadine Herrmann Institute of Earth Sciences, Hebrew University of Jerusalem, Jerusalem 9190401, Israel
3. The Interuniversity Institute for Marine Sciences in Eilat, Eilat 88103, Israel
Electronic Supplementary Material (ESI) for Metallomics.
This journal is © The Royal Society of Chemistry 2019
2
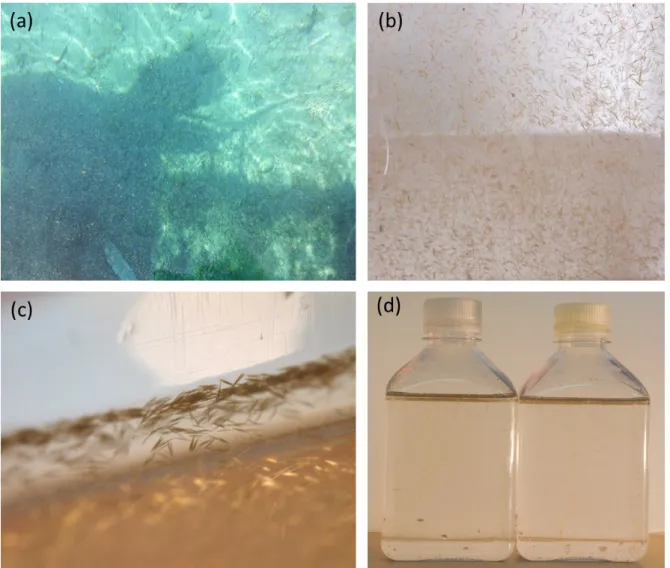
Figure S1. Observation and incubation of Trichodesmium bloom. (a) Saw-dust accumulation of Trichodesmium colonies at IUI pier, Gulf of Eilat. (b,c) Exclusive occurrence of needle shaped-tuft colonies of Trichodesmium erythraeum, and (d) Colonies suspended in FSW for further incubations.
3
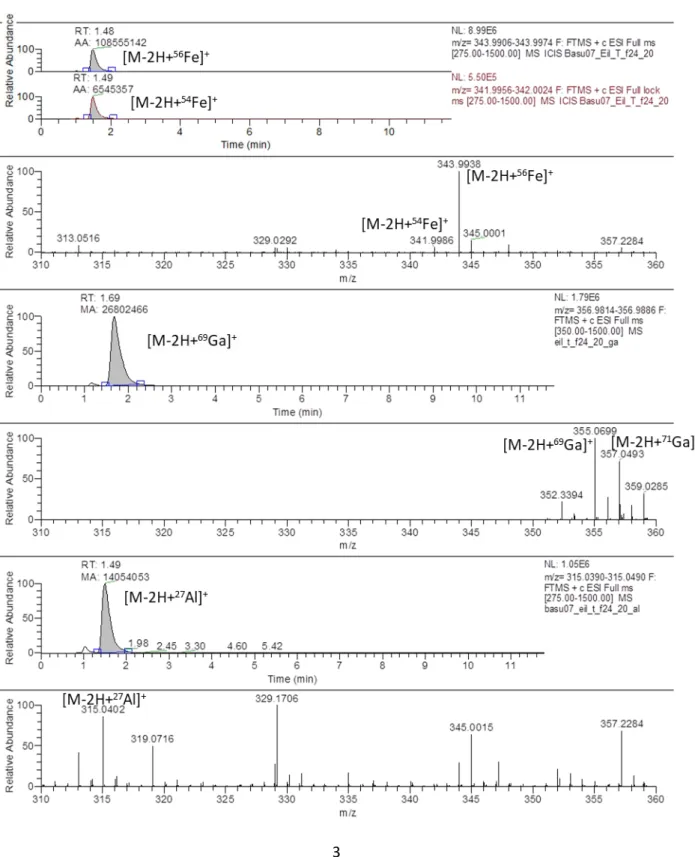
Figure S2. Extracted mass chromatograms and mass spectra for identified metallophores. In each figure the top panel shows chromatograms for a) the peaks for the 56Fe and 54Fe isotopes observed in the +Fe aliquot, b) the mass spectra for the Fe complex, c) the peak for the 69Ga isotope observed in the +Ga aliquot, d) the mass spectra for Ga complex, e) the peak for the 27Al isotope observed in +Al aliquot and f) the mass spectra for the Al complex. Mass spectra are average mass spectra observed ±0.4 minutes of the peak apex.
Metallophore m/z [M-2H+Fe]+: 343.994
4 Metallophore m/z [M-2H+Fe]+: 408.084
[M-2H+56Fe]+
[M-2H+54Fe]+
5 Metallophore m/z [M-2H+Fe]+: 435.095
[M-2H+54Fe]+
[M-2H+56Fe]+
[M-2H+69Ga]+ [M-2H+71Ga]+
6 Metallophore m/z [M-2H+Fe]+: 436.079
[M-2H+54Fe]+
[M-2H+69Ga]+ [M-2H+71Ga]+
7 Metallophore m/z [M-2H+Fe]+: 450.058
[M-2H+54Fe]+
[M-2H+56Fe]+
[M-2H+69Ga]+ [M-2H+71Ga]+
8 Metallophore m/z [M-2H+Fe]+: 526.081
[M-2H+54Fe]+
[M-2H+69Ga]+ [M-2H+71Ga]+
9 Metallophore m/z [M-2H+Fe]+: 538.100
10 Metallophore m/z [M-2H+Fe]+: 542.059
[M-2H+54Fe]+
[M-2H+71Ga]+ [M-2H+69Ga]+
11 Metallophore m/z [M-2H+Fe]+: 614.273, Ferrioxamine B
[M-2H+54Fe]+
[M-2H+56Fe]+
[M-2H+69Ga]+ [M-2H+71Ga]+
12 Metallophore m/z [M-2H+Fe]+: 620.103
[M-2H+54Fe]+
13 Metallophore m/z [M-2H+Fe]+: 654.268, Ferrioxamine E
[M-2H+54Fe]+
[M-2H+56Fe]+
[M-2H+69Ga]+ [M-2H+71Ga]+
14 Metallophore m/z [M-2H+Fe]+: 672.279, Ferrioxamine G
[M-2H+54Fe]+
[M-2H+69Ga]+ [M-2H+71Ga]+
15 Metallophore m/z [M-2H+Fe]+: 678.257
[M-2H+54Fe]+
[M-2H+56Fe]+
[M-2H+69Ga]+ [M-2H+71Ga]+
16 Metallophore m/z [M-2H+Fe]+: 684.120
[M-2H+54Fe]+
[M-2H+69Ga]+ [M-2H+71Ga]+
17 Metallophore m/z [M-2H+Fe]+: 720.253
[M-2H+54Fe]+
[M-2H+56Fe]+
[M-2H+69Ga]+
[M-2H+71Ga]+
18 Metallophore m/z [M-2H+Fe]+: 726.229
[M-2H+54Fe]+
[M-2H+69Ga]+ [M-2H+71Ga]+
19 Metallophore m/z [M-2H+Fe]+: 753.240
[M-2H+54Fe]+
[M-2H+56Fe]+
[M-2H+69Ga]+
[M-2H+71Ga]+
20 Metallophore m/z [M-2H+Fe]+: 780.251
[M-2H+54Fe]+
[M-2H+69Ga]+ [M-2H+71Ga]+
21
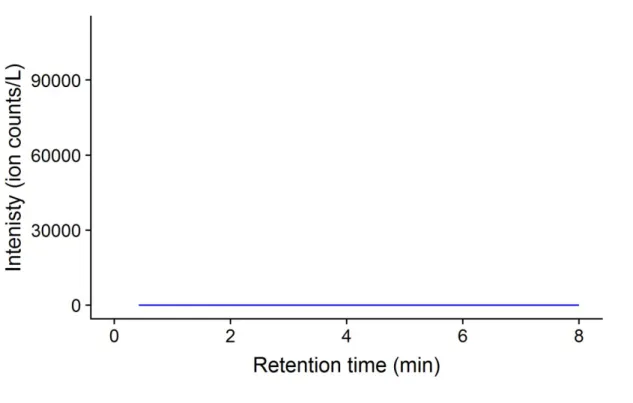
Figure S3. Example extracted ion chromatogram including all metallophore masses in Table 1 obtained for an extract of IMS101. IMS101 was grown to the stationary phase (Day 14) in a modified YBCII media with 20 µM EDTA and 40 nM Fe1. We did not observe any colonies in our cultures.
Filament concentrations were ca. 13,300 mL-1. Ion counts are normalised to the volume of culture media extracted (100 mL). Three samples were analysed in total and the final preconcentration factor was ca. 1000. The y axis scale is the same as that used in Fig. 1 of the main manuscript.
22
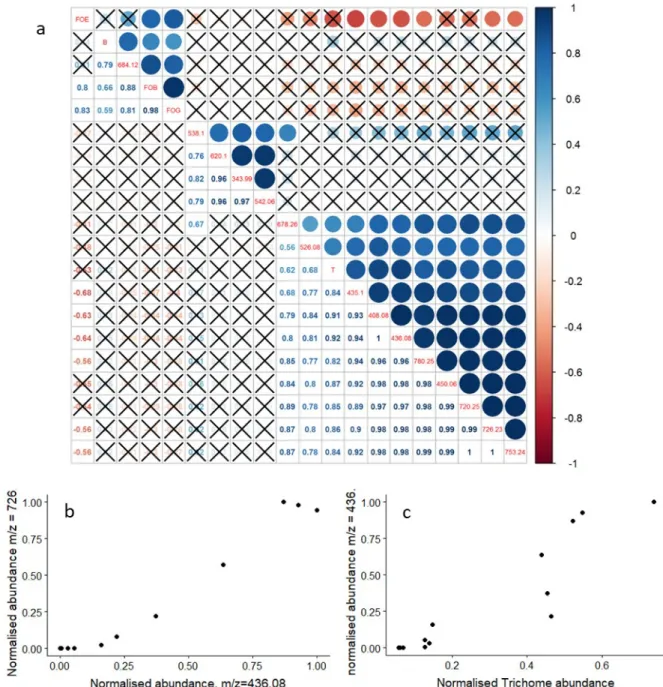
Figure S4. Correlation coefficients, r calculated between normalised metallophore abundances, bacterial numbers (B) and Trichodesmium filament counts (T). Abundances were normalised to the maximum observed value across all thirteen incubation experiments and are shown in Table S. (a) Table showing the correlation coefficient, r, obtained when comparing metallophores, bacteria numbers and Trichodesmium numbers between treatments (bottom left half of diagram). Symbol area and colour (upper right part of diagram) is proportional to the correlation coefficient (for scale see colour bar). Correlations with p>0.05 are crossed out. All incubation experiments were used for the correlations (n=13). Correlations were calculated in R and the figure constructed using the package corrplot version 0.84. (b) Example figure showing the variation of normalised ion counts for m/z 726.23 with normalised ion counts for m/z 436.08 across the incubation experiments (r=0.98, p<0.01). (c) Example figure showing variation of normalised Trichome abundance with m/z 436.08 (r=0.92, p<0.05).
23
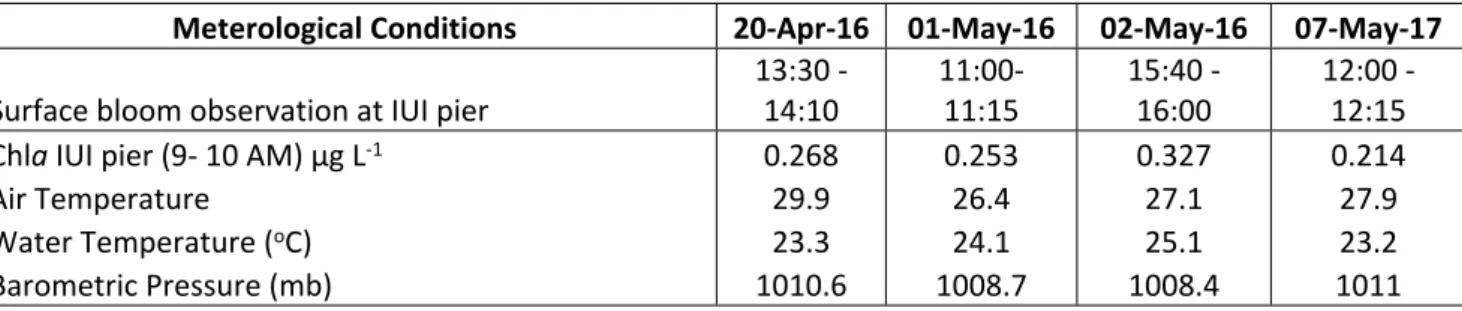
Table S2: Meterological conditions during surface Trichodesmium blooms sampled around IUI, pier.
Meterological Conditions 20-Apr-16 01-May-16 02-May-16 07-May-17 Surface bloom observation at IUI pier 13:30 -
14:10 11:00-
11:15 15:40 -
16:00 12:00 - 12:15
Chla IUI pier (9- 10 AM) µg L-1 0.268 0.253 0.327 0.214
Air Temperature 29.9 26.4 27.1 27.9
Water Temperature (oC) 23.3 24.1 25.1 23.2
Barometric Pressure (mb) 1010.6 1008.7 1008.4 1011
24
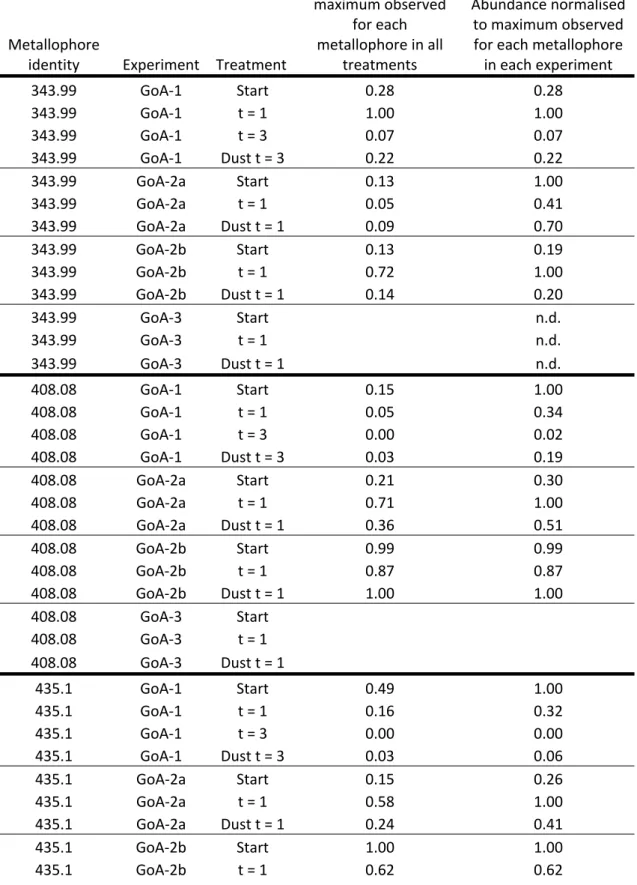
Table S3. Normalised metallophore abundances in incubation experiments. Abundance was normalised within each experiment to identify any treatment effect and across all
incubations to identify relationships with bacteria and Trichome numbers.
Metallophore
identity Experiment Treatment
Abundance normalised to maximum observed
for each metallophore in all
treatments
Abundance normalised to maximum observed for each metallophore
in each experiment
343.99 GoA-1 Start 0.28 0.28
343.99 GoA-1 t = 1 1.00 1.00
343.99 GoA-1 t = 3 0.07 0.07
343.99 GoA-1 Dust t = 3 0.22 0.22
343.99 GoA-2a Start 0.13 1.00
343.99 GoA-2a t = 1 0.05 0.41
343.99 GoA-2a Dust t = 1 0.09 0.70
343.99 GoA-2b Start 0.13 0.19
343.99 GoA-2b t = 1 0.72 1.00
343.99 GoA-2b Dust t = 1 0.14 0.20
343.99 GoA-3 Start n.d.
343.99 GoA-3 t = 1 n.d.
343.99 GoA-3 Dust t = 1 n.d.
408.08 GoA-1 Start 0.15 1.00
408.08 GoA-1 t = 1 0.05 0.34
408.08 GoA-1 t = 3 0.00 0.02
408.08 GoA-1 Dust t = 3 0.03 0.19
408.08 GoA-2a Start 0.21 0.30
408.08 GoA-2a t = 1 0.71 1.00
408.08 GoA-2a Dust t = 1 0.36 0.51
408.08 GoA-2b Start 0.99 0.99
408.08 GoA-2b t = 1 0.87 0.87
408.08 GoA-2b Dust t = 1 1.00 1.00
408.08 GoA-3 Start
408.08 GoA-3 t = 1
408.08 GoA-3 Dust t = 1
435.1 GoA-1 Start 0.49 1.00
435.1 GoA-1 t = 1 0.16 0.32
435.1 GoA-1 t = 3 0.00 0.00
435.1 GoA-1 Dust t = 3 0.03 0.06
435.1 GoA-2a Start 0.15 0.26
435.1 GoA-2a t = 1 0.58 1.00
435.1 GoA-2a Dust t = 1 0.24 0.41
435.1 GoA-2b Start 1.00 1.00
435.1 GoA-2b t = 1 0.62 0.62
25
435.1 GoA-2b Dust t = 1 0.78 0.78
435.1 GoA-3 Start
435.1 GoA-3 t = 1
435.1 GoA-3 Dust t = 1
436.08 GoA-1 Start 0.16 1.00
436.08 GoA-1 t = 1 0.05 0.34
436.08 GoA-1 t = 3 0.00 0.02
436.08 GoA-1 Dust t = 3 0.03 0.19
436.08 GoA-2a Start 0.22 0.34
436.08 GoA-2a t = 1 0.64 1.00
436.08 GoA-2a Dust t = 1 0.37 0.59
436.08 GoA-2b Start 1.00 1.00
436.08 GoA-2b t = 1 0.87 0.87
436.08 GoA-2b Dust t = 1 0.93 0.93
436.08 GoA-3 Start
436.08 GoA-3 t = 1
436.08 GoA-3 Dust t = 1
450.06 GoA-1 Start
450.06 GoA-1 t = 1
450.06 GoA-1 t = 3
450.06 GoA-1 Dust t = 3
450.06 GoA-2a Start 0.04 0.08
450.06 GoA-2a t = 1 0.53 1.00
450.06 GoA-2a Dust t = 1 0.20 0.39
450.06 GoA-2b Start 1.00 1.00
450.06 GoA-2b t = 1 0.81 0.81
450.06 GoA-2b Dust t = 1 0.83 0.83
450.06 GoA-3 Start
450.06 GoA-3 t = 1
450.06 GoA-3 Dust t = 1
526.08 GoA-1 Start 0.01 0.45
526.08 GoA-1 t = 1 0.03 1.00
526.08 GoA-1 t = 3 0.00 0.00
526.08 GoA-1 Dust t = 3 0.01 0.37
526.08 GoA-2a Start 0.08 0.13
526.08 GoA-2a t = 1 0.58 1.00
526.08 GoA-2a Dust t = 1 0.06 0.10
526.08 GoA-2b Start 0.47 0.47
526.08 GoA-2b t = 1 0.19 0.19
526.08 GoA-2b Dust t = 1 1.00 1.00
526.08 GoA-3 Start
526.08 GoA-3 t = 1
526.08 GoA-3 Dust t = 1
538.1 GoA-1 Start 0.09 0.17
538.1 GoA-1 t = 1 0.51 1.00
26
538.1 GoA-1 t = 3 0.05 0.09
538.1 GoA-1 Dust t = 3 0.04 0.07
538.1 GoA-2a Start 0.02 0.38
538.1 GoA-2a t = 1 0.05 0.71
538.1 GoA-2a Dust t = 1 0.07 1.00
538.1 GoA-2b Start 0.18 0.18
538.1 GoA-2b t = 1 1.00 1.00
538.1 GoA-2b Dust t = 1 0.18 0.18
538.1 GoA-3 Start
538.1 GoA-3 t = 1
538.1 GoA-3 Dust t = 1
542.06 GoA-1 Start 0.05 0.05
542.06 GoA-1 t = 1 1.00 1.00
542.06 GoA-1 t = 3 0.00 0.00
542.06 GoA-1 Dust t = 3 0.03 0.03
542.06 GoA-2a Start 0.03 0.03
542.06 GoA-2a t = 1 1.00 1.00
542.06 GoA-2a Dust t = 1 0.00 0.00
542.06 GoA-2b Start 0.01 0.02
542.06 GoA-2b t = 1 0.61 1.00
542.06 GoA-2b Dust t = 1 0.01 0.02
542.06 GoA-3 Start
542.06 GoA-3 t = 1
542.06 GoA-3 Dust t = 1
620.1 GoA-1 Start 0.13 0.13
620.1 GoA-1 t = 1 1.00 1.00
620.1 GoA-1 t = 3 0.02 0.02
620.1 GoA-1 Dust t = 3 0.09 0.09
620.1 GoA-2a Start 0.02 0.74
620.1 GoA-2a t = 1 0.01 0.38
620.1 GoA-2a Dust t = 1 0.03 1.00
620.1 GoA-2b Start 0.30 0.56
620.1 GoA-2b t = 1 0.54 1.00
620.1 GoA-2b Dust t = 1 0.08 0.15
620.1 GoA-3 Start
620.1 GoA-3 t = 1
620.1 GoA-3 Dust t = 1
678.26 GoA-1 Start
678.26 GoA-1 t = 1
678.26 GoA-1 t = 3
678.26 GoA-1 Dust t = 3
678.26 GoA-2a Start 0.02 0.12
678.26 GoA-2a t = 1 0.14 1.00
678.26 GoA-2a Dust t = 1 0.09 0.66
678.26 GoA-2b Start 0.55 0.55
27
678.26 GoA-2b t = 1 1.00 1.00
678.26 GoA-2b Dust t = 1 0.68 0.68
678.26 GoA-3 Start
678.26 GoA-3 t = 1
678.26 GoA-3 Dust t = 1
684.12 GoA-1 Start 0.00 0.00
684.12 GoA-1 t = 1 0.00 0.00
684.12 GoA-1 t = 3 0.03 0.03
684.12 GoA-1 Dust t = 3 1.00 1.00
684.12 GoA-2a Start
684.12 GoA-2a t = 1
684.12 GoA-2a Dust t = 1
684.12 GoA-2b Start
684.12 GoA-2b t = 1
684.12 GoA-2b Dust t = 1
684.12 GoA-3 Start
684.12 GoA-3 t = 1
684.12 GoA-3 Dust t = 1
720.25 GoA-1 Start 0.01 1.00
720.25 GoA-1 t = 1 0.00 0.00
720.25 GoA-1 t = 3 0.00 0.00
720.25 GoA-1 Dust t = 3 0.00 0.00
720.25 GoA-2a Start 0.06 0.13
720.25 GoA-2a t = 1 0.44 1.00
720.25 GoA-2a Dust t = 1 0.18 0.41
720.25 GoA-2b Start 1.00 1.00
720.25 GoA-2b t = 1 0.98 0.98
720.25 GoA-2b Dust t = 1 0.98 0.98
720.25 GoA-3 Start
720.25 GoA-3 t = 1
720.25 GoA-3 Dust t = 1
726.23 GoA-1 Start 0.02 1.00
726.23 GoA-1 t = 1 0.00 0.10
726.23 GoA-1 t = 3 0.00 0.00
726.23 GoA-1 Dust t = 3 0.00 0.00
726.23 GoA-2a Start 0.08 0.14
726.23 GoA-2a t = 1 0.57 1.00
726.23 GoA-2a Dust t = 1 0.22 0.38
726.23 GoA-2b Start 0.94 0.94
726.23 GoA-2b t = 1 1.00 1.00
726.23 GoA-2b Dust t = 1 0.98 0.98
726.23 GoA-3 Start
726.23 GoA-3 t = 1
726.23 GoA-3 Dust t = 1
753.24 GoA-1 Start 0.08 1.00
28
753.24 GoA-1 t = 1 0.01 0.11
753.24 GoA-1 t = 3 0.00 0.00
753.24 GoA-1 Dust t = 3 0.00 0.00
753.24 GoA-2a Start 0.05 0.10
753.24 GoA-2a t = 1 0.53 1.00
753.24 GoA-2a Dust t = 1 0.14 0.27
753.24 GoA-2b Start 1.00 1.00
753.24 GoA-2b t = 1 0.98 0.98
753.24 GoA-2b Dust t = 1 0.92 0.92
753.24 GoA-3 Start
753.24 GoA-3 t = 1
753.24 GoA-3 Dust t = 1
780.25 GoA-1 Start 0.17 1.00
780.25 GoA-1 t = 1 0.02 0.09
780.25 GoA-1 t = 3 0.00 0.00
780.25 GoA-1 Dust t = 3 0.00 0.00
780.25 GoA-2a Start 0.02 0.04
780.25 GoA-2a t = 1 0.45 1.00
780.25 GoA-2a Dust t = 1 0.06 0.13
780.25 GoA-2b Start 1.00 1.00
780.25 GoA-2b t = 1 0.86 0.86
780.25 GoA-2b Dust t = 1 0.82 0.82
780.25 GoA-3 Start
780.25 GoA-3 t = 1
780.25 GoA-3 Dust t = 1
FOB GoA-1 Start 0.00 0.00
FOB GoA-1 t = 1 0.00 0.00
FOB GoA-1 t = 3 0.56 0.56
FOB GoA-1 Dust t = 3 1.00 1.00
FOB GoA-2a Start
FOB GoA-2a t = 1
FOB GoA-2a Dust t = 1
FOB GoA-2b Start
FOB GoA-2b t = 1
FOB GoA-2b Dust t = 1
FOB GoA-3 Start
FOB GoA-3 t = 1
FOB GoA-3 Dust t = 1
FOE GoA-1 Start 0.00 0.00
FOE GoA-1 t = 1 0.30 0.30
FOE GoA-1 t = 3 1.00 1.00
FOE GoA-1 Dust t = 3 0.80 0.80
FOE GoA-2a Start 0.00 0.01
FOE GoA-2a t = 1 0.00 0.00
FOE GoA-2a Dust t = 1 0.14 1.00
29
FOE GoA-2b Start 0.00 1.00
FOE GoA-2b t = 1 0.00 0.51
FOE GoA-2b Dust t = 1 0.00 0.42
FOE GoA-3 Start 0.26 0.54
FOE GoA-3 t = 1 0.47 1.00
FOE GoA-3 Dust t = 1 0.33 0.69
FOG GoA-1 Start 0.00 0.00
FOG GoA-1 t = 1 0.08 0.08
FOG GoA-1 t = 3 0.70 0.70
FOG GoA-1 Dust t = 3 1.00 1.00
FOG GoA-2a Start 0.00 0.18
FOG GoA-2a t = 1 0.03 1.00
FOG GoA-2a Dust t = 1 0.02 0.82
FOG GoA-2b Start 0.00 0.00
FOG GoA-2b t = 1 0.21 1.00
FOG GoA-2b Dust t = 1 0.00 0.03
FOG GoA-3 Start 0.00 0.48
FOG GoA-3 t = 1 0.00 1.00
FOG GoA-3 Dust t = 1 0.00 0.66