SDT ANALYSIS OF EXPERIMENTAL TIIERMAL PAIN, WITH "SIGNJ\J.;' AND "NO-SIGNAL"
BEING DETERMJNED PSYCIIOPI-IYSICALLY 1' 1
S. LAUTENBACHER, A. MÖIJ'NER, W. P. LEHMANN, G. GALFE, R. HÖLZL, F. STRIAN
C!inical Department, Max Planck Institute for Psychiatry
Summary.-In a signal-detection experimcnt, the effccts of rcpcated pain stimulation and the induction of fear on pain thresholds and SDT paramctcrs wcrc studied. "Signal" and "no-signal" were not defined physically, but by mcans of an in·
dependent criterion as the primary sensations "pain" and "no-pain." First, thc relationship between sensation lcvels for "phasic" (short stimulus, uscd in thc SDT procedure) and "tonic" (langer stimulus, used in the criterion measurcment) hcat stimuli was determined in 14 subjects. lt was quadratic (polynomial rcgrcssion) and sufficient to define the distinction between "signal/pain" and "no-signaJ/no-pain." In the signal-detection experiment, a significant upward trend (adaptation) in thrcshold parameters, hut no systematic change in the SDT parameters (discrimination ability and response bias) was found. Manipulation of anxiety by instructions caused unsyste·
matk changes in discrimination ability. The procedure employed determines both the absolute strength of pain sensation and the ability to discriminate pain f rom no pain.
These variables proved to be independent.
The signal detecÜon theory (SDT) was adopted in pain research with great hopes at first, since it seemed to permit separating the sensory and cognitive-motivational components of pain. However, numerous subsequent experiments have shown that the relationships between these pain compo- nents and SDT parameters are not simple (8, 9). Rollman (14) provided another objection to SDT, saying that the SDT parameters do not enable one to measure either the absolute or the relative strength of pain directly hut only represent the quality of perception in general, and so are not a sub- stitute for traditional psychophysics. The need for lengthy series of stimuli, which limits its clinical usability, was a further reason why SDT methods have lost importance in pain research.
The present study attempts to show ways of moderating or refuting the objections cited, so that the undisputed advantages of SDT methodology (2}
can still be used for pain research. "Signal/pain" and "no-signal/no-pain" are defined psyochophysically as the stimuli which elicit pain and no pain according to an independent criterion. This takes account of the fact that pain is a psychological quality, which cannot be defined physically. For this, we need an independent pain criterion, which can provide the distinction
;This study was supported by Grant Str 273/1-1,1-2 from Deutsche Forschungsgemeinschaft.
Address correspondence to Dr. Friedrich Strian, Clinical Department, Max-Planck-Institut für Psychiatrie (Head: Prof. Dr. Dr. F. Holsboer), Kraepelinstrasse 10, 8000 Munich 40, Federal Repuhlic of Germany.
1020 S. LAUTENBACHER, ET AL.
stated. In such an SDT experiment, the ability to discriminate between
"pain" and "no-pain" can be studied, thereby meeting Rollman's objection.
Definition of "signalfno-signal" along psychological dimensions is known from work in social and mnemonic psychology (3, 10, 19), but has not been used in pain research. A psychophysical definition also off ers the advantage of reducing the number of stimuli needed, by appropriate selection of intensity range.
The independent pain criterion must divide the physical stimulus con- tinuum into two intensity dasses, which are sensorily suitable for eliciting pain or no pain. This is the only practical way to pose a psychophysical signal-detection task meant to refer to the primary sensations. Therefore, it is necessary to find a method of pain measurement which is insensitive to response bias, so that it is suitable for an independent pain criterion. This is true of a modification of the sensitization method described by Severin, et al. (16). In an adjustment procedure, the pain threshold for thermal stimuli is determined. The experimental subjects are stimulated over a period of 30 seconds at the temperatures thus determined. Stimuli of this intensity and duration usually result in a weakening of the sensation (adaptation) in the nonpainful range, and a strengthening of the sensation (sensitization) in the painful range. The compensation of these changes in sensation demanded subsequently indicates any initial bias towards overestimating or underesti- mating the threshold temperature. Furthermore, the procedure can be carried out quickly, enabling one to correct the psychophysical "signal/no- signal" determination at short intervals.
Therefore, the main objective of this study was to try out a two-stage procedure, with the sensitization method being used to determine the psy- chophysically defined variables "signaJ/pain" and "no-signal/no-pain" in Stage 1, and the stimulus classes thus obtained being employed in a signal- detection procedure in Stage 2. The following hypotheses are assumed:
(a) Variations in the absolute magnitude of pain perception (such as long- term adaptation to repeated pain stimuli) cause variations in the independ- ent pain criterion but do not affect the SDT parameters f or discrimination
abillty and response bias, since variations of the absolute magnitude can be taken into account in determining "signal" and "no-signal."
(b) Psychological manipulations ("anxiety induction" in this study) that cause quantitative and qualitative variations in perception in the pain threshold region are reflected by the SDT parameters thus obtained.
In Exp. 1, the quantitative relationship between the sensation levels upon "tonic" (langer stimulus) and "phasic" (shorter stimulus) heat stimuli must be determined first-since tonic stimuli are used to derive the inde- pendent criterion by the sensitization method, and phasic stimuli in the SDT experiment itself. This estimate of the relationship is needed in the
SIGNAL DETECTION OF PAIN 1021 SDT experiment for determining individually the ''signal" and "no-signal"
classes. Then, in Exp. 2, the hypotheses stated above are tobe tested.
ExP. 1:
HEAT PAIN PERCEPTION DURING PHASIC AND TONIC THERMAL STIMUU
Method
Subiects.-Healthy subjects partidpated (7 women, 7 men, of mean age 26.9 yr., standard deviation ± 3.4). They were informed of the course of the experiment and the question being studied. It was also pointed out that they might stop participating at any time. They were paid for participating.
Apparatus (identical /or Exps. 1 and 2).-Cutaneous heat stimuli were applied by means of a stimulator developed in the Department of Neurology of the Max Planck Institute for Psychiatry. The device controls a Marstock thermode (for technical details, see [7]), which functions on the Peltier prin- ciple and can be either heated or cooled. The temperature obtained at the interface between the thermode and the skin was recorded continuously on a pen recorder (Phillips PM8252). This served to check the major stimulus parameters (amplitude, shape of leading edge, duration). The site of the stimulation and measurement was the thenar of the right hand, which was lying on a hemisphere made of hard PVC. The thermode was installed in this hemisphere and was pressed against the skin with a constant pressure by a spring. In the procedures requiring adjustments to be performed, the sub- jects regulated the temperature by means of a knurled wheel 1ocated in the hemisphere, within reach of the index finger. All other stimulus indications were given as spoken ratings.
Procedure.-At the start of the session, the subjects determined their pain thresholds by stimulus adjustment five times. Fifty phasic stimuli were then applied in random sequence, starting from a base temperature of 38 °
Celsius, with three fixed temperatures of 40°C, 42°C, and 44°C, as well as with temperatures varying about the mean of the threshold values deter- mined initially (mean - l.5°C, - 0.5°C, + Q°C, + 0.5°C, + 1.5°C). The phasic stimuli had a triangular wave form, with leading edge gradients from 3°C to 6°C per second, depending on the magnitude of the stimulus. After each phasic Stimulus the subject had to adjust a tonic stimulus to elicit the same intensity of sensation as that produced by the phasic stimulus. This led to a subjective equivalence of sensations produced by the two stimuli. The highest temperature set during this adjustment of the stimulus (mean dura- tion of stimulus adjustment 23.8 sec.) was recorded as the measurand (tonic temperature).
Results
To describe the relationship between the given phasic and the adjusted tonic stimuli, a polynomial regression function was calculated, for each sub-
1022 S. LAUTENBACHER, ET AL.
ject separately, and for the pooled data of the whole group. There was a pronounced linear component (significant for all subjects, p < 5 % ) , and for nine persons, there was also a significant quadratic term (p< 5%). The poly- nomial fitted to the pooled data for the whole group contains both significant linear and quadratic components (p :S 0 .1 % in both cases) and a cubic one (p :S 5 % ) . However, the latter is of no practical relevance for the goodness of the estimate and is disregarded in the following. The quadratic term for the individual subjects and the pooled data of the whole group arose from overestimation of the preset phasic stimuli at low stimulus tem- peratures. Thus the tonic stimulus temperatures were greater than the phasic ones in theses cases. Fig. 1 shows raw data with the fitted polynomials.
--u 0 50
....
-.... E ~
~ 45
....,J
cO Q)
..c::
·a Q 40
- Quadratic regression
· - - Linear regression
- ~ „ „
E- ::..,.
-·-
+
0
l --
35~~ ... ~__, . .---__,...-~~.__,~--~---~~~-
35 40 45 f>O
Phasic heat stimuli (° C)
FIG. 1: JU:lationship between sensation levels for phasic and tonic heat stimuli; raw data
(n = 700) wtth linear and quadratic regression, "tonic" onto "phasic"
J?espite the significant differences between the individual regression equat1ons (p :S 0 .1 % ) , the differences near the threshold values are so small that the regression function computed from the pooled data for the whole 8;1'°UP could be used for Exp. 2 (number of stimulus pairs used in the regres- ston: n = 700):
t = bi{p - 40)2 + b1(p - 40) + b0 + 40
SIGNAL DETECTION OF PAIN 1023 where p is the temperature of the phasic stimulus, t that of the correspond- ing tonic stimulus, and b, the constants of the regression equation: h2 =
0.045, b1 = 0.281, and b0 = 0.981. For the equation presented, the standard error of estimation is 1.553. This ensures that it is good enough to estimate the phasic stimuli for the "signal/pain" and "no-signal/no-pain" dasses from the independent pain criterion by tonic stimulation (sensitization procedure) in Exp. 2. For this, the above equation must be solved for p, in order to ob- tain the desired direction of prediction (20):
- b1 +;.} b~ - 4b2b0 + 4b2(t - 40) 40
p = 2b2 +
This equation was used in Exp. 2 to make a distinction between
"signal/pain" and "no-signal/no-pain": t was taken as the temperature value of the threshold for tonic heat pain produced by the sensitization method and the resulting p then gave the temperature value which separated the two signal classes.
ExP. 2:
SDT ANALYSIS OF EXPERIMENTAL HEAT PAIN
Method
Subjects.-Healthy subjects took part in the study (7 men and 7 warnen, mean age 29.6 yr., standard deviation± 4.2). The conditions under which they participated were the same as those for Exp. 1. One subject did not complete the study so his data were not included in analyses.
Apparatus .-The same material arrangements were used as those for Exp. 1.
Procedure.-In Exp. 2 a two-stage procedure was used. The strength of the stimulus which separates the painful from the nonpainful range was de- termined by an adjustment procedure with tonic thermal stimulation (sensitization procedure) in Stage 1. Then the subjective equivalent for phasic stimulation (called the "cut-off point"} was calculated by means of the correction formula derived in Exp. 1. Next in Stage 2, phasic stimuli above and below the cut-off point were applied to be discriminated as
"signaif pain" and "no-signal/no-pain" in an SDT procedure.
In Stage 1, the sensitization procedure was followed. For the reasoning behind the procedure, see the Introduction. The pain threshold for thermal stimuli was determined by stimulus adjustment, and then the hand was stimulated for another 30 sec. at the adjusted temperature. Depending on the strength of the stimulus, a subjective strengthening of the sensation (sensitization, in the painful range}, weakening of the sensation (adaptation, in the nonpainful range), or no change in the sensation (in the threshold re- gion) occurs during this interval. These changes in sensation reflect
1024 S. LAUTENBACHER, ET AL. ·
variations in the primary processing of the stimulus and are theref ore hardly subject to response bias (16). After the constant stimulation, the subjects were to readjust the stimulus to achieve the same sensation as in the first adjustment. The second stimulus adjustment usually tends to compensate for the changes in sensation that have occurred, correcting errors in the first ad- justment. So the second temperature setting was used as the measure of the pain threshold for tonic stimuli. Next, the phasic temperature corresponding to the tonic stimulus was determined, according to the correction formula derived in Exp. 1. This provided the independent pain criterion required (see Introduction), in the form of a cut-off point for the "painful" and
"nonpainful" ranges, for the SDT experiment.
In Stage 2, the SDT procedure involved 20 phasic stimuli of differing levels which stimuli were applied in a randomized order. The temperatures 40°C, 42°C, and 44°C were each applied twice, to enable the strength of the sensation for physically equal temperatures to be determined. The re- maining 14 stimuli had levels distributed symmetrically around the cut- off point (analogous to Exp. 1: cut-off point - l.5°C, - 0.5°C, + 0°C,
+ 0.5°C, + l.5°C). The stimulus form was the same as that in Exp. 1.
Each stimulus was announced by a signal tone, at an interval ranging from two to five seconds before the stimulus. After the stimulus, the period for evaluation was indicated visually. The subjects were to rank the stimuli on a nine-place scale, ranging from "very painful" (1) to "imperceptible" (9). The distinction between not painful and painful lay between Ratings 4 and 5.
The two-stage procedure, in the form described, was carried out three times (three experimental blocks, consisting of Stages 1 and 2). Thus there were 60 stimuli available for the SDT evaluation, with the cut-off point being redetermined before each block, that is, "signal/pain" and "no-signa1/
no-pain" being defined afresh. The influence of psychological manipulations on the SDT parameters was checked by announcing stronger stimuli (n = 7)
or weaker ones (n = 6) through instructions before the third block. The ef- fect of such induction of anxiety is known from other SDT experiments (5,
11, 15). We wished to compare it with the effect for a psychophysical defi- nition of "signal/no-signal."
Data analysis.-Only the psychophysical measures are presented here.
Details of the statistical analysis are provided in the respective sections of the presentation of the results.
The parameter of the pain threshold f or tonic thermal stimulation was provided by the sensitization procedure. To obtain a pain-threshold parame-
~~r for . t~e phasic t~ermal stimuli applied during the SDT procedure, the 1sotoruc (monotomc) regression of stimulus strength on sensation rating was calculated for each experiment block. With this nonparametric method (1), the perception-probability curve can be determined even for incomplete
SIGNAL DETECTION OF PAIN 1025 and short series of stimuli-such as in this experiment. From these curves, the 50% point according to Stevens ( 17) was calculated as the threshold value.
Since the distribution assumptions of the parametric SDT model could hardly be fulfilled with the small number of stimuli and the novel psycho- physicaI "signal" and "no-signal„ definitions, only nonparametric SDT measures were used. The parameters were always calculated for a block, that is, for 20 stimuli. The plane P(A) under the ROC ("receiver-operator char- acteristic") curve was used as the parameter of the discrimination ability.
The measure B proposed by McNicol (12) was used for the response bias.
The "signal" and "no-signal" classes were determined in two different ways, and evaluated separately:
Open class: signal = all stimuli above the cut-off point, no-signal = all stimuli below the cut-off point.
Baunded class: signal =all stimuli up to J°C above the cut-off point, no-signal =all stimuli down to 3°C below the cut-off point.
The use of bounded classes provides more homogeneous dasses but 1im- its the number of stimuli included. If the "signal" or the "no-signal" dass contained less than three stimuli, no SDT parameters were calculated for . this block.
Results
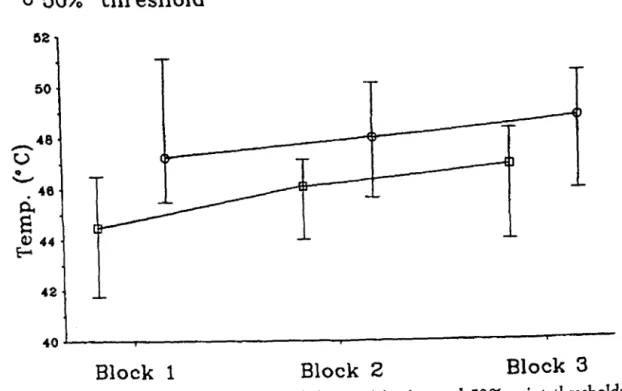
Variations of threshold and SDT parameters over time.-The threshold and SDT parameters, which had been calculated separately for the three blocks (see Data analysis), were subjected to an L-test for monotonically in- creasing or decreasing trends according to Page (13). Such trends are to be expected, in the form of adaptation or sensitization, during repeated pain stimulation over a longer period (6). Both for the sensitization threshoJd for tonic thermal stimulation, and for the 50% threshold for phasic thermal stimuli, a significant increase of the threshold over the blocks was found (p S 5% in each case). Both group trends are illustrated in Fig. 2.
Neither of the two SDT parameters [discrimination ability: P(A), re- sponse bias: B], showed a significant trend, for either of the two ways of forming the "signal" and "no-signal" classes (see Data analysis). Therefore only the results for the bounded dasses are shown in Fig. 3.
The location of the bias va1ues about 4 .5 in the three blocks shows that the subjects used a neutral criterion on average, i.e., were not biased towards reporting pain or no pain (zero bias at 4 .5, < 4 .5 = bias towards re- porting pain, > 4.5 = bias towards reporting no pain). No proof of trends due to the instructions that heightened or reduced anxiety was found on comparing the two instruction groups, for there were no significant differ- ences in trends for the threshold or SDT parameters (Mann-Whitney U test,
1026 S; LAUTENBACHER, ET AL.
o Sensitisation lhreshold
o 50% threshold
50
_„a u q
-p.. e • 48
Q) 44 E-
42
Block 1 Block 2 Block 3
FIG. 2. Median with interquartile range of the sensitization and 50%-point thresholds in the three experimental blocks (20 stimuli per block); n = 13 each block
p > 5 % ) . The evaluation up to here only covers the mean variations in the
group. To test for intraindividual variations, reliability was determined hy
means of Spearman rank correlations, calculated between the values of the o Discrimination P(A)
o Bias (McNico}) B
1.0
- .9
.s 0.. .8
.7
Block 1 Block 2 Block 3
6.0 5.5
5.0
i:Il
4.5 0
·-z ()
4.0 ()
::s
3.15
• FIG. 3. Me~an with interquartile range of the discrimination ability P(A) (scale on left ab- sctssa). and. McN1col's B bias ~easure (scale on rig~t abscissa) in the three experimental b~ocks (20 sumuli per block); evaluauon for bounded "s1gnal/no-signal" classes (see Data analys1s of Exp. 2); n = 10 in Block 1andn=12 in Blocks 2 and 3 each
SIGNAL DETECTION OF PAIN 1027 individual blocks. This checks whether the rank order of the individual pa·
rameters, which is not affected by common trends over the session, is main- tained at different times. The results are shown in Table 1.
TABLE 1
CoRRELATioNs BETWEEN EXPERIMENTAL BLOCKS FoR TIIRESIIOLD AND SDT PARAMETERS
Parameters Between Between
Blocks 1 and 2 Blocks 2 and J
r n r n
Threshold
Sensitization Threshold .71* 13 .87* 1.3
50%-point Threshold .85* 13 .80* 13
SDT
Discrimination P(A) .88* 10 -.34 11
Bias McNicol's B .49 10 .36 11
~ote.-20 stimuli per block, evaluation for bounded "signal/no-signal" dasses (see Data analy- s1s of Exp. 2).
*Spearman's rank correlation, ps 1%.
The sensitization and 50% thresholds showed fairly strong correlations between the blocks, that is, considerable stability. For the bias parameter B, the correlations between Blocks 1 and 2, and 2 and 3, are also similar, but much weaker and not significant. Only for the discrimination ability param- eter P(A) do the correlations between the blocks vary during the session.
While Blocks 1 and 2 correlate strongly, the relationship between Blocks 2 and 3 is only weak. For the results on P(A) and B the manner in which the classes are formed for "signal„ and "no-signal'' is immaterial (see Data analysis).
The trend and correlation analyses together show a common trend to higher values for the threshold measures, which does not affect the ranking among individuals. The SDT parameters show no common trend over the session. The response bias remains relatively stable intraindividually, too.
After an initial high intraindividual stability, discrimination ability shows individually differing variations when the instruction for expectation is introduced; these do not display a common trend.
Specific instruction ef/ects on threshold and SIYI' parameters.-The disap- pearance of the high, significant correlation between Blocks 1 and 2, after the introduction of the instructions between Blocks 2 and 3 (see above and Table 1), may be considered an unspecific instruction effect on the measure of discrimination ability P(A). This applies to both kinds of instruction taken together. Specific instruction effects could not be eva1uated, since the treatment groups already differed significantly in the threshold parameters before the instructions (n = 7, · instruction increasing anxiety, n = 6, instruc- tion reducing arudety; for difference of both sensitization and 50%
1028 S. LAUTENBACHER, ET AL.
thresholds in Block 2, ps5%, Mann-Whitney U test). Since the SDT pa- rameters depend on the threshold parameters, because the "signal" and
"no-signal„ classes were defined psychophysically, these variables cannot be evaluated for specific instruction effects, either.
DISCUSSION
The main purpose of the present study was to define "signal" and
"no-signal" psychophysically instead of physically, in contrast to previous SDT approaches in pain research. A two-stage procedure was tried, with painful and nonpainful stimulus levels heing determined first (Stage 1), and these classes of stimulus then being used in the SDTexperiment (Stage 2).
Since a procedure with tonic thermal stimulation was needed in Stage 1, but phasic thermal stimuli in the SDT experiment (Stage 2), the relation- ship between the strength of the sensations of phasic and tonic thermal pain stimuli had to be determined in a preliminary experiment (Exp. 1). A qua- dratic relationship, streng enough to permit prediction of the phasic stimulus temperatures for the "signal" and "no-signal" classes in Exp. 2 from the tonic pain threshold measurement, was found.
For Exp. 2, two hypotheses were formulated (see Introduction): (a) Adjusting the boundary (cut-off point) between "signal/pain" and "no- signal/no-pain" to the current pain threshold should keep the SDT parame- ters stable when the absolute strength of pain perception varies. Variations of the sensation level were demonstrated, as was to be expected for repeated pain stimulation over a langer period (6). They appeared as a monotonic trend to higher pain threshold values over the session, representing a long- term adaptation. The group averages for the SDT parameters (discrimina- tion ability and response bias) remained stable with this procedure-as Hypothesis 1 required. Different variations were found in some individual cases-especially for discrimination ability.
(b) The SDT parameters obtained under this procedure should reflect psychological treatments-in this case, induction of anxiety by instruction.
A general effect of the instruction on discrimination ability for the anxiety increasing and decreasing instructions was demonstrated. However, the dis- crimination ability varied independently of the kind of instruction. Nor was the direction of change uniform, but differed from case to case. Specific effects of the two instructions could not be demonstrated; this is due also to the preexisting differences between the instruction groups. The results of this study of the effects of anxiety increasing and decreasing manipulation on SDT parameters agree with the mixed results of previous research, which did not demonstrate unambiguous effects of anxiety manipulations on dis- crimination ability and response bias, either (5, 11, 15, 18).
The results of this attempt to define "signal/pain„ and "no-signal/no- pain" psychophysically, and subject them to an SDT analysis, counter some
SIGNAL DETECTION OF PAIN 1029 arguments against SDT methods in pain research (14). This applies in partic- ular to Rollman's objection that SDT procedures are not able to deal with some relevant aspects of pain experience. The two-stage procedure tried out here provided both measures for the strength of the pain experienced (classi- cal threshold concept) and indicators of the discrimination between pain and no pain. This therefore makes it possible to study absolute and relative char- acteristics of the pain experience together. However, the SDT parameters must be interpreted differently with this approach. The discrimination abil- ity indicates not only how sharply physical variables-in this case tempera- tures-are differentiated sensorily, but also how well psychological states- in this case "pain„ and "no pain"-can be distinguished. Thus the detection task also refers to the primary sensations. And so the response bias not only indicates from what temperature on pain is reported but also to what extent the reflection of the states "pain" and "no pain" in the ratings is distorted.
lt was demonstrated that most of the subjects showed little or no response bias in their ratings. This study also showed that the SDT parameters are independent of the absolute strength of pain perception. This permits vari- ables that influence the absolute and/or relative perception strength to be identified. That there is a need for this is shown by the large number of studies proving complex eff ects of psychological, physical, and biochemical treatments on pain perception (4). An anxiety induction was shown to have an isolated effect on discrimination ability when evaluated in this respect.
But initial differences between the instruction groups prevented a dear-cut interpretation. Since differing effects on the strength of absolute and rela- tive pain perception are to be expected in this case, as well (15), further experiments using the method presented are justified.
The procedure demonstrated also shortens the long series of stimuli otherwise required in SDT procedures, by selection of the critical stimulus values, thus increasing their usefulness. Further improvements are desirable, especially in determining the "signal/pain" and "no-signal/no-pain" classes.
REFERENCES
1. BARLOW, R. E„ BARTIIOLOMEW, D. ]., BREMNER, J. M., & BRUNK, H. D. Statistical in/er·
ence under order restrictions. New York: Wiley, 1972.
2. CnAPMAN, C. R., CASEY, K. L., DUBNER, R., FoLEY, K. M., GRACELY, R. H., & READING,
A. E. Pain measurement: an overview. Pain, 1985, 22, 1·31.
3. CLARK, W. C., KUEI..ANDER, K., BIEBER, R., & GLASSMAN, A. H. Signal detection theory treatment of response set in mood questionnaires. In C. D. Spielberger & I. G. Sarason (Eds.), Stress and anxiety. Vol. 4. New York: Wiley, 1977. Pp. 313-324.
4. CLARK, W. C., & YANG, J. C. Applications of sensory decision theory to problems in Jaboratory and clinical pain. In R. Me1zack (Ed.), Pain measurement and assessment. New York: Raven, 1983. Pp. 15-25.
5. DouGIIER, M. J. Sensory decision theory analysis of the effects of anxiety and experimen- tal instructions on pain. J. abnorm. Psychol., 1979, 88, 137-144.
6. ERNST, M., LEE, M. H. M., DwoRKIN, B., & ZARETSKY, H. H. Pain perception decre- ment produced through repeated stimulation. Pain, 1986, 26, 221-231.
1030 S. LAUTENBACHER, ET AL.
7. FRUIISTORFER, H., LINDBLOM, U., & ScHMIDT, G. Method for quantitative estimation of thermal thresholds in patients. J. Neuro!. Neurosurg. Psychiatry, 1976, 39, 1071-1075.
8. GRACELY, R. H. Pain measurement in man. In L. K. Y. Ng & ]. ]. Bonica (Eds.), Pain, discomfort and bumanitarian care. New York: Elsevier/North-Holland, 1980. Pp. 111- 137.
9. LEHMANN, W. P. Kriteriumsbildung und Reizdiskrimination in der Schmerzwahrnehmung.
Pfaffenweiler: Centaurus Verlagsgesellschaft, 1987.
10. LocKHART, R. S., & MURDOCK, B. B. Memory and the theory of signal detection. Psychol.
Bull., 1970, 74, 100-109.
11. MALow, R. M. The effects of induced anxiety on pain perception: a signal detection anal- ysis. Pain, 1981, 11, 397-405.
12. McN1coL, D. A primer of signal detection theory. Sydney: George Allen & Unwin, 1972.
13. PAGE, E. B. Ordered hypotheses for multiple treatments-a significance test for linear ranks. ]. Amer. Stat. Assn, 1963, 58, 216-230.
14. RoLLMAN, G. B. Signal detection theory measurement of pain: a review and critique.
Pain, 1977, 3, 187-211.
15. ScIIUMACHER, R., & VELDEN, M. Anxiety, pain experience, and pain report: a signal- detection study. Percept. mot. Skills, 1984, 58, 339-349.
16. SEVERIN, F., LEHMANN, W. P., & STRrAN, F. Subjective sensitization to tonic heat as an indicator of thermal pain. Pain, 1985, 21, 369-378.
17. STEVENS, S. S. Psychophysics. New York: Wiley, 1975.
18. UunE, T. W., SmvER., L. J„ PosT, R. M„ }IMERSON, D. C., BoULENGER, J. P., & Bucns-
BAUM, M. S. The relationship of plasma-free MHPG to anxiety and psychophysical pain in normal volunteers. Psychopharmacol. Bull., 1982, 18, 129-132.
19. VELDEN, M., & CLARK, W. C. Reduction of rating scale data by means of signal detection theory. Percep. Psychophys., 1979, 25, 517-518.
20. WILUAMs, E. ]. Regression ana!ysis. New York: Wiley, 1959.
Accepted April 20, 1989.