of Parallel Job Schedulers
Dissertation
zur Erlangung des Grades eines
D o k t o r s d e r N a t u r w i s s e n s c h a f t e n der Technischen Universität Dortmund
an der Fakultät für Informatik von
Stephan Schlagkamp
Dortmund
2017
Gutachter: Prof. Dr.-Ing. Uwe Schwiegelshohn, Prof. Ph.D. Andrei Tchernykh
1. Introduction 11 1.1. User-Aware Performance Evaluation and Optimization of Parallel Job Schedulers 11
1.2. Notation and Definitions . . . . 15
1.3. Data Sources . . . . 16
1.4. Structure and Chapters . . . . 17
2. Advanced Think Time Analysis of the Mira HPC Workload Trace 19 2.1. Workload Trace Characterization . . . . 20
2.1.1. Trace Analysis per Major Science Field . . . . 20
2.2. Characterizing Think Time . . . . 21
2.2.1. Overall Analysis of Think Time . . . . 22
2.2.2. Analysis of Job Characteristics Parameters on Think Time . . . . 23
2.2.3. Analysis of Job Characteristics in Terms of Runtime and Waiting Time . 26 2.2.4. Influence of Job Notifications on Think Time . . . . 28
2.3. Summary and Discussion . . . . 30
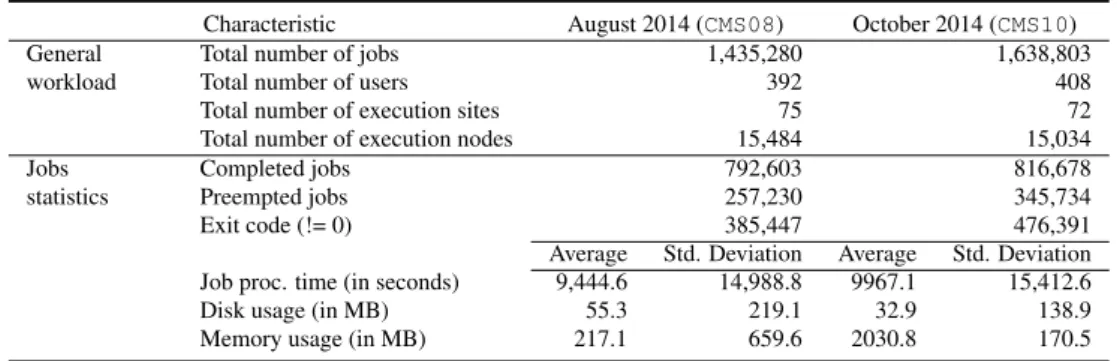
3. Advanced Think Time Analysis of the CMS HTC Workload Trace 33 3.1. Workload Trace Characterization . . . . 33
3.2. User and Job Submission Behavior . . . . 34
3.2.1. Characterizing Think Time . . . . 36
3.2.2. Characterizing Batches of Jobs . . . . 36
3.2.3. Redefining Think Time Behavior Analysis in HTC . . . . 37
3.2.4. Characterizing Batch-Wise Submission Behavior in HTC . . . . 40
3.3. Summary and Discussion . . . . 41
4. A Cognitive Study of Human User Behavior in Parallel Computing 43 4.1. Methodology and QUHCC . . . . 44
4.1.1. Scales Overview . . . . 44
4.1.2. Participants and Computational Resources . . . . 45
4.2. Data Analysis and Discussion . . . . 45
4.2.1. Overview of the Collected Data . . . . 47
4.2.2. Descriptive Analysis of Scales . . . . 48
4.2.3. Correlation Analysis Between Scales . . . . 51
4.2.4. Linear Regression of Waiting Time Satisfaction . . . . 53
4.3. Summary and Discussion . . . . 54
5. Individual Modeling of User Submission Behavior in Parallel Processing 57 5.1. Methodology . . . . 58
5.2. User Model . . . . 59
5.2.1. Model Decisions . . . . 59
5.2.2. Model Classification . . . . 60
5.2.3. Week Model . . . . 61
5.2.4. Day Model . . . . 61
5.2.5. Working Day Classification . . . . 63
5.2.6. Start of Day Distribution . . . . 64
5.2.7. Length of Day Distribution . . . . 66
5.2.8. Job Model . . . . 67
5.2.9. Batch Model . . . . 67
5.2.10. Batch Size . . . . 68
5.2.11. Interarrival Time . . . . 69
5.2.12. Feedback . . . . 70
5.2.13. Session Model . . . . 70
5.3. Evaluation . . . . 71
5.3.1. Simulation Setup . . . . 71
5.3.2. Simulation Results . . . . 72
5.4. Summary and Discussion . . . . 76
6. Optimizing Waiting Time Satisfaction in Parallel Job Schedules - A MILP Approach 79 6.1. Planning Horizon . . . . 79
6.2. MILP for Parallel Job Scheduling on Parallel Machines . . . . 80
6.2.1. Parallel Job Scheduling Complexity . . . . 80
6.2.2. Mixed Integer Linear Programming Formulation . . . . 81
6.3. Evaluation . . . . 82
6.3.1. Optimization Goals . . . . 83
6.3.2. Experimental Scenarios . . . . 83
6.3.3. Experimental Results and Discussion . . . . 84
6.4. Summary and Discussion . . . . 87
7. Conclusion and Future Directions 89
A. User Model Results 95
B. QUHCC 99
1.1. Overview of user-based understanding, modeling, and optimization in parallel
computing under uncertainty . . . . 12
1.2. Supply-and-demand curves crossing in stable state . . . . 13
2.1. Average job arrival times per weekday and per hour . . . . 21
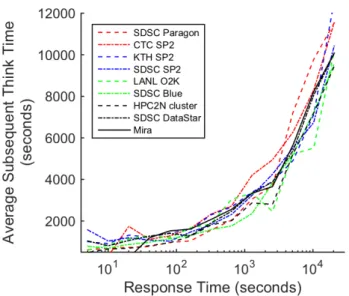
2.2. Average think times in several workload traces . . . . 22
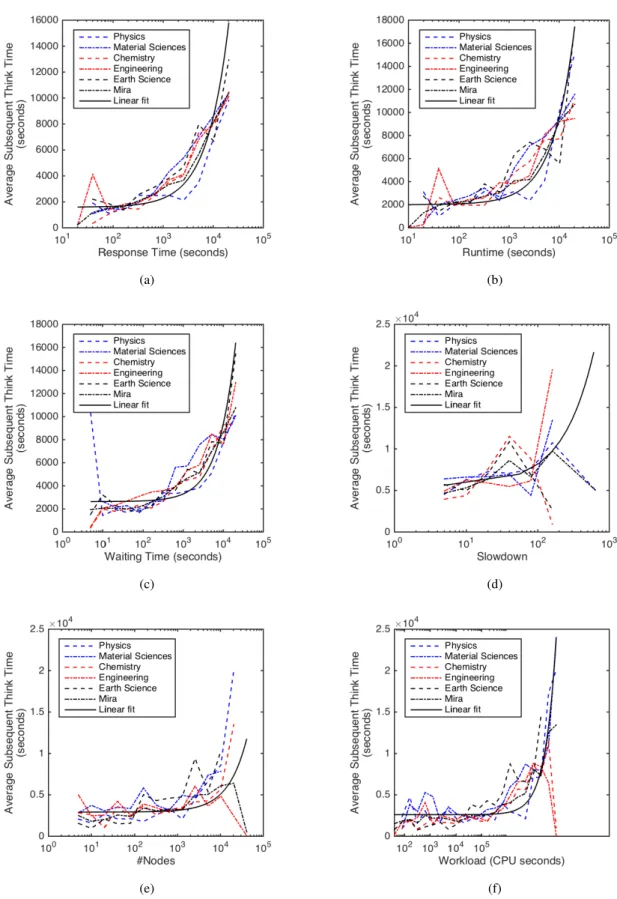
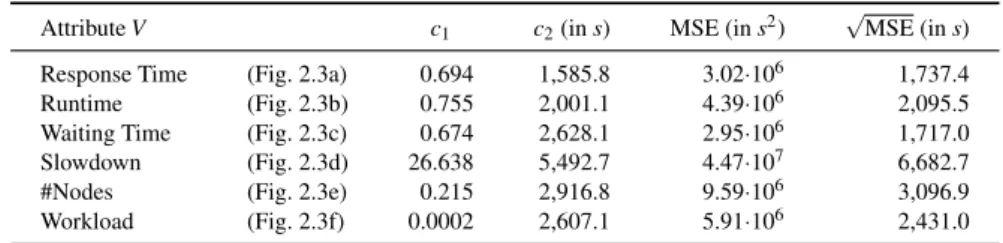
2.3. Average think times as a function of job characteristics . . . . 24
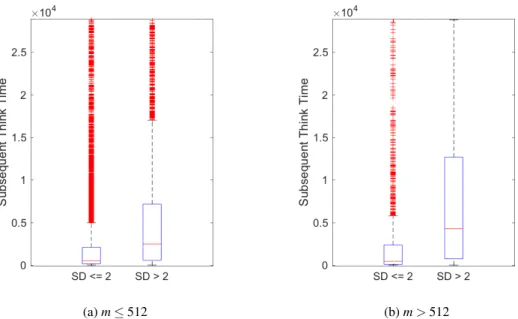
2.4. Influence of prevalent and non-prevalent runtimes in terms of job sizes . . . . 27
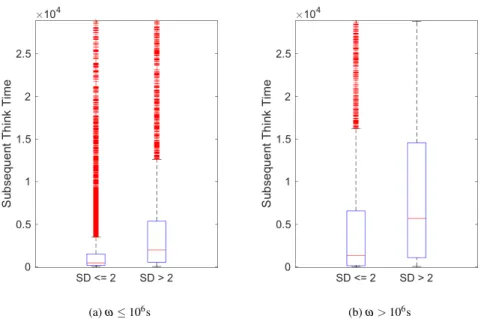
2.5. Influence of prevalent and non-prevalent runtimes in terms of workload . . . . . 28
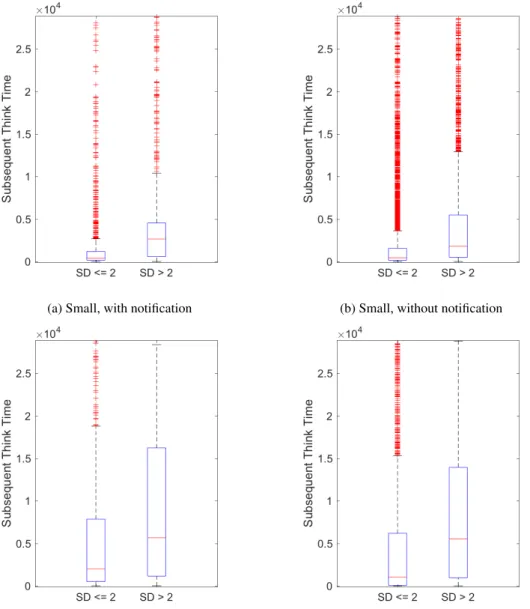
2.6. Average think times for jobs with and without notification upon job completion . 29 2.7. Influence of job completion awareness for different job characteristics . . . . 30
3.1. Statistics of Mira workload trace . . . . 35
3.2. Average think times as a function of response or waiting time . . . . 36
3.3. Impact of different threshold values on estimated batch sizes . . . . 38
3.4. Distribution of interarrival times and think times . . . . 39
3.5. Comparison of different data interpretations for think time computation . . . . . 41
3.6. Impact of different threshold values estimated on batch sizes . . . . 42
4.1. Distribution of scale values . . . . 46
4.2. Distribution of answers provided for the waiting for jobs scale . . . . 48
4.3. Relative frequency of answers in the influence on working times scale . . . . 48
4.4. Relative frequency of answers in the usage of strategies scale . . . . 49
4.5. Relative frequency of answer categories in the job cancellation scale . . . . 50
4.6. Boxplots of user answers to the general job adjustment scale . . . . 50
4.7. Boxplots of user answers to the User-Centered job Adjustment scale . . . . 51
4.8. Spearman’s correlation map between scales . . . . 52
4.9. Regression analysis of acceptable response times . . . . 54
5.1. Framework of components to model individual users . . . . 60
5.2. Possible work and leisure barriers . . . . 63
5.3. Cummulative distributions of cores and deviations in runtimes in batches . . . . . 68
5.4. Overview of components forming a batch . . . . 68
5.5. Session model . . . . 70
5.6. Distributions of sessions requesting the same number of resources . . . . 71
5.7. Simulation setup . . . . 71
5.8. Weekly arrival patterns . . . . 73
5.9. Workload throttling . . . . 74
5.10. Average think times . . . . 75
5.11. Batch size distributions . . . . 75
5.12. Session size distributions . . . . 75
5.13. Job size distributions . . . . 76
5.14. Distributions of deviations in runtimes for each user . . . . 76
6.1. Planning horizons . . . . 80
6.2. Distributions of job queue sizes . . . . 84
6.3. Results of scheduling scenarios (MIRA) . . . . 85
6.4. Results of scheduling scenarios (KTH) . . . . 86
A.1. Weekly arrival patterns . . . . 95
A.2. Workload throttling . . . . 96
A.3. Average subsequent think times . . . . 96
A.4. Batch sizes . . . . 97
A.5. Session sizes . . . . 97
A.6. Job sizes . . . . 98
A.7. Runtime deviations . . . . 98
2.1. Characteristics of the Mira workload . . . . 20
2.2. Number of subsequent jobs with positive think times . . . . 22
2.3. Standard deviations of think times . . . . 25
2.4. Parameters and qualities of linear think time regressions . . . . 25
2.5. Number of outliers with positive think time . . . . 26
3.1. Characteristics of the CMS workload . . . . 34
3.2. Batch statistics . . . . 37
4.1. Statistically significant correlations between scales in QUHCC . . . . 52
4.2. Linear regression function parameters . . . . 54
5.1. Workload traces . . . . 59
5.2. Quality of working day classifications . . . . 65
5.3. MSE for beginning of working times normal and logistic distribution functions . 65 5.4. MSE for lengths of working times normal and logistic distribution functions . . . 66
5.5. Quality of fitting batch sizes with normal, logistic, and exponential distribution . 69 5.6. Job statistics of both simulations . . . . 74
6.1. Workload trace characteristics . . . . 84
A.1. Job and workload statistics . . . . 95
I would like to express my deepest gratitude to my two thesis advisors, Uwe Schwiegelshohn and Gerhard Rinkenauer, for their valuable guidance and consistent encouragement throughout this work.
Furthermore, I thank the Research Training Group 1855 at TU Dortmund University, especially Peter Buchholz, for offering me the opportunity to research at TU Dortmund University. Many thanks go in particular to Lars Eufinger and Johanna Renker for the inspiring collaborations as well as all colleagues at Research Training Group 1855 and Robotics Reseatch Institute. I also would like to thank Ewa Deelman for the opportunity to be a visitor researcher in her group for three months and Rafael Ferreira Da Silva for his advice.
Finally, I would like to acknowledge my family for all their backing and support.
Stephan Schlagkamp
In this chapter, we introduce the topics and approaches of this thesis. We first give an overview of parallel job scheduling and direct the focus towards the users of parallel computing. This leads to the setup of this work: a tripartite approach of understanding and modeling user behavior, as well as optimizing schedules of parallel computing infrastructure regarding user satisfaction. Second, we introduce notations and definitions necessary throughout this work and discuss the data sources which are the basis of analyses presented in this thesis. Lastly, we present the structure and content of the remaining chapters. This introduction combines argumentations, notations, and references from papers discussed in Section 1.4.
1.1. User-Aware Performance Evaluation and Optimization of Parallel Job Schedulers
High Performance Computing (HPC) and High Throughput Computing (HTC) are important en- vironments for performing large-scale scientific computing. A plethora of works focus to enhance the knowledge and application of these computing paradigms to achieve scientific goals. Sev- eral noted international conferences on scientific computing underline this importance, e.g., the The International ACM Symposium on High-Performance Parallel and Distributed Computing (HPDC) 1 or IEEE International Parallel & Distributed Processing Symposium (IPDPS) 2 . Never- theless, resources are not available exclusively to each user and researchers develop sophisticated methods to manage the switching of allocations. For example, the Workshop on Job Scheduling Strategies for Parallel Processing (JSSPP) 3 is dedicated on the development and evaluation of parallel job schedulers. User requests for resources and the programs executed on the infrastruc- ture, the so-called jobs, are queued and a scheduler decides about allocation and starting times of jobs. Depending on the resource requirements and runtimes of jobs, schedulers seek to execute the queued jobs in an optimal way. Since jobs need a certain amount of machines in parallel and an uncertainty about runtimes and future job submissions, parallel job schedulers operate in an online environment. A famous example is the EASY scheduling technique, which allocates jobs in a first-come-first-serve order (FCFS), but advances this by a strategy called backfilling. Back- filling allows jobs to skip the FCFS order, in case the execution of the first job in the queue is not delayed.
There are increasing requirements for scientific applications, which are becoming more com- plex and are thereby increasing the needs for processing and storage capabilities. World-wide recognized scientific experiments utilize large amounts of computational power. A notorious ex- ample is the CMS experiment 4 . The experiment consists of parametric sweep studies and proved
1 www.hpdc.org , accessed 09/19/2016 2 www.ipdps.org, accessed 09/19/2016
3 http://www.cs.huji.ac.il/~feit/parsched/, accessed 09/19/2016
4 http://cms.web.cern.ch, accessed 09/19/2016
the existence of the Higgs-Boson. 5
The importance of the underlying computational paradigms is underlined by several works. For example, Reed and Dongarra discuss requierements of these types of technology and their future application [27]. Geist and Reed give an overview of ongoing research in the field of parallel processing [13]. Therefore, research in the field of scheduling and allocation of parallel jobs remains highly relevant.
When providing resources for applications of both computing paradigms (HPC and HTC), op- erators consider many objectives to ensure availability. They need cost control, which covers investment and operation cost [22]. Additionally, power management is an important objective, e.g., Kaplan et al. provide insights on how to optimize data center energy efficiency [18]. Further- more, depending on the academic and financial conditions, monetary profit can be an important goal in operating computing centers [44].
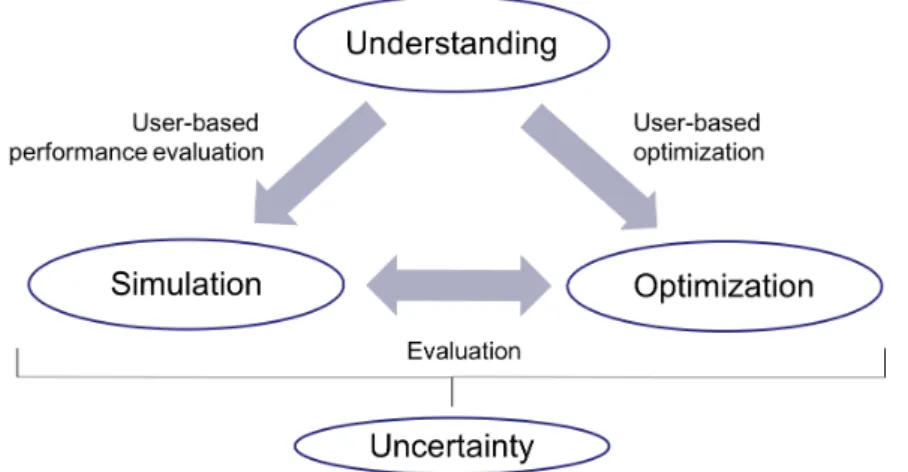
Beside these objectives, research also focuses on users and their satisfaction in parallel process- ing and on optimizing the quality of service (QoS) offered to users. This includes correctness of the computational results, minimizing failure rates of hardware components, increasing of re- sponse times (decreasing waiting and processing times), as well as fairness. This thesis focuses on on the aspect of users in parallel computing and especially on their submission behavior and sat- isfaction. We introduce the motivation and focus of this thesis by means of Figure 1.1. This thesis presents an integral, tripartite view on job scheduling focusing on users, namely understanding, simulation, and optimization, which are all influenced by a certain level of uncertainty:
Figure 1.1.: Overview of user-based understanding, modeling, and optimization in parallel com- puting under uncertainty.
• The modeling of user submission behavior and performance evaluation of newly suggested scheduling techniques in dynamic simulations.
• User-centered optimization of schedules in parallel job processing.
• Understanding of user related aspects, such as their submission behavior and satisfaction.
5 https://twiki.cern.ch/twiki/bin/view/CMSPublic/PhysicsResultsHIG, accessed 09/19/2016
• All of these aspects have to consider uncertainty in various levels.
This setup underlines the granularity of the approach of this thesis. We mostly consider parallel processing on site-level, i.e., we abstract from specific job characteristic, such as memory or soft- ware requirements, but only focus on the number of requested computational resources and the processing time. In the following, we introduce and discuss each of the aspects in detail and show the relations between them to complete this tripartite view of parallel job scheduling.
Simulation So far, a common technique to compare performances of different schedulers is achieved by simulations using previously recorded workload traces. There are many studies on analyzing properties of workloads regarding their usage in performance evaluation. For example, Mishra et al. characterize workloads recorded from Google Cloud infrastructures [24], Zakay and Feitelson discuss resampling of workload [46], or Di et al. predict future workload from previously recorded workload traces [5].
Understanding the component of user behavior in HPC and HTC environments is a highly re- searched field [8]. Simulation and evaluation must consider the effects depicted in Figure 1.2.
Respecting a throttling effect in job submissions is necessary to create meaningful simulation re- sults, which evaluate proposed job scheduling strategies. Feitelson describes the reaction of users to system performances as “a mystery” [8, p. 414]. The workload submitted by users and the system performance should meet in a stable state. A growing demand leads to poorer system per- formance and subsequently to less workload submission. In this interpretation, a workload trace is only a recording of one instantiation of a dynamic process. Therefore, it is not sufficient to replay a trace directly.
resp o nse time
generated load 1
0
stable state user reaction
system performance
Figure 1.2.: Supply-and-demand curves crossing in stable state [8, p. 414].
While there is a a significant number of researches who analyze and suggest improvements to
scheduling techniques in such environments, Schwiegelshohn has raised the need to close the gap
between suggestions and theoretical results and their practical application, e.g., by understanding
user behavior and mapping it to realistic workload models and simulations [38] . He claims that
understanding user behavior will support more convincing evaluations of parallel job schedulers
and therefore increase the potential of practical usability:
"In our view it is one of the key challenges in the area of job scheduling for parallel processing to develop workload models that incorporate a feedback component that changes the workload depending on the result of job scheduling to imitate interaction with the participants."
Therefore, there is a strong need in better understanding feedback effects, which would improve the performance evaluation process as well as the evaluation of new scheduling algorithms.
Optimization So far, research on optimizing user needs in parallel processing is in its early stages. In the literature, supporting users to work in sessions is a well known optimization objec- tive to increase user satisfaction in parallel computing. It is assumed, that users work consecutively and wait for results of previously submitted jobs to continue their work. Shmueli and Feitelson present a scheduling technique called CREASY, which focuses on detecting active users and their sessions, to prioritize their jobs compared to those jobs, which are not seen to be necessary in supporting sessions [39].
In this thesis, we follow a different approach: We extract acceptable waiting times considering job lengths and define optimization objectives on these findings. This is a result from the data obtained in a survey of the Questionnaire of User Habits in Compute Clusters (QUHCC). We will use these findings to implement and evaluate a mixed integer linear program to optimally schedule jobs according to acceptable waiting times.
Understanding The previous introduction shows that users are the central aspect for both, devel- oping realistic simulations and optimizing schedules according to user requirements. This princi- ple can be attained in two different ways: (1) by assessing user behavior through cognitive studies (e.g., in the form of questionnaires), or (2) by analyzing workload traces gathered from productive systems.
Workloads are in the scope of many papers as a source of information on job characteristics.
Several papers have addressed computing workload characterization and modeling. For instance, researchers focus the analyses of grid [16], high-performance [15], and high-throughput com- puting workload characteristics [9] emphasizing system usage, user population, and application characteristics. Considering specific parallel software and programming environments, Ren et al. [28] presented an analysis of a MapReduce trace derived from a production Hadoop cluster, where they analyzed job characteristics such as CPU utilization, memory usage, slots allocation, I/O operations, and network transfers. Rodrigo-Alvarez et al. [30] analyzed 5 years of workload traces from two Supercomputers (Hopper and Carver) at NERSC. This study aimed to collect sys- tem performance metrics (wall clock time, CPU hours, waiting time, etc.) to evaluate the evolution of these systems over their lifetime. A workload characterization of the Magellan cloud computing system at ALCF was conducted in [41]. The cloud system workload is characterized in terms of computing characteristics (e.g., runtime and job input data size) and I/O data movement. Carns et al. [4] characterized the I/O behavior of the Intrepid Supercomputer at ALCF, while Luu et al. [23] analyzed workload traces of the I/O behavior from Intrepid and Mira at ALCF, and Edison at NERSC. Although these papers present a fine-grained analysis of system performance metrics, none of them have focused on user behavior analysis.
Beside these technical aspects of job characteristics, workload traces can reveal several aspects
of user behavior related to system performance metrics and job characteristics. Feitelson [6] an-
alyzes user behavior from high-performance computing workload traces in which several aspects
of dynamic correlations between system performance, utilization, and subsequent user behavior are observed. As a result, these analyses have enabled the development of models emphasizing specific aspects of user behavior. For example, Lee and Snavely [20] analyze the accuracy of job runtime estimates provided by users, while Tsafrir et al. [43] derive a model for this specific information.
Ferreira da Silva and Glatard [10] present an analysis of a science-gateway workload, which shows that the estimation method to detect job batches underestimates job interarrival and CPU times, and overestimates job runtimes. Different workload models and simulations mimic the dynamic nature of user and system interaction.
Uncertainty Besides sources of uncertainty already mentioned previously, in general we have to deal with various further forms of uncertainty in parallel computing. Tchernykh et al. [42] present an overview of uncertainties and their sources in cloud computing. It covers several topics, which are not in the scope of this thesis, e.g., migration of jobs or fault tolerance, since we are interested in parallel processing on site-level. We only deal with runtime and job submission uncertainty in the corresponding chapters.
The online character of parallel job scheduling is due to submission uncertainty, because we do cannot certainly predict when a user submits a certain job. Furthermore, the runtime of jobs is difficult to predict and user runtime estimates are not necessarily close to the actual runtime.
Focusing on user provided information regarding job runtimes, Lee and Snavely analyze the dif- ferences between runtime estimates and actual runtimes [20], and Tsafrir et al. present a model to calculate the difference between runtimes and runtime estimates [43]. Approaches to predict job characteristics exist, which do not focus on users and the information they provide, but on more general trace analysis. For example, Feirrera da Silva presents prediction schemes of job charac- teristics in two papers [11, 12]. These approaches would add further complexity and uncertainty to the problems addressed in this thesis. Therefore, we will be using more general approaches to add uncertainty to job runtimes in the according chapters.
1.2. Notation and Definitions
We introduce the level of abstraction and basic notation relevant throughout this work. This no- tation is commonly used in (parallel) job scheduling research [25]. Further notations may be introduced afterwards and will be chapter-specific.
Considering a computational job j, let s j be the time when j is submitted by a user u, p j the job processing time (which is also referred to as runtime throughout this thesis), and w j the waiting time (the time it spends in queue). We define the job response time r j as the sum of the timespan of its waiting and processing time:
r j = w j + p j . (1.1)
Thus, we define the job completion time c j as the sum of the job submission time and the response time:
c j = s j + r j . (1.2)
The job interarrival time i j is the time interval between two subsequent job submissions ( j and j 0 := j + 1) submitted by the same user:
i j, j
0= s 0 j − s j . (1.3)
Two subsequent jobs are considered overlapped if job j has not finished before job j 0 is submitted, i.e., c j ≥ s j
0. Otherwise, they are considered non-overlapped. In many contexts in this thesis, we are particularly interested in subsequent jobs that do not overlap. Therefore, we define think time TT as the timespan between the completion time c j of job j and the submission time of its successor j 0 := j + 1:
TT j, j
0= s j
0− c j . (1.4)
This is the same definition as presented by Feitelson [6]. For overlapping jobs, the think time is negative. Consequently, in think time analyses we only consider those subsequent job submissions of positive think time. Additionally, we mostly consider think times of less than eight hours. For comparison purposes, this threshold is defined based on the study conducted by Feitelson [6], and it is intended to represent subsequent job submissions belonging to the same working day. This threshold also eliminates user behaviors characterized by absent submissions for long periods of time followed by burst submissions for short periods (e.g., conference deadlines, allocation expiration, etc.). Zakay and Feitelson propose a similar definition of submission behavior [45].
Overlapping jobs can also form a batch (with some constraints according to the exact model), and batches can be added up into a session. The slowdown sd of a job j is defined as the factor between a job’s actual response time and its runtime:
sd j = r j
p j = w j + p j
p j . (1.5)
We define job size m j as the number of requested resources, depending on the computational environment either processors or nodes, while the job workload ω represents the total CPU time of the job:
ω j = p j · m j , (1.6)
where p j is the processing time of a job j, and m its requested number of resources. In this thesis, we only consider rigid jobs, which means the number of required resources m j is fixed and cannot be adjusted at runtime.
1.3. Data Sources
In parallel job scheduling research, workload traces are a main source of information on productive parallel computing systems. All relevant aspects of jobs processed on such infrastructure are logged and represent the full information on timings (job submissions, waiting times, etc.), as well as job characteristics (requested processing times, allocated number of resources, etc.), beside further information on job requirements such as disk space or memory.
A standardized format to simplify the usage of workload traces was introduced by Feitelson 6 . This format is named Standard Workload Format (SWF). All scripts developed for this thesis regarding trace analysis require data presented in the SWF format. Several workload traces are publicly available, e.g., through the Parallel Workload Archive [2] or the The Grid Workloads Archive [1]. In this thesis, we use traces from the Parallel Workload Archive, as well as traces from the Mira Supercomputer (HPC) at Argonne National Lab 7 and the CMS experiments 8 (HTC). We will describe in each chapter, which workload traces we use to perform the respective analyses.
6 http://www.cs.huji.ac.il/labs/parallel/workload/swf.html, accessed 09/07/2016
7 https://www.anl.gov, accessed 09/19/2016
8 http://cms.web.cern.ch, accessed 09/19/2016
Furthermore, we analyze data collected in a survey among users of parallel computing infras- tructures at TU Dortmund University. We only consider aggregated and anonymized data, to not violate user privacy.
1.4. Structure and Chapters
Most of the contents of this thesis have been previously published in conference or workshop proceedings. We give an overview of the following chapters, as well as the respective references to the published sources. This work is structured as follows:
Chapter 2 In this chapter, we extend the understanding of subsequent job submission behavior in HPC. It includes a detailed analysis of correlations among several job characteristics, e.g., waiting time or job size. Furthermore, we present an in-depth analysis by combining job characteristics, such as slowdown or job complexity, which reveals that job complexity correlates to subsequent job submission behavior. We also demonstrate that notifications of users on job completion do not influence their average subsequent behavior. These analyses and results are published as:
S CHLAGKAMP , S., F ERREIRA DA S ILVA , R., A LLCOCK , W., D EELMAN , E., AND S CHWIE -
GELSHOHN , U. Consecutive job submission behavior at mira supercomputer. In ACM In- ternational Symposium on High-Performance Parallel and Distributed Computing (HPDC) (2016).
Chapter 3 In this chapter, we use the aforementioned methods to extend the understanding of HTC workloads. We compare methods to cluster jobs according to their belonging to bag of tasks from raw job data without bag of task information. This analysis has been published as:
S CHLAGKAMP , S., F ERREIRA DA S ILVA , R., D EELMAN , E., AND S CHWIEGELSHOHN , U. Understanding user behavior: from HPC to HTC. In International Conference on Com- putational Science (ICCS) (2016).
Chapter 4 This chapter extends the understanding of user related aspects in parallel job schedul- ing. We created the Questionnaire for User Habits of Computer Clusters (QUHCC) to access user job submission behavior, as well as their satisfaction and expectations towards waiting times in parallel job processing. We analyze the data obtained in a survey among 23 users of compute clus- ters at TU Dortmund University in terms of descriptive statistical analysis, as well as correlation and regression analyses. The questionnaire was mainly co-developed with Johanna Renker. The description of the questionnaire, the data obtained in the survey and the analysis results have been published as:
S CHLAGKAMP , S., DA S ILVA , R. F., R ENKER , J., AND R INKENAUER , G. Analyzing users in parallel computing: A user-oriented study. In 14th International Conference on High Performance Computing & Simulation (HPCS) (2016).
The regression analysis of user waiting time satisfaction is part of the following publication:
S CHLAGKAMP , S., H OFMANN , M., E UFINGER , L., AND DA S ILVA , R. F. Increasing
waiting time satisfaction in parallel job scheduling via a flexible MILP approach. In 14th
International Conference on High Performance Computing & Simulation (HPCS) (2016).
Chapter 5 In this chapter, we propose a framework to simulate dynamic user behavior. The model combines several aspects and interpretations of user behavior deriving from current re- search. We present components, advancing the user model previously published in
S CHLAGKAMP , S. Influence of dynamic think times on parallel job scheduler performances in generative simulations. In JSSPP 2015 - 19th Workshop on Job Scheduling Strategies for Parallel Processing (JSSPP 2015) (Hyderabad, India, May 2015).
This publication investigates the influence of dynamic think time on parallel job scheduler per- formance evaluation by comparing the performance of job schedulers when facing static and dy- namic, feedback-aware job submissions. The proposed framework incorporates assumptions on users’ working behaviors, e.g., job submissions as batches, and extract statistical distributions from workload traces to sample individual user behavior during simulations.
Chapter 6 Lastly, we combine the aspects investigated in the previous chapters. Therefore, we focus on optimizing user satisfaction in parallel computing. First, we evaluate the practical ap- plicability of a novel mixed integer linear programming (MILP) formulation for the parallel job scheduling problem. The objective focuses to minimize the waiting time according to a certain allowed slowdown related to the job lengths. Due to the computational intensity and long run- times of this optimization approach, we only evaluate it by means of static scenarios, ignoring uncertainties in runtimes and dynamic load generations. We choose a different MILP formulation than Streit, who showed that his version is not necessarily useful in practical application [40]. This appraoch was published in
S CHLAGKAMP , S., H OFMANN , M., E UFINGER , L., AND DA S ILVA , R. F. Increasing waiting time satisfaction in parallel job scheduling via a flexible MILP approach. In 14th International Conference on High Performance Computing & Simulation (HPCS) (2016).
Chapter 7 The last chapter concludes this thesis and points out the contributions of this work
and links the results of the previous chapters. Additionally, this chapter discusses future research
directions. For example, this includes the future interpretation of workload traces and extracting
additional user information, which the survey in Chapter 4 revealed, but which are still hidden in
workload traces.
HPC Workload Trace
This chapter aims to advance the understanding of feedback effects in terms of correlations among job characteristics recorded in workload traces. First, we perform an in-depth analysis of think time. Therefore, we analyze combined job characteristics and the influence on subsequent user behavior in the Mira trace. We evaluate how system performance and job characteristics influence users’ subsequent job submission behavior in HPC systems. In particular, we extend and evaluate the definition of think time (the time interval between a job completion and the submission of the next job), to assess the influence of system delays (e.g., queueing time), and job complexity (number of nodes and CPU time) on user behavior. Therefore, we analyze a workload trace from the Mira supercomputer at Argonne Leadership Computing Facility (ALCF) covering job submis- sions in the year 2014. We first characterize the subsequent think time as a function of job response time. Then, we perform further analyses on each of the constituting components of response time (i.e., queueing and processing time).
We also analyze think time in response to the slowdown and the job complexity. Our find- ings show that these components are strongly correlated and have a significant influence on user behavior. Thus, we conduct a comprehensive analysis of the subsequent think time in response to multiple dimensions. Last, we analyze how job notification mechanisms may impact user be- havior. Although a user might be unaware of a job completion, this time of unawareness is also accounted as think time. The main contributions of this chapter include:
1. The characterization of a supercomputer scheduling workload and its major science fields;
2. An evaluation of think time, for measuring delays in users’ subsequent job submission be- havior in HPC systems;
3. An in-depth analysis of correlations between subsequent think times, job characteristics and system performance metrics;
4. An evaluation of modeling users’ think time behavior as linear functions according to di- verse job characteristics
5. A comprehensive analysis of the influence of multidimensional metrics on user behavior;
6. An evaluation of the correlation between job completion awareness and think times.
The chapter is organized as follows. Section 2.1 presents the characterization of the Mira workload
trace. An in-depth analysis of think times is presented in Section 2.2. This section covers an overall
analysis of think time (Section 2.2.1), as well as the analysis of different job characteristics and
their possible influence on user behavior (Sections 2.2.2 to 2.2.4).
2.1. Workload Trace Characterization
The analyses presented in this chapter are based on the workload from Mira, the IBM Blue Gene/Q system at the Argonne Leadership Computing Facility (ALCF). Mira is a 786,432-core production system with 768 TiB of RAM, and a peak performance of 10 PFlops. Each node is composed of 16 cores, and the minimum amount of nodes allocated to a job is 512 (i.e., 8,192 cores). Nodes are organized into rows of 16,384 nodes. Typically, users submit jobs to the prod and prod-1024-torus queue, which are routed automatically into the queue matching the node-count and wall clock time parameters requested 1 . Projects have individual allocation balances restricting the number of CPU hours available to the projects per year. Nevertheless, a backfill queue is available to projects that have already used their allocation balance. This queue allows these projects to advance their work, while supporting resource utilization when no jobs from projects with positive allocation balance are able to be scheduled.
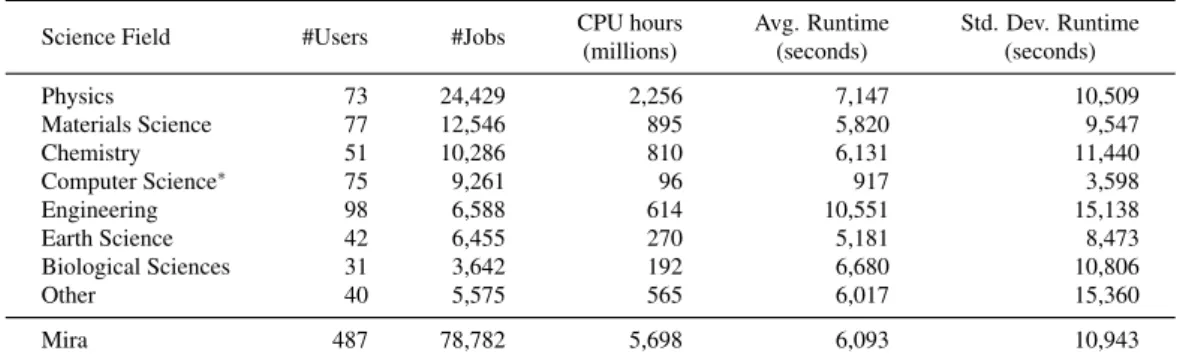
Mira’s workload dataset comprises computational jobs execution from the entire year of 2014, which consists of 78,782 jobs, submitted by 487 users from 13 science domains. In total these jobs consumed over 5.6 billion CPU hours. Table 2.1 shows the summary of the main characteristics of the dataset and highlights the most important (by the number of jobs) science domain fields. Due to a special agreement, most of Computer Science jobs ( ∼ 65%) consume less than the minimum allocation (i.e., 512 nodes or 8,192 cores). Additionally, these jobs have very short processing times (less than 15 min), thus we see the low CPU hours consumption regardless the high number of jobs. Furthermore, about 25% of the jobs run in the backfill queue, which may bias user behavior—the uncertainty of the job start time is elevated. Therefore, Computer Science jobs are not considered in this study.
Science Field #Users #Jobs CPU hours Avg. Runtime Std. Dev. Runtime
(millions) (seconds) (seconds)
Physics 73 24,429 2,256 7,147 10,509
Materials Science 77 12,546 895 5,820 9,547
Chemistry 51 10,286 810 6,131 11,440
Computer Science
∗75 9,261 96 917 3,598
Engineering 98 6,588 614 10,551 15,138
Earth Science 42 6,455 270 5,181 8,473
Biological Sciences 31 3,642 192 6,680 10,806
Other 40 5,575 565 6,017 15,360
Mira 487 78,782 5,698 6,093 10,943
∗