SFB 823
Time lags in the pass-through of crude-oil prices: Big data
evidence from the German gasoline market
Discussion Paper Manuel Frondel, Colin Vance,
Alex Kihm
Nr. 24/2015
Time Lags in the Pass-Through of Crude-Oil Prices: Big Data Evidence from the German Gasoline Market
Manuel Frondel, Rheinisch-Westfälisches Institut für Wirtschaftsforschung and Ruhr University Bochum
Colin Vance, Rheinisch-Westfälisches Institut für Wirtschaftsforschung and Jacobs Uni- versity Bremen
Alex Kihm, Rheinisch-Westfälisches Institut für Wirtschaftsforschung and Fairr.de Abstract. This note investigates the pass-through of global Brent oil notations to fuel prices across the oligopoly of retail majors in Germany. We assemble a high-frequency panel data set that encompasses millions of price observations and allows us to dis- tinguish effects by brand. Upon establishing a cointegrating relationship between fuel and crude-oil prices using daily data, we estimate an error-correction model (ECM) and find that (1) the pass-through of oil prices critically depends on the number of ti- me lags included in the ECM, (2) strict adherence to classical information criteria for determining lag length yields extremely long pass-through durations, and (3) the esti- mated impulse response functions are virtually identical across brands, irrespective of the lag count, suggesting a high degree of competition among brands.
JEL classification: D12, Q41.
Key words: Retail Markets, competition, error-correction model.
Correspondence: Manuel Frondel, Rheinisch-Westfälisches Institut für Wirtschaftsfor- schung (RWI), Hohenzollernstr. 1-3, D-45128 Essen. frondel@rwi-essen.de.
Acknowledgements: We are grateful for invaluable comments and suggestions by
Christoph M. Schmidt and Reinhard Madlener. This work has been supported by the
NRW Ministry of Innovation, Science, and Research (BMBF) within the framework of
the project “Rebound effects in NRW” and by the Collaborative Research Center “Sta-
tistical Modeling of Nonlinear Dynamic Processes” (SFB 823) of the German Research
Foundation (DFG), within the framework of Project A3, “Dynamic Technology Mode-
ling”.
1 Introduction
Drawing upon a huge panel data set originating from a recently established census of retail prices covering virtually all fuel stations in Germany, this note investigates the pass-through of global Brent oil notations to gasoline prices, thereby distinguishing between retail majors, minors, and independents. Gasoline markets are well-known to exhibit retail price evolutions that resemble the Edgeworth price cycle equilibria formalized by M ASKIN and T IROLE (1988), which can have implications for the speed of gas price responses (L EWIS , N OEL , 2011). Such cycles have been found for the US (L EWIS , 2009; D OYLE , M UEHLEGGER , S AMPAHANTHARAK , 2010), Canada (E CKERT , 2003; N OEL 2007a,b), and Australia (W ANG 2008), with a typical cycle lasting one to two weeks (L EWIS , N OEL , 2011:672).
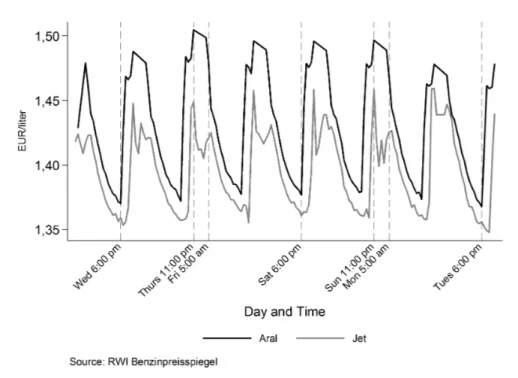
Fluctuations in German fuel prices are likewise characteristic of an Edgeworth Cycle, but one that takes place over a 24 hours period, rather than weeks. Figure 1 presents this pattern for E5 gasoline and the retailers Aral and Jet, but is also represen- tative for the other fuel types and retailers. The fuel price reaches a trough each day at about 6:00 p. m. , after which it rises rather sharply until 11:00 p. m. , stagnating until 5:00 a. m. , and thereafter falling gradually over the course of the day until 6:00 p. m. When averaging the prices on a daily basis, however, the evidence for a cyclical Edgeworth pattern vanishes.
Moreover, using an error-correction based cointegration test for panel data (W ES -
TERLUND , 2007; P ERSYN , W ESTERLUND , 2008), a cointegrating relationship between
fuel and Brent prices is not rejected with the daily data, contrasting with a rejection
of cointegration using the hourly data. In what follows, we use this result to apply the
standard error-correction model (ECM) of E NGLE and G RANGER (1987) to the daily da-
ta to investigate both the critical role of the lag order in the pass-through of crude-oil
prices and the degree of competition among major brands. To compare the price pass-
through speed of different brands, impulse response functions (IRFs) are subsequently
estimated.
Figure 1: Intra-Day Price Cycles for E5 Gasoline in Germany.
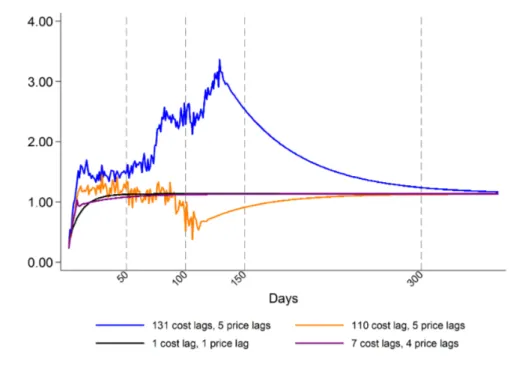
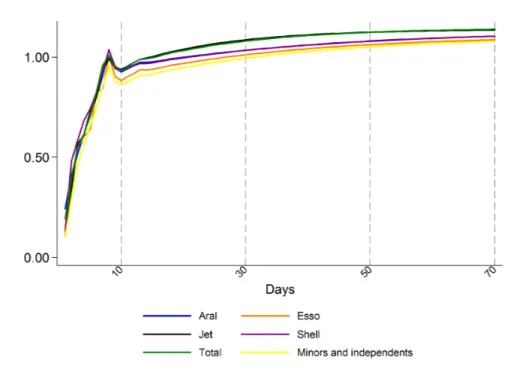
Three main results emerge. First, we find that the estimated pass-through of oil prices critically depends on the number of time lags included in the ECM. Second, strict adherence to classical model selection criteria, such as A KAIKE ’s (1973) and S CHWARZ ’ (1978) information criteria, yields an extremely long pass-through period, leading us to advocate discretionary limits on the number of lags included. Lastly, irrespective of the number of lags included in the model, the differences in the associated IRFs across brands is negligible, which is interpreted as evidence for a competitive retail market.
The following section describes the panel data set. Section 3 provides a descripti-
on of the estimation method, followed by a derivation of the formula for the impulse
response function (IRF). The presentation and interpretation of the results is given in
Section 4. The last section summarizes and concludes.
2 Data
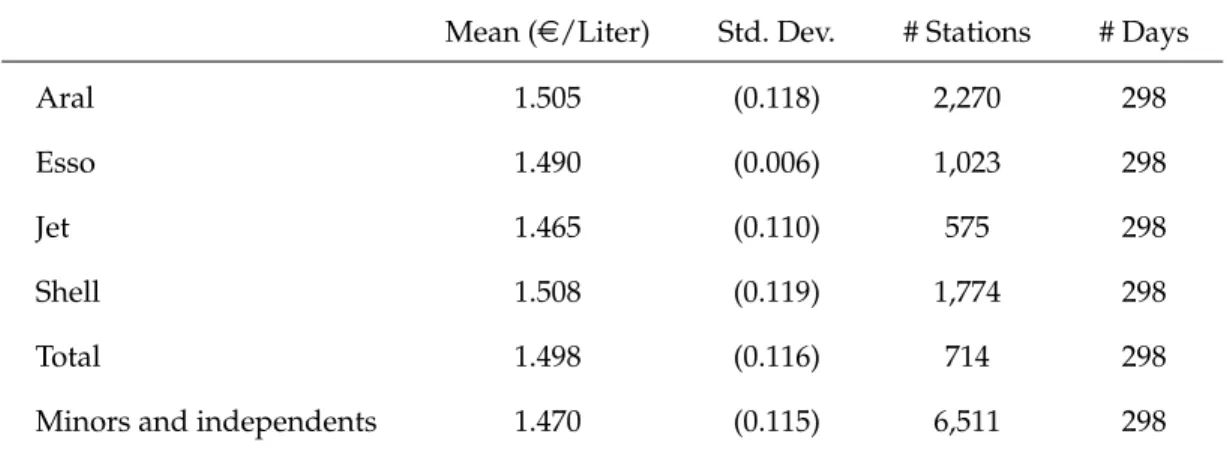
The German retail market for gasoline and other fuels is dominated by an oligopoly of five vertically integrated oil companies that have a large network of stations and direct access to refining capacities: Aral, Shell, JET, Esso and Total (Table 1). These players have long been a source of scrutiny by Germany’s Cartel Office (B UNDESKARTELLAMT , 2011:20-21). Increasing concern about collusion culminated in the establishment of the so-called Market Transparency Unit for Fuel and an on-line portal that posts fuel prices in real-time from each of Germany’s roughly 14,000 filling stations.
1Since September 2013, stations are legally obligated to post every price change, the precise time stamp, the geographic coordinates of the station, the opening hours, and the brand. To access this data, we wrote a script that continuously retrieves entries on the site and stores these on a server. From the raw data, we create a balanced panel of daily prices for E5 and E10 gasoline, as well as diesel, charged by each station covering the period from May 17, 2014, to March 14, 2015, and resulting in millions of price observations altogether.
Table 1: Mean Gasoline Prices (E5) Across Retailers in Germany (May 17, 2014 - March 10, 2015)
Mean (e/Liter) Std. Dev. # Stations # Days
Aral 1.505 (0.118) 2,270 298
Esso 1.490 (0.006) 1,023 298
Jet 1.465 (0.110) 575 298
Shell 1.508 (0.119) 1,774 298
Total 1.498 (0.116) 714 298
Minors and independents 1.470 (0.115) 6,511 298
Note: Average Brent Oil prices amounted to 0.42e/liter over the same time interval.
1
For more information on the Market Transparency Unit for Fuel (Markttransparenzstelle für Kraftstoffe, MTS-K), see http://www.bundeskartellamt.de/EN/Economicsectors/MineralOil/
MTU-Fuels/mtufuels_node.html .
For this period and the example of E5 gasoline, mean prices across brands are presented in Table 1. The highest average price, at 1.508 eper liter, is to be observed for Shell, whereas Jet exhibits the lowest average price of 1.46 e/liter. Prices are in nominal terms and include a 65 cents excise tax, as well as a 19% value-added tax. Following standard practice, we estimate the ECM on the before-tax gas prices, using daily data on Brent oil prices published by the U.S. Energy Information Administration (EIA).
3 Methodological Issues
To model the transmission of crude-oil prices, PC, to gasoline prices, PG, we follow B ACHMEIER and G RIFFIN (2003). These authors abstract from determinants other than crude-oil prices, arguing that crude oil is the principal input to gasoline production and that the purpose of their model is simply to examine the transmission of crude-price shocks to gasoline prices. Furthermore, we exploit the fact that average daily gasoline prices do not exhibit Edgeworth cycles, thereby allowing us to employ a standard ECM (B ACHMEIER , G RIFFIN , 2003:773):
2∆PG
t=
∑
k i=
0β
ci∆PC
t−
i+
∑
n i=
1β
gi∆PG
t−
i+ θz
t−
1+ ε
t, (1) where β
ciand β
gimeasure the short-run impact of crude oil prices and lagged gasoline prices, respectively, θ is the long-run equilibrium parameter and
z
t= PG
t− γ
0− γ
1PC
t(2)
measures the long-run disequilibrium between gasoline and crude-oil prices. γ
1re- flects the long-run effect of a permanent change in crude-oil prices. As we have empi- rically found that the PC and PG time series are cointegrated, the long-run relationship follows a stationary process, as well as the other regressors in (1), which are found to
2
Using a Markov switching regression framework, L
EWISand N
OEL(2011:672) argue that in markets
that exhibit price cycles, distributed lag models, such as the ECM, are unable to capture the large and
periodic changes in retail margins.
be integrated of order one. Hence, inference on functions of the coefficients, such as the impulse response function (IRF), is standard.
The impulse response – or cumulated adjustment – function, recursively defined by IRF
t: = PG
t− PG
t−
1+ IRF
t−
1= ∆PG
t+ IRF
t−
1, measures the t-period cumulative response in gasoline prices to a one-time, but permanent unit change in the price of crude oil at t = 0: PC
t= 1 for t = 0, 1, 2, .... Our derivation of the IRF leads to a formula very similar to that presented by B ORENSTEIN , C AMERON , and G ILBERT (1997). For starters, for t = 0, we obtain
IRF
0= PG
0− PG −
1+ IRF −
1= β b
c0( PC
0− PG −
1) + β b
g1( PG −
1− PG −
2) + θz ˆ −
1= b β
c0, because IRF −
1= 0 = PC −
1= PG −
1= PG −
2, z −
1= 0, as the one-unit shock occurs in t = 0. For t = 1 and k, n ≥ 1, it is
IRF
1= PG
1− PG
0+ IRF
0= β b
c0∆PC
1+ β b
c1∆PC
0+ β b
g1∆PG
0+ θz ˆ
0+ IRF
0= β b
c1+ β b
g1IRF
0+ θ ˆ ( IRF
0− γ
1) + IRF
0,
because ∆PC
0= PC
0− PC −
1= 1 − 0 = 1 and ∆PC
1= PC
1− PC
0= 1 − 1 = 0, as the unit change in t = 0 is permanent, and ∆PG
0= IRF
0. Furthermore, z
0results from z
0= z
0− z −
1= ∆PG
0− γ
1∆PC
0= IRF
0− γ
1, as ∆PC
0= 1 and ∆PG
0= IRF
0.
Likewise, for t = 2 and k, n ≥ 2, because of ∆PC
2= ∆PC
1= 0 and ∆PC
0= 1, we get
IRF
2= PG
2− PG
1+ IRF
1= β b
c0∆PC
2+ β b
c1∆PC
1+ b β
c2∆PC
0+ β b
g1∆PG
1+ b β
g2∆PG
0+ θz ˆ
1+ IRF
1= β b
c2+ β b
g1( IRF
1− IRF
0) + β b
g2IRF
0+ θ ˆ ( IRF
1− γ
1) + IRF
1,
since, by definition, ∆PG
1= IRF
1− IRF
0and ∆PG
0= IRF
0. In addition, z
1− z
0=
∆PG
1− γ
1∆PC
1= IRF
1− IRF
0and, hence, z
1= z
0+ IRF
1− IRF
0= IRF
0− γ
1+ IRF
1− IRF
0= IRF
1− γ
1. Note that the formula for z
1can be generalized by recursive induction to z
t= IRF
t− γ
1for all t ≥ 0.
In sum, as has been motivated by calculating IRF
tfor t = 0, 1, 2, the general
formula for t = j reads:
IRF
j= β b
cj+
∑
j i=
1β b
gi( IRF
j−
i− IRF
j−
i−
1) + θ ˆ ( IRF
j− γ
1) + IRF
j−
i. (3)
It bears noting that β b
cj= 0 if j > k and
j i
∑ =
1β b
gi( IRF
j−
i− IRF
j−
i−
1) = ∑
ni