of Britain’s visible minorities
Roger Ballard 1 Do handicaps always cause failure?
As the previous Chapter very clearly demonstrates, members of all of Britain’s visible minorities still routinely find themselves exposed to various forms of racial exclusionism; and since such exclusion most frequently occurs – and also bites most deeply – in situations where they are competing with members of the indigenous majority for access to scarce to scarce resources of one kind or another, they are inevitably disadvantaged as a result. However it is one thing to observe that a members of a certain social category have been treated in a disadvantageous fashion by having a wholly unjustified handicap imposed upon them, and quite another to conclude that they will therefore, of necessity, finish last in every race. On the contrary there is always a very real possibility that despite being subjected to such a disadvantage, the handicapped will develop all manner of skills and strategies with which to resist and circumvent its consequences, so much so that they may ultimately perform as well as, and sometimes even more successfully than, their myopically self-interested excluders.
It is also worth remembering that such achievements cannot be taken as evidence that the handicapping process itself does not exist. Far from it. Instead they are much better understood as an indication of the extent to which the otherwise-handicapped have looked to their own internal resources – if only by working twice as hard as everyone else – so much so that they have been able to catch up with, and not infrequently to overtake, those who have sought to sustain their position of privilege by imposing a quite unjustified handicap on their ‘upstart’ rivals. Moreover those who do find themselves overtaken in this way often feel completely non-plussed, and most especially so when they have grounded their exclusionistic practices in assumptions about the innate inferiority of their rivals – as routinely occurs with respect to majority attitudes towards the visible minorities.
Hence if members of excluded minorities do – despite everything – manage to succeed, this is best read not so much as an indication of the absence of exclusionism, but rather as an indication of just how threadbare the excluders’ strategies have become, and just how comprehensively they have misread – and indeed both overlooked and devalued – the alternative energies, competencies and resources on which those they have sought to exclude have been able to draw.
This Chapter is written against a background of these concerns. It seeks to explore firstly the extent of upward socio-economic mobility that members of Britain’s visible minorities have managed to
mobility have varied as between different sub-sections of the visible minority population; and thirdly to provide at least an outline of how both these achievements, and these inter-community variation, might best be explained.
2 The initial socio-economic position of Britain’s visible minorities
Having just entered the new millennium, it is instructive to reflect on just how much upward mobility the visible minorities have managed to achieve during the half-century which has passed since they first started to establish themselves in Britain in significant numbers. At the outset times were hard, but nevertheless the socio-economic position in which the newcomers found themselves is relatively easy to specify in analytical terms.
As the post-war economic boom took off Britain found itself acutely short of labour, and despite regular economic upswings and downswings the labour market – and most especially the market for more-or-less unskilled labour – remained extremely tight for the best part of the next two decades.
By now, however, Britain’s traditional reservoirs of reserve labour power, Ireland and Eastern Europe, were either exhausted or inaccessible; hence labour migrants began to drawn from Britain’s more distant Imperial possessions in ever-increasing numbers, despite the introduction of a whole series of Commonwealth Immigration Acts which were deliberately aimed at excluding them.
Whilst only a small minority of these non-European had either professional qualifications or immediately marketable skills, those that did soon find that these potentialities were routinely overlooked. Their skin colour was used to define their competence – or rather their assumed lack of it. Hence whether qualified or unqualified, educated or uneducated (and the vast majority of migrants fell into the latter categories) they all found themselves consigned to a similar position in the local labour market can very easily be defined. Whether they took menial jobs in hospitals, catering or transport across the length and breadth of Britain, worked the night shifts in textile mills in Yorkshire and Lancashire, made bricks in Bedfordshire, or took the dirtiest, heaviest and most dangerous jobs in steel mills, foundries or rubber factories, the pattern was always the same:
members of this new and very visible minority population soon found that the jobs towards which they were invariably directed, as well as those to which they had any prospect of easy access were those which indigenous workers sought at all costs to avoid. As such they rapidly came to form what can best be described as a racially marginalised and socially subordinated sub-proletariat.
3 Subsequent developments
Much has changed since then, however. Since the late nineteen seventies Britain’s labour market has undergone all sorts of transformations. First of all the mean level of unemployment soared to unprecedented levels, with the result that the opportunities right at the bottom of the pile on which the newcomers had so long relied simply evaporated; secondly many of the very industries in which they had for so long been employed – such as textile manufacture, steel-making, and heavy engineering – disappeared with equal speed; and thirdly whilst the centre of gravity of the post-war labour market lay in manufacturing industry, it now lies very firmly in the service sector. Given that all these changes have had a particularly drastic impact on just those sectors of the labour market into which post-war labour migrants were initially directed, they were not only disproportionately disadvantaged – at least by comparison with the indigenous majority – by these developments, but have also had to make by far the largest adjustments to survive them.
At the same time the whole character of the visible minority population has changed dramatically.
Although patterns vary as between its different communities, in most cases only a rapidly diminishing minority can now properly be identified as immigrants. Instead the ever-growing majority are British-born, British-reared and British-educated, and their families frequently established themselves in Britain two or even three generations back.
In view of all these changes, there some obvious questions which need to be asked. How are they faring? How far have the older generation of settlers – many of whom are now reaching retirement aged – managed to overcome the sub-proletarian status to which they were initially assigned? And yet more pertinently still, have members of the locally-born second and third generation been any more successful – given their much greater familiarity with English ways – in overcoming the obstacles of exclusionism than were their parents and grandparents? Not only are such questions now well worth asking, but thanks to the inclusion of a explicitly formulated ethnic question in the 1991 Census, together with its use in all manner of other data collection activities, we can at long last begin to answer those questions in a systematic and reasonably reliable way.
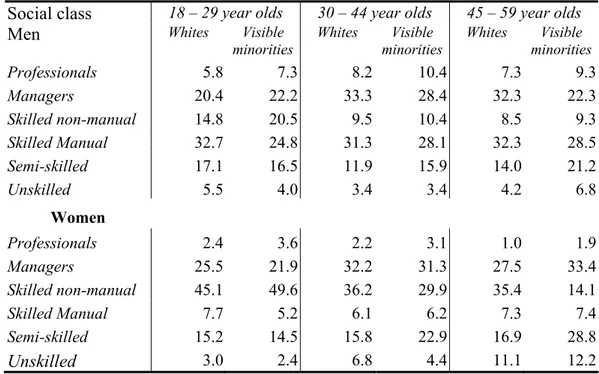
Looking firstly at the position of the visible minorities in the class hierarchy, one of the most striking features of Table 1 is how far members of the visible minority population taken as a whole had managed to distance themselves from the sub-proletarian position in which they began by the time the census was taken in 1991. Perhaps not unexpectedly it is members of the oldest age cohort, and women much more than men, who have made the least progress. The great majority lacked any kind of formal educational qualification when they first arrived in the UK, and English very often
the members of the far right hand column of the can still be described as a sub-proletariat, especially in the sense which they undoubtedly were at the very outset, is clearly erroneous. Whilst older women and men of colour are indeed rather more heavily concentrated in semi-skilled manual work than are their White counterparts, the difference between them – although significant – is no longer so great that it can reasonably be described as a yawning gulf. Meanwhile at the other end of age scale we find yet more dramatic signs of progress, so much so that a higher proportion of ethnic minority men aged between 18 and 29 are now to be found in each of the top three social classes than is the case amongst their white counterparts; controlling for gender, younger minority women do not lag far behind. In other however much of sub-proletariat members of the visible minorities may have formed when they first arrived, there is little – if any – merit in seeking to use a term of that kind as a means of explaining their current position in the British social order. It simply does not fit the facts.
Social class 18 – 29 year olds 30 – 44 year olds 45 – 59 year olds
Men Whites Visible
minorities Whites Visible
minorities Whites Visible
minorities
Professionals 5.8 7.3 8.2 10.4 7.3 9.3
Managers 20.4 22.2 33.3 28.4 32.3 22.3
Skilled non-manual 14.8 20.5 9.5 10.4 8.5 9.3
Skilled Manual 32.7 24.8 31.3 28.1 32.3 28.5
Semi-skilled 17.1 16.5 11.9 15.9 14.0 21.2
Unskilled 5.5 4.0 3.4 3.4 4.2 6.8
Women
Professionals 2.4 3.6 2.2 3.1 1.0 1.9
Managers 25.5 21.9 32.2 31.3 27.5 33.4
Skilled non-manual 45.1 49.6 36.2 29.9 35.4 14.1
Skilled Manual 7.7 5.2 6.1 6.2 7.3 7.4
Semi-skilled 15.2 14.5 15.8 22.9 16.9 28.8
Unskilled 3.0 2.4 6.8 4.4 11.1 12.2
Table 1 Percentage distribution of economically active non-white men and women to their white counterparts, by age-group and social class.
Source: 1991 Census, Ethnic Group and Country of Birth, Table 16.
That does not mean, however, that the facts themselves are at all straightforward, or in any way easy to explain, not least because the figures in Table 1 conceal at least as much as they reveal. In the first place the figures in Table 1 make no reference to levels of unemployment – which were substantially higher amongst most sections of the visible minority population than they were amongst the indigenous majority in 1991, and remain so to this day. Secondly, and perhaps even
more importantly, the visible minority population is not – at least in it members’ own terms – a homogeneous population group. To be sure they form a social category of those subjected to racial exclusionism, thanks to the continued commitment of members of Britain’s white majority to using skin colour as an inescapable indicator of alterity; however in their own terms, rather than those laid down by their excluders, members of this section of the population see themselves as being affiliated to a whole host of ethnically specific communities. And once we begin to factor these considerations into the statistics, some yet more complex patterns begin to emerge.
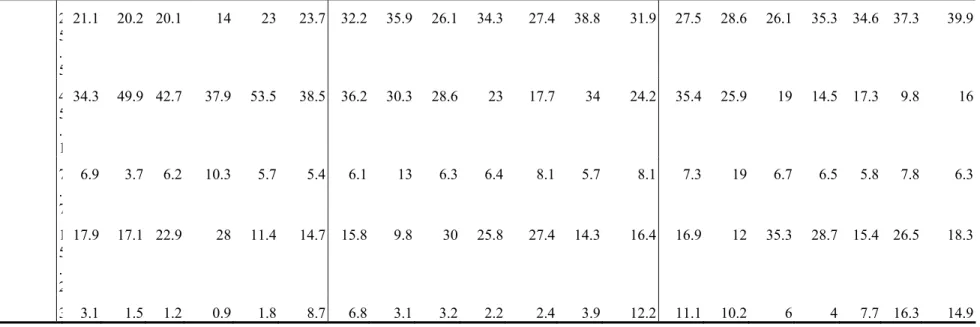
Once the catch-all ‘visible minority’ category has been exploded into those of its ethnic components which the census data currently allows us to identify – as has been done in Table 2 – it becomes clear that many further complexities lie concealed behind the broad patterns revealed in Table 1. In particular it is immediately apparent that inter-minority differences are at least as great, and certainly just as analytically significant, as those thrown up by a simplistic juxtaposition of the achievements of ‘whites’ as against ‘blacks’.
Nevertheless these figures still need to be approached with very considerable care. Hence, for example, whilst the exceptionally high proportion of 45 – 49 year old Bangladeshi women and men who show up as professionals is statistically accurate, the figures displayed in the table also need to be understood against an awareness of their specific ethnic context, namely the exceptionally low levels of economic activity displayed by older Bengalis of rural origin, which are in turn due to very high levels of long-term unemployment and ill-health (for men), together and their wives’ equally striking reluctance to enter the waged labour market. Hence even though doctors only form a very small proportion of Britain’s Bangladeshi population, given that most of them were recruited in the sixties and seventies, many are now in their fifties but still very actively employed, whilst an unusually high proportion of their labour-migrant peers have now withdrawn from active participation in the employment market.
ge Group 18 – 29 year olds 30 – 44 year olds 45 – 59 year olds Ethnic group
s
Chinese Indian Pakistani Bangladeshi Black Caribbean Black African White Chinese Indian Pakistani Bangladeshi Black Caribbean Black African White Chinese Indian Pakistani Bangladeshi Black Caribbean Black African
s 5
. 8
21.4 11.1 6.5 2.8 2.8 7.9 8.2 17.2 12 6.8 4.2 4.1 15.7 7.3 9.2 14.8 7.2 10.5 1.4 12.9
2 0 . 4
18.7 25.4 19.2 7.2 19.3 17.2 33.3 22.9 30.4 23.4 14.3 22.2 27.8 32.3 18.5 30.8 25.2 14.7 10.3 24
manual 1
4 . 8
16.4 21.1 18.3 14 19.8 23.2 9.5 19.5 10.3 9.7 21.2 8.9 13.4 8.5 24.3 12 10.8 20.5 4.4 14.8
ual 3
2 . 7
25.7 20.9 23.7 31.7 31.7 17.7 31.3 31 25.6 32.7 33 42.7 17.4 32.3 38.4 20.2 27 21 42 18
1 7 . 1
12.6 15.9 23.3 37.3 17.4 16.6 11.9 6.3 16.8 20.2 22.2 14.9 14.1 14 5.6 16.3 20.6 22.5 28.4 18.9
5 . 5
2.7 3 4.8 2.5 4.2 7.9 3.4 0.7 2.8 4.3 1.9 3.9 6.3 4.2 2.5 3.8 6.4 7.1 10.7 7.6
s 2
. 4
14.6 5.6 3.2 0.9 1.5 4.5 2.2 6.1 4 3.7 7.3 1.4 4.1 1 2.7 4.4 6.2 17.3 0.2 1.1
5 . 5
manual 4
5 . 1
34.3 49.9 42.7 37.9 53.5 38.5 36.2 30.3 28.6 23 17.7 34 24.2 35.4 25.9 19 14.5 17.3 9.8 16
ual 7
. 7
6.9 3.7 6.2 10.3 5.7 5.4 6.1 13 6.3 6.4 8.1 5.7 8.1 7.3 19 6.7 6.5 5.8 7.8 6.3
1 5 . 2
17.9 17.1 22.9 28 11.4 14.7 15.8 9.8 30 25.8 27.4 14.3 16.4 16.9 12 35.3 28.7 15.4 26.5 18.3
3 3.1 1.5 1.2 0.9 1.8 8.7 6.8 3.1 3.2 2.2 2.4 3.9 12.2 11.1 10.2 6 4 7.7 16.3 14.9
Table 2 Percentage distribution of economically active non-white men and women to their white counterparts, by age-group and social class.
Source: 1991 Census, Ethnic Group and Country of Birth, Table 16.
But although this serves to remind us that the specific character of the group in question must always be borne in mind when analysing ethnic data – if only to ensure that one is really comparing like with like – the most salient feature of the array of figures set forth in Table 2 is comparatively easy to identify. In the first place no ethnic group – and no age group within any given ethnic group – is now so heavily concentrated at the bottom of the class hierarchy as to suggest that it is any way appropriate to identify its members unambiguously as an ‘under-class’ or ‘sub-proletariat’; but secondly, and just as importantly, the figures also show that both the extent and the character of the upward mobility achieved by the minorities varies enormously – and no less so by gender and age than by ethnic group. From this perspective Chinese and Indian men in the 18 – 29 year old age- cohort appear to be amongst the most successful of all, at least by comparison with their white counterparts, whilst older Afro-Caribbean men appear to be amongst the least successful. But before leaping to instant conclusions about the possible associations between ethnicity and success, it is also worth noting that women’s achievements differ quite strikingly from men. Hence for example, an exceptionally high proportion of older Afro-Caribbean women are classified as being of managerial status, whilst younger Afro-Caribbean women’s achievements compare well with that of all other women in that age-group, apart from the exceptionally successful Chinese. Hence although the Table reveals an extensive degree of inter-ethnic differentiation in upward social mobility, it is nevertheless quite impossible to rank members of the six major ethnic categories along a single continuum from the less to the more successful.
Such a finding is by no means novel, of course, for this picture complex differentials by gender, by age, as well as by ethnic affiliation is wholly congruent with the conclusions which Modood et. al.
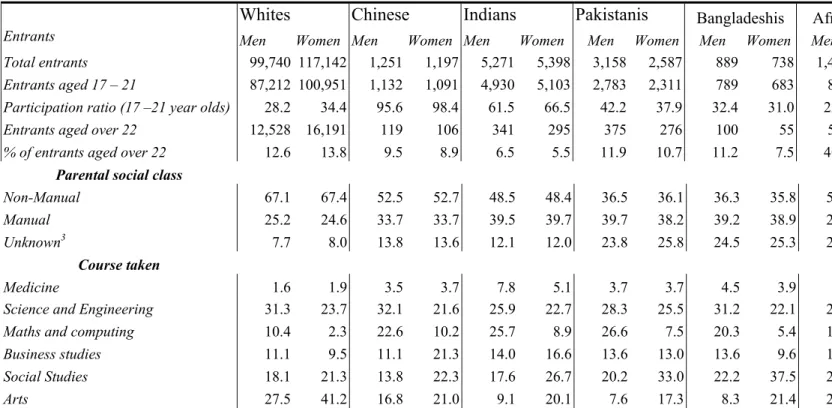
(1997) draw from the data collected in the 4th PSI Survey. Yet although it is now becoming increasingly clear that explaining these multi-dimensional patterns of inter-ethnic difference – as opposed to merely seeking to measure a unilateral condition of racial disadvantage – is the central issue which analysts in this field need to address, the results of the 1991 Census, as well as of the 4th PSI Survey, are becoming increasingly ill-suited for this task. Thus whilst the Census has the huge advantage of being based on a 100% sample, its data was not only collected the best part of a decade ago; and whilst the PSI survey was conducted rather more recently, and its relatively small sample data was drawn up in such a way that it cannot be viewed as perfectly statistically representative of the population as a whole. Hence in the remainder of this Chapter I have relied on data drawn from two much more recently constructed datasets: the Labour Force Survey for the period 1996 – 1998, and 1998 University entrance data released by the Universities and Colleges Admissions Service – both of which include ‘ethnic group’ in the sense used in the Census as a variable.
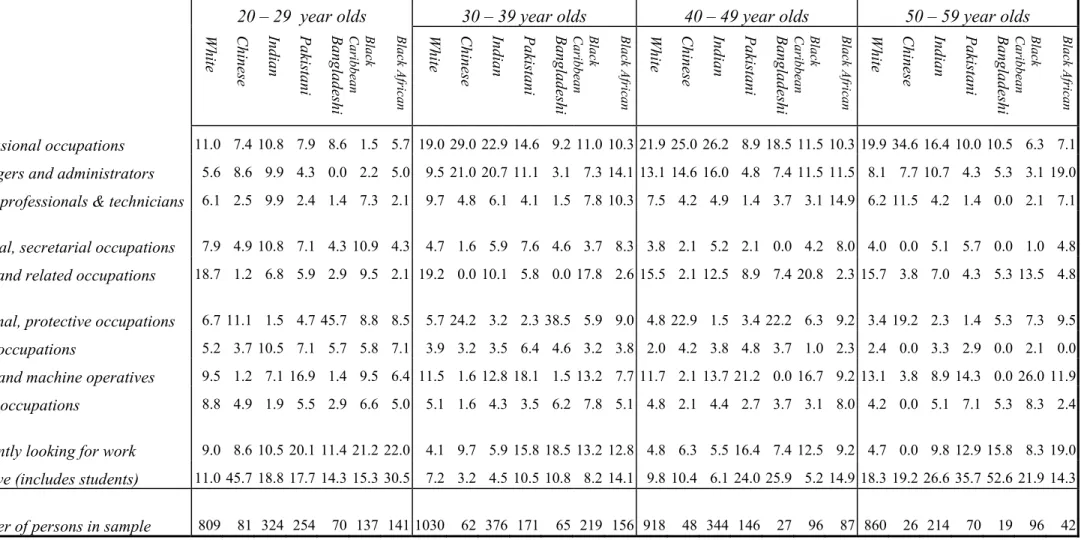
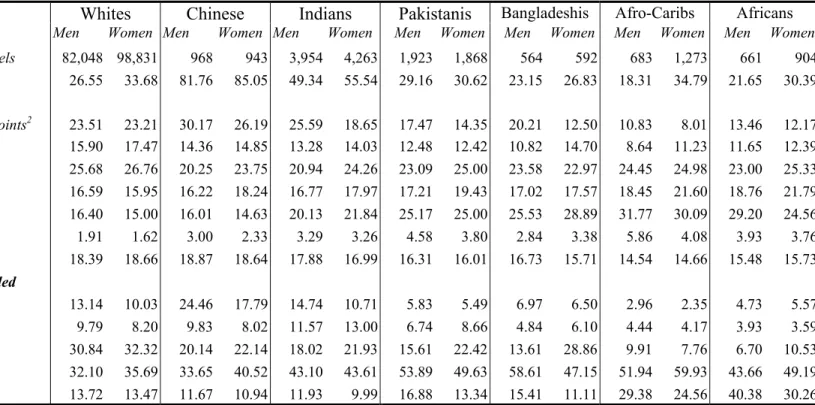
Yet although these datasets allow us to ask some much more detailed, more penetrating, and of course more up-to-date questions about inter-ethnic differentials in upward mobility than is possible with either the Census or the PSI, representing the complex patterns which emerge in a way which will be comprehensible to readers is an extremely challenging task. The solution adopted here as is follows. Tables 3 and 4 have exactly the same format Table 2, but by using data drawn from LFS, it is not only possible to identify a considerably wider range of occupational groups, but also the numbers – and hence the proportion – of men (Table 3) or women (Table 4) drawn from that ethnic group and falling into that age category who are ‘actively looking for work’, and hence unemployed. Last but not least the LFS also counts the number of people who are neither working nor looking for work – although given the LFS’s priorities, it provides a poor guide as to how many of these individuals are primarily engaged in looking after themselves and others at home, and how many are students.
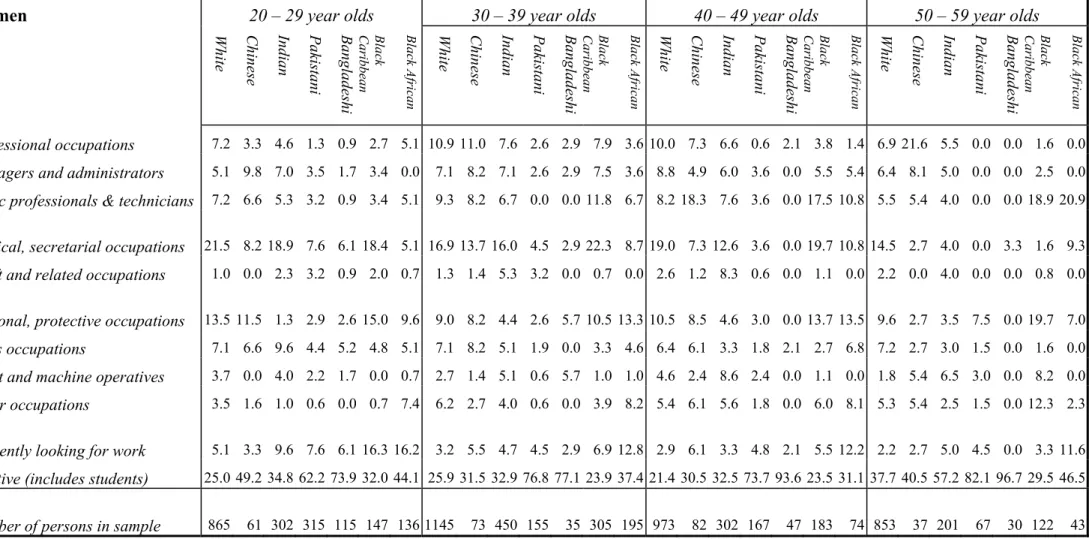
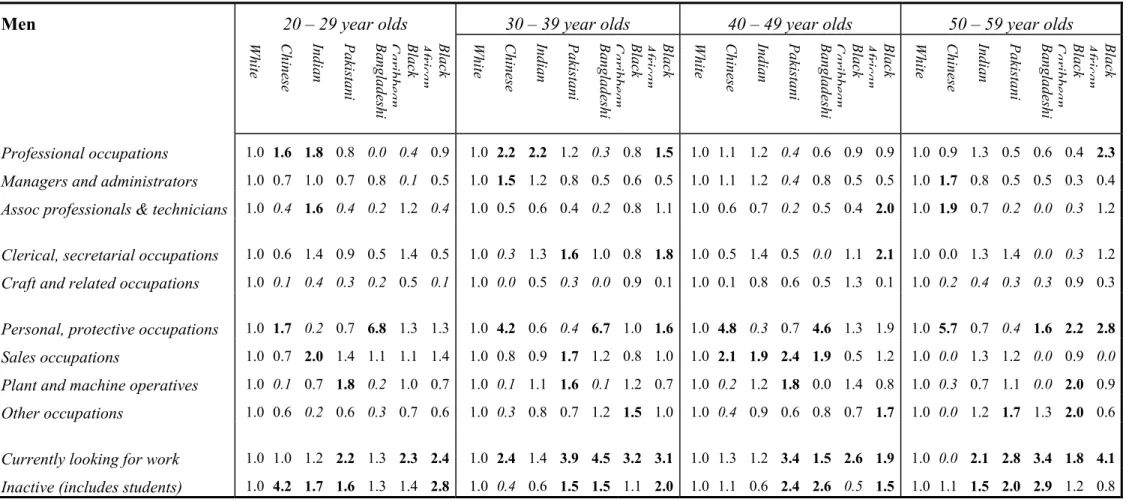
Yet although the differentials revealed in Tables 3 and 4 are undoubtedly extremely significant, the underlying patterns are hard to detect, and even harder to digest. Hence Tables 5 and 6 are based on exactly the same data as that set out in Tables 3 and 4, but this time the figures are ratios of the proportion of persons in any given ethnic group and age cohort as compared with their white counterparts. Hence whilst whites always by definition always score 1.0, a figure of 2.0 in any cell indicates that those persons are twice as frequently found in that occupational category than their white counterparts, and a figure of 0.5 that they are only half as likely to be so. To further aid comprehension I have set all scores greater than 1.5 in bold, and all those less than 0.5 in italics.
Men 20 – 29 year olds 30 – 39 year olds 40 – 49 year olds 50 – 59 year olds
White Chinese Indian Pakistani Bangladeshi Black Caribbean Black African White Chinese Indian Pakistani Bangladeshi Black Caribbean Black African White Chinese Indian Pakistani Bangladeshi Black Caribbean Black African White Chinese Indian Pakistani Bangladeshi Black Caribbean Black African
Professional occupations 11.0 7.4 10.8 7.9 8.6 1.5 5.7 19.0 29.0 22.9 14.6 9.2 11.0 10.3 21.9 25.0 26.2 8.9 18.5 11.5 10.3 19.9 34.6 16.4 10.0 10.5 6.3 7.1 Managers and administrators 5.6 8.6 9.9 4.3 0.0 2.2 5.0 9.5 21.0 20.7 11.1 3.1 7.3 14.1 13.1 14.6 16.0 4.8 7.4 11.5 11.5 8.1 7.7 10.7 4.3 5.3 3.1 19.0 Assoc professionals & technicians 6.1 2.5 9.9 2.4 1.4 7.3 2.1 9.7 4.8 6.1 4.1 1.5 7.8 10.3 7.5 4.2 4.9 1.4 3.7 3.1 14.9 6.2 11.5 4.2 1.4 0.0 2.1 7.1
Clerical, secretarial occupations 7.9 4.9 10.8 7.1 4.3 10.9 4.3 4.7 1.6 5.9 7.6 4.6 3.7 8.3 3.8 2.1 5.2 2.1 0.0 4.2 8.0 4.0 0.0 5.1 5.7 0.0 1.0 4.8 Craft and related occupations 18.7 1.2 6.8 5.9 2.9 9.5 2.1 19.2 0.0 10.1 5.8 0.0 17.8 2.6 15.5 2.1 12.5 8.9 7.4 20.8 2.3 15.7 3.8 7.0 4.3 5.3 13.5 4.8
Personal, protective occupations 6.7 11.1 1.5 4.7 45.7 8.8 8.5 5.7 24.2 3.2 2.3 38.5 5.9 9.0 4.8 22.9 1.5 3.4 22.2 6.3 9.2 3.4 19.2 2.3 1.4 5.3 7.3 9.5 Sales occupations 5.2 3.7 10.5 7.1 5.7 5.8 7.1 3.9 3.2 3.5 6.4 4.6 3.2 3.8 2.0 4.2 3.8 4.8 3.7 1.0 2.3 2.4 0.0 3.3 2.9 0.0 2.1 0.0 Plant and machine operatives 9.5 1.2 7.1 16.9 1.4 9.5 6.4 11.5 1.6 12.8 18.1 1.5 13.2 7.7 11.7 2.1 13.7 21.2 0.0 16.7 9.2 13.1 3.8 8.9 14.3 0.0 26.0 11.9 Other occupations 8.8 4.9 1.9 5.5 2.9 6.6 5.0 5.1 1.6 4.3 3.5 6.2 7.8 5.1 4.8 2.1 4.4 2.7 3.7 3.1 8.0 4.2 0.0 5.1 7.1 5.3 8.3 2.4
Currently looking for work 9.0 8.6 10.5 20.1 11.4 21.2 22.0 4.1 9.7 5.9 15.8 18.5 13.2 12.8 4.8 6.3 5.5 16.4 7.4 12.5 9.2 4.7 0.0 9.8 12.9 15.8 8.3 19.0 Inactive (includes students) 11.0 45.7 18.8 17.7 14.3 15.3 30.5 7.2 3.2 4.5 10.5 10.8 8.2 14.1 9.8 10.4 6.1 24.0 25.9 5.2 14.9 18.3 19.2 26.6 35.7 52.6 21.9 14.3
Number of persons in sample 809 81 324 254 70 137 141 1030 62 376 171 65 219 156 918 48 344 146 27 96 87 860 26 214 70 19 96 42
Table 3 Proportion of men in each ethnic group and in successive ten-year age cohorts by major occupational group;
Source: QLFS96q4 + QLFS98q1, using 100% of minority cases, and a 5% sample of white cases
Women 20 – 29 year olds 30 – 39 year olds 40 – 49 year olds 50 – 59 year olds
White Chinese Indian Pakistani Bangladeshi Black Caribbean Black African White Chinese Indian Pakistani Bangladeshi Black Caribbean Black African White Chinese Indian Pakistani Bangladeshi Black Caribbean Black African White Chinese Indian Pakistani Bangladeshi Black Caribbean Black African
Professional occupations 7.2 3.3 4.6 1.3 0.9 2.7 5.1 10.9 11.0 7.6 2.6 2.9 7.9 3.6 10.0 7.3 6.6 0.6 2.1 3.8 1.4 6.9 21.6 5.5 0.0 0.0 1.6 0.0 Managers and administrators 5.1 9.8 7.0 3.5 1.7 3.4 0.0 7.1 8.2 7.1 2.6 2.9 7.5 3.6 8.8 4.9 6.0 3.6 0.0 5.5 5.4 6.4 8.1 5.0 0.0 0.0 2.5 0.0 Assoc professionals & technicians 7.2 6.6 5.3 3.2 0.9 3.4 5.1 9.3 8.2 6.7 0.0 0.0 11.8 6.7 8.2 18.3 7.6 3.6 0.0 17.5 10.8 5.5 5.4 4.0 0.0 0.0 18.9 20.9
Clerical, secretarial occupations 21.5 8.2 18.9 7.6 6.1 18.4 5.1 16.9 13.7 16.0 4.5 2.9 22.3 8.7 19.0 7.3 12.6 3.6 0.0 19.7 10.8 14.5 2.7 4.0 0.0 3.3 1.6 9.3 Craft and related occupations 1.0 0.0 2.3 3.2 0.9 2.0 0.7 1.3 1.4 5.3 3.2 0.0 0.7 0.0 2.6 1.2 8.3 0.6 0.0 1.1 0.0 2.2 0.0 4.0 0.0 0.0 0.8 0.0
Personal, protective occupations 13.5 11.5 1.3 2.9 2.6 15.0 9.6 9.0 8.2 4.4 2.6 5.7 10.5 13.3 10.5 8.5 4.6 3.0 0.0 13.7 13.5 9.6 2.7 3.5 7.5 0.0 19.7 7.0 Sales occupations 7.1 6.6 9.6 4.4 5.2 4.8 5.1 7.1 8.2 5.1 1.9 0.0 3.3 4.6 6.4 6.1 3.3 1.8 2.1 2.7 6.8 7.2 2.7 3.0 1.5 0.0 1.6 0.0 Plant and machine operatives 3.7 0.0 4.0 2.2 1.7 0.0 0.7 2.7 1.4 5.1 0.6 5.7 1.0 1.0 4.6 2.4 8.6 2.4 0.0 1.1 0.0 1.8 5.4 6.5 3.0 0.0 8.2 0.0 Other occupations 3.5 1.6 1.0 0.6 0.0 0.7 7.4 6.2 2.7 4.0 0.6 0.0 3.9 8.2 5.4 6.1 5.6 1.8 0.0 6.0 8.1 5.3 5.4 2.5 1.5 0.0 12.3 2.3
Currently looking for work 5.1 3.3 9.6 7.6 6.1 16.3 16.2 3.2 5.5 4.7 4.5 2.9 6.9 12.8 2.9 6.1 3.3 4.8 2.1 5.5 12.2 2.2 2.7 5.0 4.5 0.0 3.3 11.6 Inactive (includes students) 25.0 49.2 34.8 62.2 73.9 32.0 44.1 25.9 31.5 32.9 76.8 77.1 23.9 37.4 21.4 30.5 32.5 73.7 93.6 23.5 31.1 37.7 40.5 57.2 82.1 96.7 29.5 46.5
Number of persons in sample 865 61 302 315 115 147 136 1145 73 450 155 35 305 195 973 82 302 167 47 183 74 853 37 201 67 30 122 43
Table 4 Proportion of women in each ethnic group and in successive ten-year age cohorts by major occupational group;
Source: QLFS96q4 + QLFS98q1, using 100% of minority cases, and a 5% sample of white cases
Men 20 – 29 year olds 30 – 39 year olds 40 – 49 year olds 50 – 59 year olds
White Chinese Indian Pakistani Bangladeshi Black Caribbean Black African White Chinese Indian Pakistani Bangladeshi Black Caribbean Black African White Chinese Indian Pakistani Bangladeshi Black Caribbean Black African White Chinese Indian Pakistani Bangladeshi Black Caribbean Black African
Professional occupations 1.0 1.6 1.8 0.8 0.0 0.4 0.9 1.0 2.2 2.2 1.2 0.3 0.8 1.5 1.0 1.1 1.2 0.4 0.6 0.9 0.9 1.0 0.9 1.3 0.5 0.6 0.4 2.3 Managers and administrators 1.0 0.7 1.0 0.7 0.8 0.1 0.5 1.0 1.5 1.2 0.8 0.5 0.6 0.5 1.0 1.1 1.2 0.4 0.8 0.5 0.5 1.0 1.7 0.8 0.5 0.5 0.3 0.4 Assoc professionals & technicians 1.0 0.4 1.6 0.4 0.2 1.2 0.4 1.0 0.5 0.6 0.4 0.2 0.8 1.1 1.0 0.6 0.7 0.2 0.5 0.4 2.0 1.0 1.9 0.7 0.2 0.0 0.3 1.2
Clerical, secretarial occupations 1.0 0.6 1.4 0.9 0.5 1.4 0.5 1.0 0.3 1.3 1.6 1.0 0.8 1.8 1.0 0.5 1.4 0.5 0.0 1.1 2.1 1.0 0.0 1.3 1.4 0.0 0.3 1.2 Craft and related occupations 1.0 0.1 0.4 0.3 0.2 0.5 0.1 1.0 0.0 0.5 0.3 0.0 0.9 0.1 1.0 0.1 0.8 0.6 0.5 1.3 0.1 1.0 0.2 0.4 0.3 0.3 0.9 0.3
Personal, protective occupations 1.0 1.7 0.2 0.7 6.8 1.3 1.3 1.0 4.2 0.6 0.4 6.7 1.0 1.6 1.0 4.8 0.3 0.7 4.6 1.3 1.9 1.0 5.7 0.7 0.4 1.6 2.2 2.8 Sales occupations 1.0 0.7 2.0 1.4 1.1 1.1 1.4 1.0 0.8 0.9 1.7 1.2 0.8 1.0 1.0 2.1 1.9 2.4 1.9 0.5 1.2 1.0 0.0 1.3 1.2 0.0 0.9 0.0 Plant and machine operatives 1.0 0.1 0.7 1.8 0.2 1.0 0.7 1.0 0.1 1.1 1.6 0.1 1.2 0.7 1.0 0.2 1.2 1.8 0.0 1.4 0.8 1.0 0.3 0.7 1.1 0.0 2.0 0.9 Other occupations 1.0 0.6 0.2 0.6 0.3 0.7 0.6 1.0 0.3 0.8 0.7 1.2 1.5 1.0 1.0 0.4 0.9 0.6 0.8 0.7 1.7 1.0 0.0 1.2 1.7 1.3 2.0 0.6
Currently looking for work 1.0 1.0 1.2 2.2 1.3 2.3 2.4 1.0 2.4 1.4 3.9 4.5 3.2 3.1 1.0 1.3 1.2 3.4 1.5 2.6 1.9 1.0 0.0 2.1 2.8 3.4 1.8 4.1 Inactive (includes students) 1.0 4.2 1.7 1.6 1.3 1.4 2.8 1.0 0.4 0.6 1.5 1.5 1.1 2.0 1.0 1.1 0.6 2.4 2.6 0.5 1.5 1.0 1.1 1.5 2.0 2.9 1.2 0.8
Table 5 Ratios of non-white men to their white counterparts, by age-group, ethnic group and occupational category Source: QLFS96q4 + QLFS98q1, using 100% of minority cases, and a 5% sample of white cases
Key: Since the figures in this grid are ratios, White always = 1.0; if the proportion of members of a minority group involved in a given occupation is twice as great as amongst the whites, they are recorded as scoring 2.0; if half as great they score 0.5, etc. For ease of comprehension if the score is greater than 1.5 it appears in bold, and if less than 0.5 in italics.
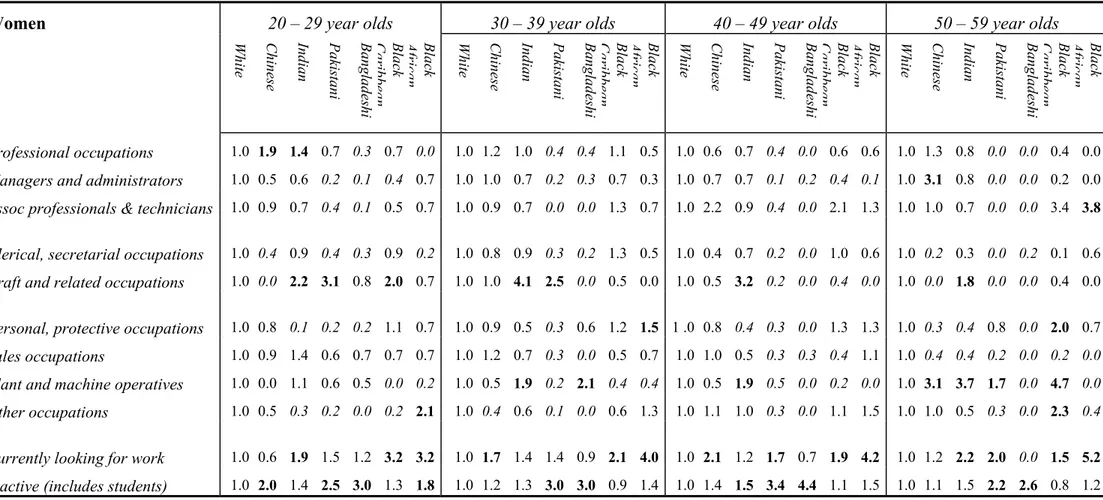
Women 20 – 29 year olds 30 – 39 year olds 40 – 49 year olds 50 – 59 year olds
White Chinese Indian Pakistani Bangladeshi Black Caribbean Black African White Chinese Indian Pakistani Bangladeshi Black Caribbean Black African White Chinese Indian Pakistani Bangladeshi Black Caribbean Black African White Chinese Indian Pakistani Bangladeshi Black Caribbean Black African
Professional occupations 1.0 1.9 1.4 0.7 0.3 0.7 0.0 1.0 1.2 1.0 0.4 0.4 1.1 0.5 1.0 0.6 0.7 0.4 0.0 0.6 0.6 1.0 1.3 0.8 0.0 0.0 0.4 0.0 Managers and administrators 1.0 0.5 0.6 0.2 0.1 0.4 0.7 1.0 1.0 0.7 0.2 0.3 0.7 0.3 1.0 0.7 0.7 0.1 0.2 0.4 0.1 1.0 3.1 0.8 0.0 0.0 0.2 0.0 Assoc professionals & technicians 1.0 0.9 0.7 0.4 0.1 0.5 0.7 1.0 0.9 0.7 0.0 0.0 1.3 0.7 1.0 2.2 0.9 0.4 0.0 2.1 1.3 1.0 1.0 0.7 0.0 0.0 3.4 3.8
Clerical, secretarial occupations 1.0 0.4 0.9 0.4 0.3 0.9 0.2 1.0 0.8 0.9 0.3 0.2 1.3 0.5 1.0 0.4 0.7 0.2 0.0 1.0 0.6 1.0 0.2 0.3 0.0 0.2 0.1 0.6 Craft and related occupations 1.0 0.0 2.2 3.1 0.8 2.0 0.7 1.0 1.0 4.1 2.5 0.0 0.5 0.0 1.0 0.5 3.2 0.2 0.0 0.4 0.0 1.0 0.0 1.8 0.0 0.0 0.4 0.0
Personal, protective occupations 1.0 0.8 0.1 0.2 0.2 1.1 0.7 1.0 0.9 0.5 0.3 0.6 1.2 1.5 1 .0 0.8 0.4 0.3 0.0 1.3 1.3 1.0 0.3 0.4 0.8 0.0 2.0 0.7 Sales occupations 1.0 0.9 1.4 0.6 0.7 0.7 0.7 1.0 1.2 0.7 0.3 0.0 0.5 0.7 1.0 1.0 0.5 0.3 0.3 0.4 1.1 1.0 0.4 0.4 0.2 0.0 0.2 0.0 Plant and machine operatives 1.0 0.0 1.1 0.6 0.5 0.0 0.2 1.0 0.5 1.9 0.2 2.1 0.4 0.4 1.0 0.5 1.9 0.5 0.0 0.2 0.0 1.0 3.1 3.7 1.7 0.0 4.7 0.0 Other occupations 1.0 0.5 0.3 0.2 0.0 0.2 2.1 1.0 0.4 0.6 0.1 0.0 0.6 1.3 1.0 1.1 1.0 0.3 0.0 1.1 1.5 1.0 1.0 0.5 0.3 0.0 2.3 0.4
Currently looking for work 1.0 0.6 1.9 1.5 1.2 3.2 3.2 1.0 1.7 1.4 1.4 0.9 2.1 4.0 1.0 2.1 1.2 1.7 0.7 1.9 4.2 1.0 1.2 2.2 2.0 0.0 1.5 5.2 Inactive (includes students) 1.0 2.0 1.4 2.5 3.0 1.3 1.8 1.0 1.2 1.3 3.0 3.0 0.9 1.4 1.0 1.4 1.5 3.4 4.4 1.1 1.5 1.0 1.1 1.5 2.2 2.6 0.8 1.2
Table 6 Ratios of non-white women to their white counterparts, by age-group, ethnic group and occupational category Source: QLFS96q4 + QLFS98q1, using 100% of minority cases, and a 5% sample of white cases
Key: Since the figures in this grid are ratios, White always = 1.0; if the proportion of members of a minority group involved in a given occupation is twice as great as amongst the whites, they are recorded as scoring 2.0; if half as great they score 0.5, etc. For ease of comprehension if the score is greater than 1.5 it appears in bold, and if less than 0.5 in italics..
What, though, about the patterns which emerge as a result of performing such an exercise? As the figures in Table 5 yet again confirm, the Chinese and the Indians are not only achieving by far the highest level of upward social mobility of all the visible minority communities, but are now significantly outperforming the white population as a whole in terms of the scale of their entry into professional occupations. Indeed by the time they reach their thirties, men from both groups are more than twice as likely as their white counterparts to be professionally employed; moreover by comparison with their achievements, Pakistani and the African men fall some way behind, whilst both the Black Caribbeans and the Bangladeshi yet further behind still. Turning next to the extent that minority women have found their way into the top three occupational categories, the Chinese and the Indians once again stand out as being the most successful, even if this has not been – or at least has not yet been – quite so dramatic as their male counterparts, whilst Pakistani and Bangladeshi women have as yet achieved very much less, Afro-Caribbean women, and most especially those in their thirties, have made a very creditable showing in the top three occupational categories.
If, next, we turn to the bottom end of the occupational hierarchy, Table 5 not only confirms the success with which visible minority men have moved away from the jobs as plant and machine operatives in the now much depleted industrial sectors in which they began, but also that there is an ethnic dimension to that exodus, since only the Pakistanis (and to a much lesser extent the Afro- Caribbeans, the Africans and the older Indians) are over-concentrated in this sector. But in identifying where they have gone, it is worth noting just how heavily over-represented the Bangladeshis and all but the youngest age-cohort of Chinese are in the ‘personal and protective’
sector – which along with sales, is where those working in restaurants and the fast-food trade are routinely categorised. Turning next to their female counterparts, it is striking that whilst older Afro- Caribbean, Chinese, Indian and Pakistani women are all still very strikingly over-represented in what one might describe as ‘bottom of the pile’ manufacturing jobs, this tendency has wholly evaporated in every group but the Indians drawn from amongst the youngest age cohort, all of whom – with the exception of Bangladeshis and the Africans – are heavily over-represented in Craft and related occupations if they have not moved on into Professional jobs.
Finally it is also worth taking a close look at what is going on right at the bottom of the Tables in the rows marked ‘Currently looking for work’ and ‘Inactive’. Moreover if we look back to Tables 3 and 4, the currently looking for work figures could equally well have been marked ‘percentage unemployed’, and from this perspective some very striking differentials arise, not least because in every group but the Chinese (and this would appear to be a sampling error), levels of
are amongst the white majority; a similar pattern can also be found amongst women. Hence if the upper portions of these Tables provides plentiful evidence of minority success, these rows provide the clearest possible evidence that such achievements are not plain sailing: higher levels of unemployment provide a very clear measure of the greater degree of difficulty which members of the visible minorities encounter in actually getting a job.
Finally an examination of the last row in the four tables is also instructive, even though the catch-all
‘inactive’ category rather unhelpfully aggregates full-time students (who presumably will enter the employment market as soon as they have gained their qualifications) with those who are not participating for all manner of other reasons. Nevertheless the inter-ethnic variations in this sphere are no less striking than those elsewhere. Whilst sharply raised levels of inactivity amongst both men and women of all the minority groups is best accounted for as the outcome of their much higher levels of participation in higher education (a subject which will shortly be addressed in its own right), patterns of inactivity amongst the older age groups, and especially amongst older women, deserve very careful attention. Assuming that involvement in full-time education is not statistically significant amongst the over-40s, one of the most striking features of the figures in Table 4 is that the great majority of older Pakistani, and even more so of Bangladeshi women are non-participants in the waged labour market. By contrast Indian women in their 40s, and even more so Caribbean women in that age-cohort are a great deal more likely than their white counterparts to go out to work. Given the ever increasing importance of women’s contribution to the budgets of most households, the reluctance of most older Pakistani and Bangladeshi women to seek employment outside the household will inevitably have a negative impact on household budgets, just as the enthusiasm with which Indian women have sought paid employment has had just the opposite effect. Meanwhile Caribbean women stand in a special category of their own, for although no less than half of all Caribbean women head single-parent households, they are not only more likely to go out to work than their white counterparts, regardless of household structure, but are also significantly out-performing Caribbean men in terms of their upward mobility through the employment market. Ethnic agency is clearly at work here.
Since agency is above all a qualitative phenomenon, quantitative data tends, by its very nature, to offer few indications of how such processes of agency actually operate: the only evidence it normally provides are empirical outcomes such as those explored in the last few pages, and for which the only plausible explanation is that the differential patterns we have detected are the outcome of processes of ethnic agency. Sometimes, however, it is possible to go rather further than
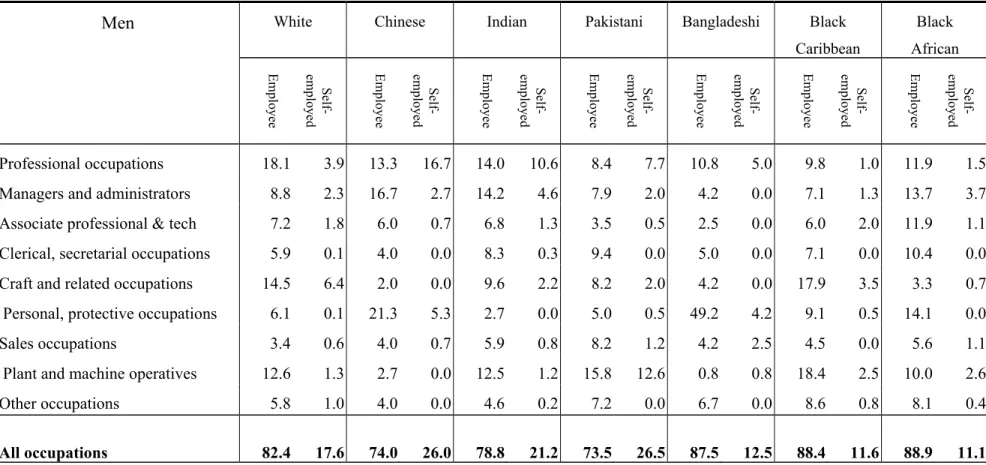
this by exploring the differential basis on which upward mobility appears to have been achieved. It has, of course, long been argued that self-employment can often provide an effective means of circumventing the worst of racial exclusionism, on two grounds: firstly that the kinship-based resources which facilitate the development of entrepreneurial initiatives – and most especially resilient extended family networks – are differentially distributed by ethnicity; and secondly on the grounds that despite the extreme reluctance of most white gate-keepers to allocate scarce resources to members of visible minorities whilst there is still any kind of prospect of diverting them to members of their own group, those self-same excluders frequently display no compunction whatsoever of purchasing goods and services from members of the minorities provided they make their wares available at the right place and the right time, as well as at a keen price. How far, therefore, does the LFS serve to confirm that such processes may currently be at work?
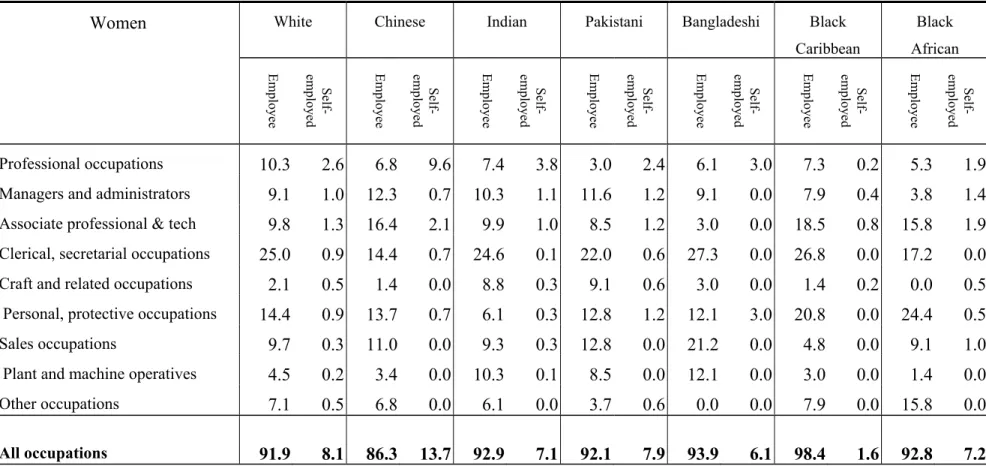
Tables 5 and 6 are based solely on data on those people who are actively employed, and sets out the percentage of persons in each ethnic group who fall into the nine major occupational categories, but further differentiating them by whether, within each of these categories, those involved are paid employees or self-employed. For simplicity’s sake no age dimension has been introduced into either of these Tables. In making sense of the two Tables the best place to begin is right at the bottom, for the row marked ‘all occupations’ gives an overall indication of the percentage of ethnic group members who are self employed. In these terms Table 5 shows that whilst the Chinese, the Indian and Pakistani men are considerably more likely to be self-employed than their white counterparts, Bangladeshis, Black Caribbeans and Black Africans – who in broad terms are also less upwardly mobile – are considerably less likely to be so. It is also worth noting how far the various groups differ in terms of the sector of the employment market where self-employment is most salient. Thus whilst for the whites self-employment is a particularly strongly preferred option amongst skilled craftsmen, the figures suggest that our three most upwardly mobile minority groups – the Chinese, the Indians and the Pakistanis – have used self-employment as a means of breaking into the otherwise highly privileged bastion of the professions. Over and above this the Pakistanis also make a strong showing as self-employed plant and machine operatives, largely as a result of the heavy involvement of middle-aged Pakistani men in driving taxis. By contrast the differential patterns for women set out in Table 6 are so far rather less dramatic, although they also suggest that professionally qualified minority women from all groups except the Black Africans and the Black Caribbeans are finding self-employment offers a particularly effective way of overcoming the obstacles they face.
Men White Chinese Indian Pakistani Bangladeshi Black Caribbean
Black African
Employee Self-employed Employee Self-employed Employee Self-employed Employee Self-employed Employee Self-employed Employee Self-employed Employee Self-employed
Professional occupations 18.1 3.9 13.3 16.7 14.0 10.6 8.4 7.7 10.8 5.0 9.8 1.0 11.9 1.5 Managers and administrators 8.8 2.3 16.7 2.7 14.2 4.6 7.9 2.0 4.2 0.0 7.1 1.3 13.7 3.7 Associate professional & tech 7.2 1.8 6.0 0.7 6.8 1.3 3.5 0.5 2.5 0.0 6.0 2.0 11.9 1.1 Clerical, secretarial occupations 5.9 0.1 4.0 0.0 8.3 0.3 9.4 0.0 5.0 0.0 7.1 0.0 10.4 0.0 Craft and related occupations 14.5 6.4 2.0 0.0 9.6 2.2 8.2 2.0 4.2 0.0 17.9 3.5 3.3 0.7 Personal, protective occupations 6.1 0.1 21.3 5.3 2.7 0.0 5.0 0.5 49.2 4.2 9.1 0.5 14.1 0.0
Sales occupations 3.4 0.6 4.0 0.7 5.9 0.8 8.2 1.2 4.2 2.5 4.5 0.0 5.6 1.1
Plant and machine operatives 12.6 1.3 2.7 0.0 12.5 1.2 15.8 12.6 0.8 0.8 18.4 2.5 10.0 2.6
Other occupations 5.8 1.0 4.0 0.0 4.6 0.2 7.2 0.0 6.7 0.0 8.6 0.8 8.1 0.4
All occupations 82.4 17.6 74.0 26.0 78.8 21.2 73.5 26.5 87.5 12.5 88.4 11.6 88.9 11.1
Table 7 Percentage distribution of employed men in each Ethnic group by status as Employee and Self-employed and by major occupational categories
Source: QLFS96q4 + QLFS98q1, 100% of minority cases, and 5% sample of white cases
Women White Chinese Indian Pakistani Bangladeshi Black Caribbean
Black African
Employee Self-employed Employee Self-employed Employee Self-employed Employee Self-employed Employee Self-employed Employee Self-employed Employee Self-employed
Professional occupations 10.3 2.6 6.8 9.6 7.4 3.8 3.0 2.4 6.1 3.0 7.3 0.2 5.3 1.9
Managers and administrators 9.1 1.0 12.3 0.7 10.3 1.1 11.6 1.2 9.1 0.0 7.9 0.4 3.8 1.4
Associate professional & tech 9.8 1.3 16.4 2.1 9.9 1.0 8.5 1.2 3.0 0.0 18.5 0.8 15.8 1.9 Clerical, secretarial occupations 25.0 0.9 14.4 0.7 24.6 0.1 22.0 0.6 27.3 0.0 26.8 0.0 17.2 0.0
Craft and related occupations 2.1 0.5 1.4 0.0 8.8 0.3 9.1 0.6 3.0 0.0 1.4 0.2 0.0 0.5
Personal, protective occupations 14.4 0.9 13.7 0.7 6.1 0.3 12.8 1.2 12.1 3.0 20.8 0.0 24.4 0.5
Sales occupations 9.7 0.3 11.0 0.0 9.3 0.3 12.8 0.0 21.2 0.0 4.8 0.0 9.1 1.0
Plant and machine operatives 4.5 0.2 3.4 0.0 10.3 0.1 8.5 0.0 12.1 0.0 3.0 0.0 1.4 0.0
Other occupations 7.1 0.5 6.8 0.0 6.1 0.0 3.7 0.6 0.0 0.0 7.9 0.0 15.8 0.0
All occupations 91.9 8.1 86.3 13.7 92.9 7.1 92.1 7.9 93.9 6.1 98.4 1.6 92.8 7.2
Table 8 Percentage distribution of employed women in each Ethnic group by status as Employee and Self-employed and by major occupational categories
Source: QLFS96q4 + QLFS98q1, 100% of minority cases, and 5% sample of white cases
4 Upward mobility through the educational system
Once they had established a toehold in Britain, the only way in which most of the first generation of settlers could hope to dodge the worst impact of racial exclusionism, and hence press their way upwards through the local social order, was through endless hard work, further reinforced by making the most of their own individual and collective entrepreneurial resources; but in the course of so doing only a tiny minority were able to rely on any educational and professional qualifications which they might have brought with them, for even if they possessed such qualifications they soon found that they were routinely devalued by virtually all potential employers. As a result most members of the first generation had little alternative but to start again, virtually from scratch, in their new, largely unfamiliar, and all too often hostile environment.
By contrast the second and third generation have found themselves in a rather different position, not so much because the forces of exclusionism which they encountered were any less, but rather because they own personal experiences were very different. Given that they had been born and brought up in Britain, they were not only far more familiar with the ways of the native English than their parents ever could be, but they also had direct access to the British educational system. It would, of course, be idle to suggest that educational success removes all the obstacles in the way of rapid socio-economic advancement – most particularly if one has the misfortune to belong to an excluded and socially disadvantaged minority. Nevertheless it is equally clear that educational success is a necessary precursor to any kind of upward economic mobility, for without the necessary skills and qualifications there is absolutely no chance whatsoever of challenging those exclusionary tendencies. Hence in making any assessment of the likely future prospects of Britain’s visible minority populations – let alone of explaining the developments highlighted in the previous section – assessing the educational achievements of the rising generation becomes a crucial issue.
Until recently it has been virtually impossible to undertake such an exercise: there is little co- ordination between Local Education Authorities, so despite much verbal commitment to the importance of ethnic monitoring, data on pupils ethnic affiliation is neither routinely nor systematically recorded. But although similar deficiencies can also be observed in many other areas of public service delivery, there is one very significant exception to this regrettable tendency: for some years the Universities and Colleges Admissions Service (UCAS) has collected (and more recently begun to publish) detailed figures on the ethnic affiliation of all home-based students by applying for – and accepted onto – undergraduate degree courses in the UK. Moreover the dataset